ISSN: 2319-8753
I
nternational
J
ournal of
I
nnovative
R
esearch in
S
cience,
E
ngineering and
T
echnology
(An ISO 3297: 2007 Certified Organization)
Vol. 2, Issue 9, September 2013
Copyright to IJIRSET www.ijirset.com 4510
Synthesis
Photoluminescence and
Thermoluminescence study of Ca
2
CeO
4
: Eu
nano Phosphor
P.Sujitha
1,
B.Subba Rao
2, K.V.R.Murthy
3Department of Physics, VSR & NVR College, Tenali-522 20, India1
Department of Physics, VSR & NVR College, Tenali-522 20, India2
Display Materials Laboratory, Applied Physics Department, Faculty of Technology & Engineering, M.S University of
Baroda, Vadodara – 390 001, India3
ABSTRACT: This paper reports the photoluminescence properties of Ca2CeO4 phosphor with different concentrations
of trivalent Europium as dopant. The phosphor is synthesized using the solid state diffusion reaction.
Photoluminescence and thermoluminescence studies are done on the prepared phosphor. For crystal structie and
surface morphology XRD and SEM micrographs of Ca2CeO4 : Eu phosphor was also studied. From XRD and SEM
confirms the formation of nano phosphor in the range around 70nm.
KEYWORDS: Photoluminescence (PL) , X-ray diffraction (XRD)Thermoluminescence (TL) ,solid state reaction (SSR).
I. INTRODUCTION
The luminescence associated with Eu3+ contained in different host lattices has found applications in display devices due to its red light emission [1-3]. Oxide based luminescent materials exhibits good photoluminescence properties which are used as the display device phosphors. The rare earth materials exhibit sharp emission luminescence properties. The characterization of the prepared materials was done using PL,TL,XRD,SEM and particle size analysis techniques.
II. EXPERIMENTAL
The phosphor sample was prepared by solid state diffusion reaction method. The phosphor Ca2CeO4 is prepared from
the compounds calcium carbonate (CaCO3) and cerium oxide (CeO2). The prepared Ca2CeO4 phosphor is weighed and
grounded into a fine powder using agate mortar and pestle about an hour. The grounded mixture was placed in an alumina crucible and heated from room temperature to 12000c in a muffle furnace with a heating rate of 50C/min. After
reaching 12000c the phosphor heated for 3hours and the furnace was allowed to cool to room temperature along with
the samples.
The basic reaction is as follows:
2CaCO3 + CeO2 → Ca2CeO4 +2CO2
III.CHARACTERIZATIONS
ISSN: 2319-8753
I
nternational
J
ournal of
I
nnovative
R
esearch in
S
cience,
E
ngineering and
T
echnology
(An ISO 3297: 2007 Certified Organization)
Vol. 2, Issue 9, September 2013
Copyright to IJIRSET www.ijirset.com 4511 IV.RESULTS AND DISCUSSIONS
(A)Photoluminescence study:
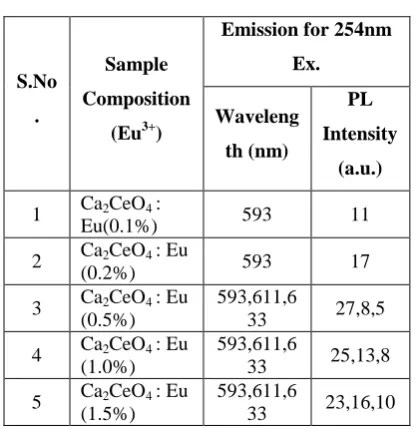
Fig I(a) and fig I(b) shows the PL spectra of Ca2CeO4 : Eu3+ when excited 254nm. The PL emission spectra of
samples were recorded for the excitation wavelength of 254nm for different concentrations of Eu. The excitation of the Ca2CeO4 : Eu3+ phosphor with 254nm wavelength generates photoluminescence emission at 593,611 and 633nm
with intensities of around 25a.u. The peaks at 611 and 633nm are due to electric dipole transition
Fig I(A) : PL of Ca2CeO4 : Eu with 254nm excitation
600 650
0 10 20 30
633
612
593
e
d
c b
a
PL of Ca
2CeO4 : Eu 3+
with254nm excitation
Inten
si
ty
(a.u)
Wavelength(nm)
Eu (0.1%) (a) Eu (0.2%) (b) Eu (0.5%) (c) Eu (1.0%) (d) Eu (1.5%) (e)
Fig I(B) :PL of Ca2CeO4 : Eu with 254nm excitation
Fig. 1 (A&B) are the Eu3+ emissions of Ca2CeO4 : Eu when exciting with 254nm which are 593, 611 and 633nm. From
Fig. 1 (A&B) it is observed that there is a uniform PL emission intensity from 400 to 500nm followed by Eu3+ emissions. For better understanding the concentration of Eu and emissions of the phosphors are tabulated in table -1.
200 300 400 500 600 700
0 10 20 30 40 50 60 70
PL of Ca
2CeO4 : Eu 3+
with 254nm Excitation
e d c b a
Inten
si
ty
(a.u)
Wavelength(nm)
ISSN: 2319-8753
I
nternational
J
ournal of
I
nnovative
R
esearch in
S
cience,
E
ngineering and
T
echnology
(An ISO 3297: 2007 Certified Organization)
Vol. 2, Issue 9, September 2013
Copyright to IJIRSET www.ijirset.com 4512
Fig. 2: Intensity Versus Eu concentration in Ca2CeO4
Table -1
From Fig. 1-B it is found that the intensity of 593nm increases linearly upto 0.5% of Eu concentration and then reduces its intensity without changing the emission wavelength. For 613nm peak, the intensity increases linearly, the same pattern is followed for 633nm peak. The peaks at 593, 611 and 633nm are the allowed transitions of Eu3+ emissions. The 593nm emitted peak is due to 5D0 → 7F1 transition of Eu and due to the magnetic dipole with energy 2.2ev. The
peak at 611nm is due to 5D2 → 7F2 transition of Eu with energy 2.02ev and due to electric dipole of phosphor. The peak
at 633nm is the allowed transition of Eu3+ which is due to 5D0 → 7F3 having an energy 1.98ev and also due to electric
dipole. It is a thumb rule in the Eu doped phosphors; the emissions below to 600nm are due to magnetic dipole and above 600nm are due to electric dipole of phosphor whatever the excited wavelength may be[4-7]. Fig.2 is the Eu concentration in Ca2CeO4 versus intensity of 593, 611 and 633nm peaks when excited with 254nm. From fig.2 it is
found the intensity of 593 nm peak intensity peak increases up to Eu concentration 0.5% and other two peaks intensity increase linearly till the Eu concentration in Ca2CeO4 is 1.5%.
0.0 0.2 0.4 0.6 0.8 1.0 1.2 1.4 1.6
4 6 8 10 12 14 16 18 20 22 24 26 28
633 611 593
caceo-325
Inten
sity
(a
.u)
Eu Concentration(mole%)
S.No
.
Sample
Composition
(Eu3+)
Emission for 254nm
Ex.
Waveleng
th (nm)
PL
Intensity
(a.u.)
1 Ca2CeO4 :
Eu(0.1%) 593 11
2 Ca2CeO4 : Eu
(0.2%) 593 17
3 Ca2CeO4 : Eu
(0.5%)
593,611,6
33 27,8,5
4 Ca2CeO4 : Eu (1.0%)
593,611,6
33 25,13,8
5 Ca2CeO4 : Eu (1.5%)
593,611,6
ISSN: 2319-8753
I
nternational
J
ournal of
I
nnovative
R
esearch in
S
cience,
E
ngineering and
T
echnology
(An ISO 3297: 2007 Certified Organization)
Vol. 2, Issue 9, September 2013
Copyright to IJIRSET www.ijirset.com 4513 (B).Thermoluminescence study:
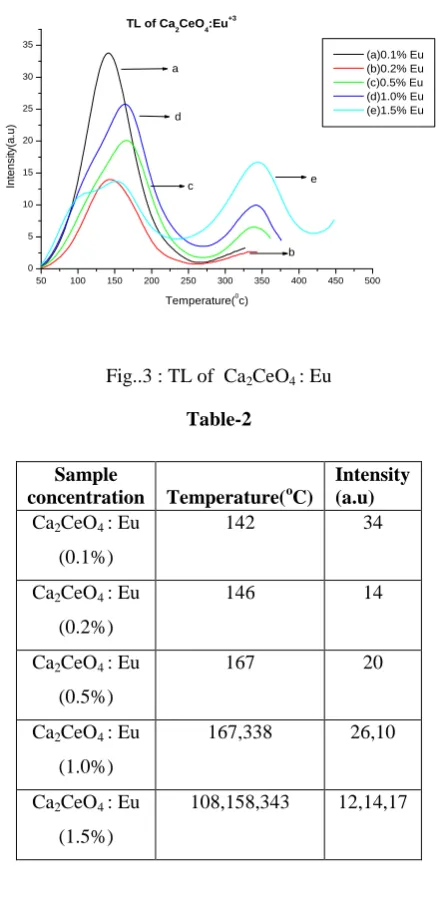
Fig. 3 is the TL emission of Ca2CeO4 : Eu (5Gy beta dose). The TL of the phosphor is recorded immediately after beta
irradiation. The TL is observed for different concentrations of Eu. When the Eu concentration is 0.1% in Ca2CeO4 a
broad isolated and well resolved TL peak is observed at temperature 1420c with an intensity of 34a.u As the Eu concentration increases in Ca2CeO4 a small hump is observed at temperature of 3430C with an intensity of 17a.u when
Eu is 1.5%. Table-2 is the intensities vs temperatures of various observed TL peaks in Ca2CeO4 :Eu
Fig..3 : TL of Ca2CeO4 : Eu
Table-2
Sample concentration
Temperature(oC)
Intensity (a.u)
Ca2CeO4 : Eu
(0.1%)
142 34
Ca2CeO4 : Eu
(0.2%)
146 14
Ca2CeO4 : Eu
(0.5%)
167 20
Ca2CeO4 : Eu
(1.0%)
167,338 26,10
Ca2CeO4 : Eu
(1.5%)
108,158,343 12,14,17
(C).XRD Study:
The crystal structure of the product was examined by XRD analysis. Fig. 4 shows the X-ray diffraction pattern of synthesized sample Ca2CeO4 : Eu3+. From the XRD peaks in the diffraction pattern seems the phosphor may be formed
50 100 150 200 250 300 350 400 450 500 0
5 10 15 20 25 30 35
TL of Ca2CeO4:Eu+3
e d
c
b a
In
te
n
s
ity
(a
.u
)
Temperature(0 c)
ISSN: 2319-8753
I
nternational
J
ournal of
I
nnovative
R
esearch in
S
cience,
E
ngineering and
T
echnology
(An ISO 3297: 2007 Certified Organization)
Vol. 2, Issue 9, September 2013
Copyright to IJIRSET www.ijirset.com 4514
single phase. The crystallite size of the particles of powder sample were calculated by Scherer’s formula i.e
D=0.9lambda/βcos(theta). The average crystallite size of Eu doped Ca2CeO4 phosphor is 63nm.Which conclude us
the solid state reaction method is good to prepare nano phosphors also.
Fig.4: XRD of Ca2CeO4 : Eu3+
(D).SEM Study:
Fig.5 shows the scanning electron micrograph of Ca2CeO4 : Eu3+. From the Scanning Electron Micrograph of Ca2CeO4
: Eu it is found the particles are distorted spheres in shape with various sizes from 50-300nm and also clusters are found. From the SEM micrograph the calculated average basal diameter of 77nm[8].
.
Fig.5:Scanning Electron Micrograph of Ca2CeO4 : Eu3+
(E).Particle size analysis:
The particle size distribution histograms of Ca2CeO4 : Eu3+(1.5%) particle is shown in fig.6. From particle size
histogram it is found that two maximum particle size of 4 microns and 12 microns are found. This allows us to draw a conclusion that two different sizes of phosphor may be existing and majority may be in a single phase. This variation of
S1B
Operations: Import File: S1B.RAW - Temp.: 25 °C (Room)
Lin (C
ou
nts)
0 1000 2000 3000 4000 5000 6000 7000 8000 9000 10000
2-Theta - Scale
ISSN: 2319-8753
I
nternational
J
ournal of
I
nnovative
R
esearch in
S
cience,
E
ngineering and
T
echnology
(An ISO 3297: 2007 Certified Organization)
Vol. 2, Issue 9, September 2013
Copyright to IJIRSET www.ijirset.com 4515
particle sizes may be due to agglomeration of nano particles to micrometer particles due to long storage of the phosphor before the Particle size analysis studies[8-11].
Fig.6: Particle size analysis of Ca2CeO4 : Eu3+
V.CONCLUSIONS
Eu doped with Ca2CeO4 nano phosphor was synthesized via solid state diffusion technique. From the XRD study it is
concluded the majority phase of the phosphor is in single phase. As the Eu concentration increases the dopant emission intensity increases. Which conclude us the solid state reaction method is good to prepare nano phosphors for display device applications due to the spherical shape of the phosphor particles.
REFERENCES
[1] Pallavi Page and K.V.R. Murthy, Luminescence associated with Eu3+ in two host lattices, Philosophical Magazine Letters, Vol. 90, No. 9,
September 2010, 653–662.
[2] W.M.Yen, S. Shionoya and H. Yamamoto, Phosphor Handbook, CRC Press, Boca Raton, FL (USA) 2007.
[3] Pallavi Page, Rahul Ghildiyal and K.V.R. Murthy, Synthesis, characterization and luminescence of Sr3Al2O6 phosphor with trivalent rare earth
dopants, Materials Research Bulletin, Volume 41, Issue 10, 12, October 2006, Pages 1854-1860.
[4] Rahul Ghildiyal, Pallavi Page and K.V.R. Murthy, Synthesis and characterization of Sr2CeO4 phosphor: Positive features of sol–gel technique
Journal of Luminescence, Volume 124, Issue 2, June 2007, Pages 217-220.
[5] K.V.R. Murthy, S.P. Pallavi, Rahul Ghildiyal, Manish C. Parmar, Y.S. Patel, V. Ravi Kumar, A.S. Sai Prasad, V. Natarajan, A.G. Page, Radiat. Prot. Dosim. 120 (1–4) (2006) 238.
[6] X.Z. Xiao, B. Yan, J. Phys. Chem. Solids 69 (2008) 1665.
Y. Zhai, X. Zhou, G. Yang, Y. Meng, S. Yao, Z. Guo, J. Rare Earths 24 (3) (2006).
[7] Photoluminescence and Thermoluminescence studies of Eu doped LAG phosphor, P.Sujitha, B.Subba Rao and K.V.R.Murthy International Journal of Engineering Research and Technology (IJERT) vol.2 Issue 8,Aug-2013,1931-1935,ISSN: 2278-01811..
[8]P.Sujitha, K.V.R.Murthy, B.Subba Rao, K.Suresh, C.A.Rao, Thermoluminescence study of LAG Phosphor doped with Ce4+,Eu3+, Solid State
Nuclear Track Detectors and their Apllications,231-233,2013, ISBN: 978-81-8487-259-0.
[9] P.Sujitha,B,Subba Rao, K.V.R.Murthy, Photoluminescence and Thermoluminescence studies of RE doped La2V2O8 Phosphor.,Applied Physics
and Material Science,2013,152-153,ISBN: 978-93-82570-10-3.
[10]. P.Sujitha, B.Subba Rao, and K.V.R.Murthy , Photoluminescence Studies of RE doped Y2O3 Phosphor, Proceedings of National conference on