Selected highlights of ECH/ECCD physics studies in the TCV tokamak
T.P. Goodman1, S. Coda1, B.P. Duval1, D. Kim1, O. Sauter1, F. Felici2, J. Decker3, and TCV team1
1Centre de Recherches en Physique des Plasmas, Ecole Polytechnique Federale de Lausanne (CRPP - EPFL), CH-1015
Lau-sanne, Switzerland (Team list in S.Coda, Nucl. Fusion53104011 (2013).)
2Eindhoven University of Technology, PO Box 513, 5600MB, Eindhoven, The Netherlands 3CEA, IRFM, F-13108, Saint-Paul-lez-Durance, France
Abstract. The Tokamak a Configuration Variable, TCV, has used Electron Cyclotron Heating and Current Drive as its only auxiliary heating system for nearly two decades. In addition to basic plasma heating and current profiling, ECH and ECCD under either feedforward or real-time (feedback) control allows control of plasma parameters and MHD behaviour to aid in physics studies and measurements. This paper describes four such studies in which EC control has proved crucial – increased resolution Thomson Scattering measurements in the plasma edge, time-resolved plasma rotation modification during the sawtooth cycle, robust neoclassical tearing mode (NTM) suppression, and double pass transmission measurements of EC waves for scattering and polarization studies. The relative merits of feedforward and feedback methods for recent TCV experiments are discussed.
1 Introduction
EC actuators have the invaluable ability to adapt to the ex-treme range of plasma shapes and position used within the TCV vacuum vessel, thanks to 7 independently controlled launching antennas and 9 millimeter wave sources (6 at 82.7GHz and 3 at 118GHz, each producing 0.5MW for 2s pulse duration). TCV’s modest magnetic field (<1.43T) results in a cut-offdensity for X2 heating of 4×10¹⁹m−3;
however, X3 top-launch absorption remains available and can be used effectively at nearly twice the density. X2 heating near the edge is still possible for some configu-rations at twice the central density and has been used to great effect, e.g. for ELM control. Recent experiments ranged from studies of novel snowflake divertor [1] shapes for mitigating wall loading in H-mode plasmas heated with X2 & X3, to developing the unique current profiles re-quired to produce 3D structures in the core of plasmas having an axisymmetric boundary[2], such as those pos-sible in the ITER hybrid scenarios, to investigations of electron cyclotron internal transport barriers[3], neoclas-sical tearing mode prevention[4], sawtooth control[5] and ELM control[6]. The flexibility of the launching antennas is matched by an identical receiving antenna fitted with a set of fast polarizers and used for oblique ECE, Doppler backscattering, correlation ECE (CECE) or double-pass transmission measurements [7]. The latter complements measurements from newly installed Hard X-Ray cameras (HXRS) [8] (able to be oriented to look either in or out of the poloidal plane) to study quasi-linear effects during ECH using the C3PO/LUKE suite of ray-tracing/ Fokker-Planck codes [9].
Building on previous open-loop control of NTMs and sawteeth using EC launchers, control of plasma instabil-ities now benefits from real-time knowledge of the equi-librium using the code RT-LIUQE [10]. TCV does not presently have the real-time ray or beam tracing used regularly on other tokamaks; for example, Asdex Up-grade [11]. Robust NTM control, in which a sinusoidal variation of the actuator deposition around the target q sur-face is added to the tracking, is shown to be more effective at stabilizing the NTM modes as the plasma evolves in time [12]. Again building on past experience with suc-cessful sawtooth control by either pacing or locking, mea-surements of the effect of the sawtooth cycle on the plasma rotation with high effective time resolution - as a function of the phase in the sawtooth cycle - have been made [13] using coherent averaging. The installation of diagnostics in ports directly adjacent to the EC inputs and the regular use of computer-controlled feedback, demands a reliable protection against stray EC power. Such a system is now in operation.
The TCV tokamak is essential in the implementation of the European fusion Roadmap [14] towards the realiza-tion of fusion energy by 2050 and is presently being up-graded to include a 1MW NBI source and a second open-ing in the vacuum vessel for a future source, together with two 1MW X3 gyrotrons. The option of designing the gy-rotrons as dual frequency tubes, providing either 126GHz or 84GHz (for X2 heating) is being explored. Following the recent (2013) end-of-life loss of several X2 gyrotrons, two 0.75MW replacements are planned at the present X2 frequency.
C
Owned by the authors, published by EDP Sciences, 2015
2 Use of Sawtooth Control
The sawtooth (ST) instability is seen on all tokamaks and it affects many aspects of plasma performance due to flatten-ing of the core profiles, expulsion of impurities, mixflatten-ing of the particles, release and redistribution of magnetic energy and, frequently, generation of NTMs. ECH and ECCD have been used for decades to change the rate at which this instability occurs (e.g. [15] and references therein). Exper-iments have advanced from merely studying the effect of EC on ST, to using the years of accumulated knowledge to apply control algorithms allowing tokamak operators to choose the period of the sawtooth crashes according to their experimental needs. By using ST control techniques we have lengthened the sawtooth period on TCV to permit time-resolved measurement of the change in toroidal rota-tion that occurs during the sawtooth cycle and, in partic-ular, to elucidate the abrupt change in the rotation profile that occurs at the sawtooth crash.
2.1 methods
The sawtooth period can be controlled through both po-sitioning of the deposition and changing the power ampli-tude. Paley and co-workers demonstrated feedback control of the sawtooth period by actuation of the launcher mirrors that direct the EC beam into the plasma [16]. The deposi-tion was made outside of the q=1 surface where the time evolution of the central temperature and soft x-ray emis-sion most closely resembles the triangular form of a saw blade tooth; making the real-time detection of the crash, and therefore the calculation of the period of the previ-ous sawtooth cycle, most reliable. When the deposition location is shifted slightly inwards (via actuation of the launching antenna mirror), the sawtooth period lengthens; when it moves slightly outwards, it decreases. (All move-ment was limited to ensure that deposition remained radi-ally outside of the peak (maximum) in the sawtooth period as a function of the deposition radius.) The sawtooth pe-riod was controlled to two different reference values (3ms and 8ms) with a time delay of about 0.3s due to the sweep rate of the launcher mirror of approximately 20◦/s. Mirror motion can be nearly five times faster, but would still re-sult in delays of 10’s of milliseconds between the request and the achievement of the desired period.
A much faster method to control the period is by de-positing the power at the position of maximum control (i.e. the position at which the sawtooth period can be length-ened the most) and then adjusting the beam intensity. This can be done at the rate determined by the power supplies of the gyrotron sources – typically on sub millisecond time scales. The change in the sawtooth period can then typ-ically occur on the energy confinement time scale since this dominates local changes in the current profile via the plasma temperature and resistivity. On TCV, energy con-finement times in L-mode EC heated plasmas are typically of a few milliseconds for the densities and currents used with X2.
Both pacing [17] and locking [18] of the sawtooth pe-riod have been demonstrated in TCV. Like deposition
lo-cation control, pacing uses real-time detection of the saw-tooth crash to determine the sawsaw-tooth period. When a crash is detected the power is turned on and kept on for a given duration, reducing the rate of evolution of the mag-netic shear. The power is then turned off, or decreased, to allow the sawtooth evolution to return to its natural rate; a sawtooth crash occurs shortly thereafter. When that crash is detected, the power is again turned on and the sequence is repeated. Using this technique, the period of individ-ual sawteeth can be readily controlled. The period can be adjusted at each crash if desired.
Locking does not require real-time detection of the crash and concomitant application of the power. A feed-forward EC pulse train is input to the plasma and, if the period and duty cycle of the pulses falls within a certain range, the sawtooth cycle "locks" to the pulse train [18]. By determining the range of period and duty cycle values to which the sawtooth cycle will lock, a sawtooth period controller can be constructed and used to adjust the saw-tooth period at each crash – just as in the case of pacing. Both methods have been used successfully to produce the same variation in sawtooth period as a function of time in TCV discharges.
Given the success of these methods, we have used them to lengthen the sawtooth period in TCV to permit measurements of the plasma rotation as a function of time during the sawtooth cycle (i.e. with time-resolution shorter than the sawtooth period).
2.2 CXRS diagnostic
A low-power (<100kW) diagnostic neutral beam (DNB) [19] is used in conjunction with a charge exchange recombination spectroscopic array [20] to measure the temperature, density and rotation of the carbon impurity ions in TCV. The equilibration time between impurities and the hydrogen ions of the plasma is short enough to allow us to consider a measurement of impurity properties as nearly equivalent to those of the bulk ions. Thus we will speak of plasma rotation, though carbon impurity rotation is actually measured. Because of the low DNB power, the charge exchange light intensity is low and requires subtraction of the background emission level before analysis to determine the rotation velocity via the Doppler shift of the C emission lines. This active-passive technique requires constant plasma conditions, relatively long integration times, and periods with and without the DNB injected to provide good velocity resolution. To measure the time evolution of the rotation during a discharge, we provide a feedforward train of square on-off pulses to the plasma at 50% duty cycle and compare (subtract) the adjacent on and offphases to get the signal to be analyzed [13].
2.3 rotation during the ST cycle
and showed an unequivocal dependence of the rotation ve-locity on the ion temperature outside the sawtooth inver-sion radius and on the plasma current – and suggested that there was a link between the rotation and the sawtooth in-stability – they were unable to temporally resolve the pro-files during the sawtooth cycle since the sawtooth periods were short. To overcome this, the present experiments use sawtooth control to lengthen the sawtooth period to 18ms and make it regular while simultaneously taking CXRS measurements with 2ms integration time. After coherent averaging, the signal to noise ratio of the measurements permit a clear evaluation of the evolution of the rotation profile during the “average” sawtooth cycle.
The plasma rotation velocity is centrally peaked in the counter-current direction just prior to the sawtooth crash. At the crash, the rotation slows in the core and speeds up in the regions near and outside the sawtooth inversion radius. That is, the sawtooth crash produces a strong kick in the co-current direction in the central region. As the sawtooth cycle advances, the rotation profile again relaxes to a pro-file peaked in the counter-current direction. During nearly 12 of the 18ms of the sawtooth cycle, the central region of the plasma has a "bulge" in the profile in the co-current direction. If it is valid to compare the short and long saw-teeth (remembering that the long sawsaw-teeth are produced by the addition of EC power that clearly modifies the plasma behaviour), then during 2/3 of the sawtooth cycle the rota-tion profile is non-monotonic. This would explain why the earlier non-time-resolved (i.e. averaged) profiles showed the same bulge in the co-current direction in the plasma center.
It was found that using locking, rather than pacing, re-sulted in better statistics. During pacing the unavoidable small fluctuations (jitter) in the length of the sawtooth pe-riod that occur results in a cumulative phase error between the sawtooth crash and the DNB pulses since they (unlike the EC power and CXRS) are not triggered in real time and are therefore not synchronized with the sawteeth. As the timing of the EC power during locking is determined in feedforward, like the DNB pulses, the jitter results in a random error in the precision of the timing binning for the coherent averaging, but does not cause a systematic drift of the phase at each sawtooth crash [13].
3 Robust NTM control
NTM control experiments in which ECH/ECCD from one or several launchers is used to preempt or suppress a mode at the mode rational surface (q=m/n=3/2 or 2/1) have been carried out in the past [22], mostly in feedforward (of the launcher angles). The location of the appropriate q sur-face aiming was determined by stopping the motion when the targeted (n=1) mode disappeared, then reproducing the same mode and subsequent stabilization while moving to-wards the q surface from the opposite side in a second discharge [23]. The two stabilizing locations closely co-incided providing confidence that theq=2/1 surface was found (this was further corroborated by off-line LIUQE equilibrium reconstruction). New experiments have been
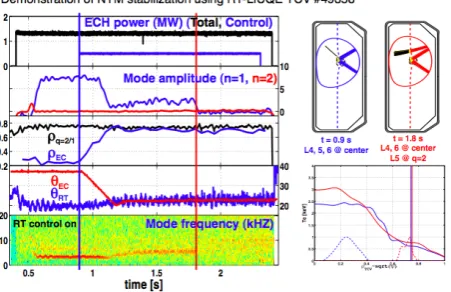
performed using feedback control of the launcher aiming together with real-time LIUQE (RT-LIUQE). An example of successful stabilization using RT-LIUQE is shown in Fig. 1.
3.1 RT-LIUQE aiming
A fast (<1ms cycle time) version of the Grad-Shafranov solver, called RT-LIUQE [10], has been implemented in the TCV plasma control system (PCS). It provides theq profile as a function of normalised minor radius,ρ, on 17 points. TCV uses a Simulink/MATLAB interface to pro-gram real-time controllers of the EC (and other) actuators. For NTM control, a targetqsurface is chosen. The cor-respondingρtargetlocation is found by interpolation of the
RT-LIUQE q. TCV does not have real-time ray-tracing at present. To determine the launcher angles required to deposit the power at the requiredρtarget, we perform
feed-forward ray-tracing on a previous plasma discharge. That is, we calculate theρdepfor all launcher angles in a plasma
with the same current as we plan to use for the NTM ex-periments, with a given temperature and density profile. This data provides a set of points (ρdep, θL) that are fit
θL = f(ρdep) with a low order polynomial (typically
cu-bic). Theθtarget = f(ρtarget) is determined and fed to the
launchers, whose local feedback controllers move the mir-rors to those angles.
3.2 NTM experiments
Initial experiments showed that usingqtarget=m/n, where
m & n are integers, did not result in stabilization of the NTM; an offset in the qtarget is required: qtarget =
m/n+qo f f set. (Note that in Fig.1 the mode actually
stabi-lizes whenρECis slightly inside theρ2/1that is calculated
by off-line LIUQE.) The offset was due to a slight differ-ence between the off-line and on-line LIUQE q-profiles during commissioning of the RT-LIUQE. The offset is ap-proximately constant over a large portion of the plasma cross-section.
Theqo f f setwas determined experimentally, but the
re-sultingθtargetfor successful NTM stabilization was
equiv-alent to that found in the feedforward experiments. The qo f f setis small and is found to be a function of plasma
cur-rentIp(as are the polynomial coefficients ofθL= f(ρdep)).
In practice, a real-time measure ofIpwas included in
the control algorithm and bi-linear interpolation atρtargetin
a 2D lookup table in (Ip,ρdep) was used to find theθtarget.
Seventeen evenly spaced radial values (0.2 ≤ ρdep ≤ 1)
were generated from the polynomial fits at each of 4 cur-rent values between 120kA ≤Ip ≤240kA for use in the
lookup table.
Finding the appropriateqo f f set is time consuming, so
an alternative method was developed to provide robust NTM control.
3.3 Target sweeping
Figure 1. NTM stabilization using RT-LIUQE. The left panel shows the EC power, mode amplitudes,ρvalues of the EC depo-sition and mode surface, the requested real-time (θRT) and actual
(θEC) mirror angles and a spectrogram of the mode. The
verti-cal lines (color online) correspond to the beam aiming (top right) and deposition profiles (bottom right) superimposed on the TCV poloidal cross-section and the electron density (ne) and
tempera-ture (Te) profiles, respectively. (From [12]).
gather data concerning this dependence would be to sweep a beam of a given (low) power across the mode resonant surface and then repeat the sweep at increased power un-til the mode is stabilized. The mode amplitude during the sweep – provided the sweeping rate is slow enough – would then provide some measure of the effectiveness of stabilization for each given power. With this in mind, a two parameter (amplitude and frequency) sinusoidal variation was added to the normalisedρtargetdetermined above. This
has the added benefit that if theρtargetvalue is not precisely
known, but is close to being correct, the beam will even-tually be optimally placed at some time during the sweep. In this sense, the method is robust against small errors in aiming; hence the name robust control1.
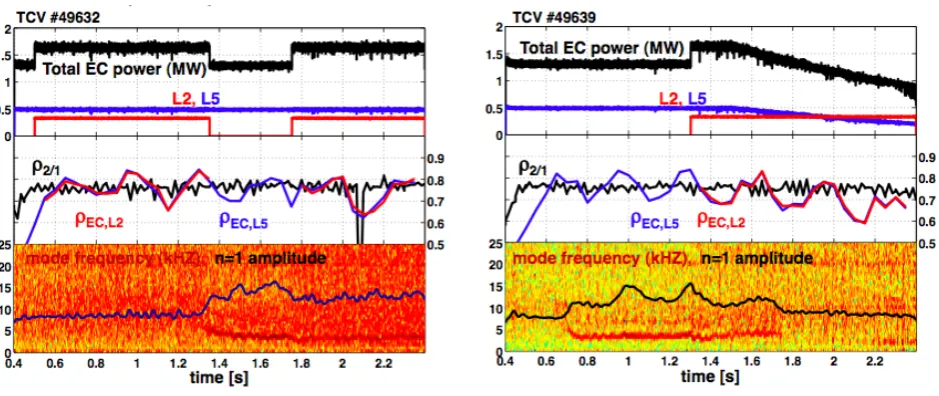
One fear is that this method might destabilize the NTMs when aiming outside the optimum mode stabiliza-tion locastabiliza-tion [24]. In TCV we have not seen evidence of a strong detrimental effect on the modes. This may be be-cause we do not have a long dwell time in the non-optimal region; we do observe some increase in the mode ampli-tude when offresonance in some experiments. For exam-ple, figure 2, neart=1.0s & t=1.3sshows an increase in the mode amplitude synchronized with the deposition to the outside of the resonantq. This figure exemplifies stud-ies that have started on a comparison of robust NTM pre-emption and robust suppression (see caption for details).
4 Non-stiff L-mode edge profiles
ECRH is combined with plasma motion past a fixed set of Thomson Scattering (TS) volumes to improve the
reso-1We note here that the oscillation could be imposed on theq
target
since it is the absolute value of this profile that is least precisely known; however, the plasma response is theoretically related to the width of the beam, which is better defined inρ. Hence, the oscillation is added to ρtarget
lution of electron density and temperature measurements. In contrast with the experiments described in sections 2.3, 3.2 and 3.3, here we require simple bulk heating. Never-theless, the beams are feedforward controlled to provide precise central heating throughout the plasma vertical mo-tion (0.08m linear displacement over 1.2s). With this tech-nique, TS measurements ofneandTeare resolved over the
volume averagedδρvol ∼0.015 after mapping and binning
the data on the equilibrium. These high-resolution mea-surements reveal [25] that although the plasma region be-tween the inversion radius and approximately 0.8ρvol
0.9 is stiff [26], the edge is not. Due to the stiff nature of the profiles (all having essentially the same exponential growth factor for all power levels, Ptot, and plasma
cur-rents,Ip, investigated) and the non-stiffnature of the edge,
the energy confinement time scaling can be deduced from the pressure value at the location where the plasma pro-files change from one type of behaviour to the other (i.e. the edge pedestal atρvol∼0.8). This feature points to the
importance of understanding transport in the plasma edge since it is a key player in understanding the global confine-ment, even in L-mode.
5 EC power transmission measurements
Most fusion plasmas are optically opaque at millimeter frequencies used to heat them, transmitting little power (<-20dB) past the resonance. However, to attain this high opacity the polarization of the EC beams must be prop-erly set; any power in the wrong mode will be more highly transmitted. (Note that even with an optical thick-ness of 10, a typical megawatt level beam will trans-mit 35mW/mm2– easily detectable by standard detectors.)
This section describes measurements of transmitted power from TCV gyrotron sources.
5.1 O2 transmission
X2 input polarizations are set by a pair of grating mirrors whose positions are set to ∼ 1◦ accuracy. Similarly, the required polarization for the X2 mode is determined from a knowledge of the frequency, the location of the beam intersection with the plasma, the magnetic field strength and field line direction and the wave-vector; each with their own level of uncertainty. These uncertainties com-bined provide typically better than 99% X-mode purity. The remaining power couples to the O-mode. Since the required polarisation is a function of the launching angles (k-vector), but the polarisers are fixed during a discharge on TCV, any sweep of the beam results in some coupling to the wrong (i.e. O-) mode. This limitation could be over-come by using so-called fast polarisers, installed in mitre bends of the evacuated transmission lines, to allow the op-timum polarisation to be set as a function of time, as will be done in ITER.
Figure 2.Left: Demonstration of robust preemption with 0.8MW until 1.3s, then unsuccessful preemption at 0.5MW until 1.75s fol-lowed by unsuccessful robust stabilization at 0.8MW once the mode is present. When the L2 power is switched on, the mode amplitude (blue curve in bottom panel) decreases but does not drop back to the noise level seen between 0.4s and 1.3s. Right: Demonstration that the sweeps of robust control modulate the amplitude of an existing mode if the power is insufficient for stabilization. The power ramp-down from 1.5s decreases the ratio of the central drive to the off-axis stabilization power; when the mode disappears at 1.75s, the ratio has dropped by approximately 10% showing that we are marginally too low in off-axis power, at the start, for complete suppression.
could be provided. The transmitted O2 power might act as such a signal; however the determination of the received polarization is required to be able to discriminate against scattered and transmitted X2 power. Therefore, as a first step, the fast polarisers have been installed in the front-end of a receiver antenna (identical in design to the X2 launch-ers) [7].
For this double pass transmission measurement, power is launched at the plasma low-field side (LFS) midplane and reflects offof the Carbon tiles of the central column (high-field side - HFS). A mixture of 2 input modes re-sults in 4 possible outgoing beams due to the splitting of each mode into O and X upon reflection. Fortunately, re-fraction separates the beamsspatially, both toroidally and poloidally, in the chosen target plasma so that the power incident on the receiver by direct double pass is essentially only O2 coupled to O2. All other mode coupling combi-nations fall outside of the receiver antenna pattern. Nev-ertheless, it may be assumed that some power in X-mode scatters into the receiver. One goal of initial experiments is to determine the amount of indirect scattered power in X2 that arrives at the receiver.
5.1.1 Transmission experiments
A series of∼ 60 short, 1ms, low power, 190kW, pulses was injected and received in each of 8 identical plasma discharges. During each discharge the fast polarizers of the receiver were swept, changing the coupling of O-mode to the detector (CO
f p) but not the transmission through the
plasma. The input polarization was changed from dis-charge to disdis-charge in order to alter the fraction of the 190kW input power coupled to the O-mode (FO) and
search for the optimum input polarisation, indicated by a minimum in the transmitted power.
Figure 3 shows the measured and modelled coupling to the receiver for the eight shots in the series. The mea-surement points are the ratio of received to input power (R = Preceived/Pinput). The time variation of the received
signal is found to match the calculated time variation of CO
f p with reasonable agreement, giving confidence in the
modelling of the fast polariser mirrors (and confirming that O-mode dominated the received signal). Previous mod-elling [7] did not explicitly account for any X-mode cou-pling to the receiver since it was observed that the resid-ual power coupled when the fast polarisers were set for near pure X-mode polarisation (i.e. no O-mode coupling) was small. Here we find that including the variation of the coupling of X-mode to the receiver as a function of the po-lariser angles improves the matching between the shape of the measured and modelled signals.
A two parameter least-squares fit of the modelled transmission (O-mode plus X-mode) toRis made. We as-sume that the stray X-radiation is proportional to the prod-uct of the input X-mode fraction (FX = 1−FO) and the
coupling of X-mode through the fast polarisers to the lin-early polarized receiver (CX
f p). The constant of
proportion-ality is one of the fit parameters, the other is the constant of proportionality associated with the O-mode double-pass transmission:R=K1f itCOf pFO+K2f itCXf p(1−FO). We
fur-ther assume that X-mode power is due to scattering since ray-tracing shows strong spatial separation of the double-pass beams.
polariza-tion minimizapolariza-tion. The fast polarizer sweeps were chosen for their technical simplicity and did not necessarily pass through the perfect O-mode settings. Therefore, given the good agreement seen in fits of Fig. 3, we correct the re-ceived signal using the fast polarizer model. Because of the large errors incurred when dividing small signals, we chose to normalize the maximum received signal ratio dur-ing a discharge by the maximum coupldur-ing calculated by the model for that discharge. This gives the corrected max-imum measured signal; i.e. an estimate of the maxmax-imum signal that would have been measured had the fast polar-izers been set for pure O-mode reception.
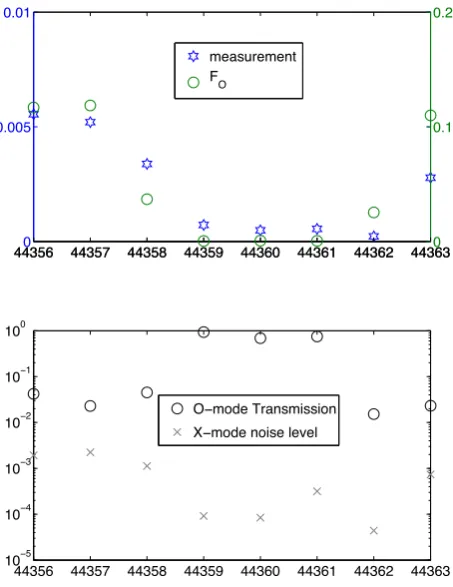
The minimum in the O-mode input power is fairly well matched by the minimum in received power as can be seen in figure 4, comparingFOand the corrected maximum of
R for each shot. The level of transmission (TO = K1f it)
is shown in Fig. 4 as is the level of stray power (K2f it). Since the total input power is constant from shot to shot and the plasma parameters are the same, it is expected that the absorption (and thus transmission) will also be con-stant. This is clearly not the case.
TORAY and C3PO/LUKE calculations predict the O-mode transmission to be∼ −1.2dB i.e. ∼ 76% in these discharged. The 3 discharges with very low input O-mode fraction have 79±13% transmission. We note that the peak absorbed power density is linear with the O-mode fraction; no quasi linear effects are seen in LUKE.
5.2 X3 transmission
The absolutely calibrated X2 transmission measurements are a test case for future X3 transmission measurements. X3 is rarely fully absorbed and is often strongly refracted due to the grazing incidence on the resonance, unlike O2 which follows essentially a straight path through the plasma (allowing a direct comparison with paraxial beam propagation in vacuum). The X3 polarizers are not mo-torized and are optimized for X-mode based on a “aver-age” or typical target plasma; the polarization leaving the launcher is the same for each discharge. We will be in-stalling an X3 transmission diagnostic in the bottom of the machine directly below the X3 launcher during the present opening. The central beam (of 3) can be directed towards the receiver to allow independent confirmation of beam aiming and ray-tracing as well as a measurement of the beam transmission (absorption); having confirmed these beam characteristics the ultimate goal is to quantify any spreading of the beam due to scattering correlated with edge turbulence and blobs, themselves to be measured by Langmuir probes, fast cameras and a fast reciprocating probe. Since the distance from the launcher to the re-ceiver is nearly 1.5m, this can act as a test case for the predicted deflection of the beams in ITER, which travel a similar distance to the resonance. The concern is that beam spreading will reduce the driven current density and limit the effectiveness of NTM stabilisation (e.g. [29] and references therein). TCV does not have current density measurement and the resolution of current density mea-surements on other machines (e.g. DIII-D [30]) typically
ï
ï
ï
ï
ï
ï
Figure 3. The modelled coupling to the receiver (solid red curves) for a constant level of O-mode and X-mode power en-tering the fast polarisers in each discharge, fit to the the level of the received power ratio averaged over each pulse (pts with stan-dard deviation error bars). The O- (and X=1-O) mode level is changed from discharge to discharge using the polarisers in the MOU of gyrotron 4. The fit parameters are shown in Fig.4.
spans the entire width of the driven current channel and are indirect. The proposed transmission measurement has the advantage that it directly measures the mm-wave beam itself.
6 TCV Upgrades
In addition to the continual amelioration of TCV diagnos-tics, the auxiliary heating systems are undergoing a ma-jor upgrade. Two new ports have been made in the TCV vacuum vessel at the mid plane. A 1MW neutral beam in-jector (NBI) has been purchased and will be installed in mid 2015, while the second port allows for a future up-grade. With this injector it will be possible to reduce the electron to ion temperature ratio in TCV plasmas by an order of magnitude to near Te/Ti ≈ 1. Preheated
ï ï ï ï ï
ï
ï
Figure 4. Top: The corrected maximum of the measured re-ceived power ratio (stars) and the O-mode fraction (o) of the in-put power from gyrotron 4. Bottom: The fit value of the trans-mission coming from the O-mode fraction (o) and X-mode (x) "noise" (see text). The abscissas are the TCV shot numbers.
The EC system is also being upgraded over the next 4 years. During the 2013 campaign, 3 X2 gyrotrons reached their end of life and will be replaced by 2 new 0.75MW depressed collector gyrotrons operating in the same mag-nets and at the same frequency; these are planned to be installed in summer of 2015 and early spring of 2016. A reduction in heating power would be problematic in itself, but more importantly, the new gyrotrons cannot be oper-ated on the same HV power supplies as the older X2 tubes. Newer gyrotrons monopolise one of the two available X2 power supplies; so, if only one upgraded gyrotron were purchased the launching flexibility would be severely cur-tailed. With two newer higher power gyrotrons the flex-ibility of aiming will be reestablished and the X2 power maintained at the same time.
In addition to the X2 gyrotrons, two new 1MW gy-rotrons are being designed based on the successful Euro-pean development of the 140GHz gyrotron for Wendel-stein 7X [27]. These gyrotrons are planned to be installed in the location of the present X3 gyrotrons with the power launched from a redesigned top launcher mirror optimised for the new frequency of 126GHz, if required. The pos-sibility of operating the tubes at somewhat reduced power at 84GHz is being actively pursued. The older 0.5MW 118GHz tubes will be repositioned to allow them to share the high voltage power supply and transmission lines of
one X2 cluster of 3 gyrotrons. The transmission lines and X2 launchers can be (and have been [28]) used at the X3 frequency of 118GHz for lateral launch. Due to their dif-fering characteristics the X2 and X3 gyrotrons cannot be operated simultaneously on the same power supply, so ex-perimentalist will have to choose the frequency to use in this cluster for each experiment.
These additions will require significant alterations to the vacuum layout of the present installation; these are be-ing actively carried out durbe-ing the present shutdown durbe-ing which the TCV vacuum vessel is being modified.
7 Conclusions
EC auxiliary heating has been used on TCV to aid in the study of time-resolved plasma rotation measurements, high spatial resolution edge pressure scaling measure-ments, the effectiveness of NTM stabilisation methods and polarisation optimisation via transmission measurements.
We showed that lengthening the sawtooth period while synchronising the crashes to a feedforward EC pulse train via the locking phenomenon provided optimal statistics for coherent averaging of short integration time CXRS mea-surements of the toroidal rotation. These rely on a pas-sive - active technique with DNBI pulses. Nine time slices within a sawtooth cycle were made in this way, show-ing clearly that the rotation increases suddenly in the co-current direction in the plasma center at the time of the crash; then, it relaxes to a peaked counter current pro-file during the sawtooth period. By contrast, the region from near the sawtooth mixing radius towards the edge in-creases in the counter current direction at the crash, then slows during the sawtooth period.
Edge profile measurements via Thomson Scattering are well resolved (δρ ∼ 0.015) by combining the 60Hz TS rate with a slow vertical sweep of the plasma through the measurement volumes while simultaneously keeping the heating on axis by appropriate launcher angle sweeps. These measurements show that the edge profiles in EC heated L-mode plasmas, as well as Ohmic plasmas of var-ious currents, are non-stiff; whereas the region inside of ρ ∼ 0.8 (the pedestal) but outside the inversion radius is stiff. The confinement time improvement seen with in-creasingIp is found to scale directly with the increase of
the pedestal pressure.
The success of NTM stabilisation is improved by adding a small oscillation to the EC deposition target com-ing from the RT-LIUQE equilibriumqprofile mapped on ρ. That mapping is used to determine the launcher angles from a polynomial fit of the deposition location as a func-tion of angle, obtained from pre-calculated ray-tracing of the beams in an equivalent target plasma. Robust NTM control reduces the need to precisely determine an offset in theqtargetvalue, otherwise required to match the mode
In preparation for future X3 transmission measure-ments to study potential beam spreading due to scattering by blobs and edge turbulence, an X2 launcher installed as a receiver has been used to qualify the double-pass transmis-sion of O2 power. The measurements confirm the spatial separation, predicted by ray-tracing, of the various modes of propagation at the outer plasma edge near the receiver; resulting in essentially O-mode reception for appropriate launcher angles. The minimum in O2→O2 transmission as a function of polarisation of the input power is also con-firmed, though the absolute transmission level is signifi-cantly lower than expected by ray-tracing calculations for several discharges.
Further experiments are needed to determine the rea-son for the difference between measurements and model-ing; for example, by measuring the sensitivity of trans-mission to the plasma – launcher geometry using vertical sweeps of the plasma axis. Nevertheless, the fact that the discharges with large O-mode fraction have much lower transmission is an indication that the received power does not increase as rapidly as the input O-mode power. Since the ultimate goal of these experiments is to use a transmis-sion signal to optimize the input polarization in real-time (e.g. by using fast polarizers in the input line and slow po-larizers on the receiver side), this limits the depth of the cost-function minimum (i.e. the sensitivity of the diagnos-tic to the optimization parameters), but does not preclude use of the signals.
The replacement of one cluster of X2 gyrotrons, ad-dition of 2 1MW X3 (potentially dual frequency for X2) gytrotrons, installation of 1MW NBI and re-configuration of the 3 present X3 gyrotrons for side launch over the next 4 years, promises to support and expand TCV’s role in the European, and world, quest for Fusion power.
Acknowledgements
This work was supported in part by the Swiss National Science Foundation.
References
[1] H. Reimerdes et al., Plasma Phys. Control. Fus. 55 124027 (2013)
[2] W. A. Cooper,et al., Nucl. Fusion53073021 (2013) [3] T. P. Goodmanet al., Plasma Phys. Control. Fus.47
B107 (2005)
[4] O. Sauteret al., Plasma Phys. Control. Fus.52025002 (2010)
[5] F. Feliciet al., Nucl. Fusion52074001 (2012) [6] F. Feliciet al., Nucl. Fusion53113018 (2013) [7] T.P. Goodman, et al., Proceedings of the
24th IAEA Fusion Energy Conference (San Diego, USA 8-13 October 2012); http:// www-naweb.iaea.org/napc/physics/FEC/FEC2012/
papers/119_EXP608.pdf
[8] J. Kamleitner,et al.,Proceedings of the40thEuropean Physical Society Conference on Plasma Physics and
Controlled Fusion (Espoo, Finland, 1-5 July, 2013) P5.127;http://ocs.ciemat.es/EPS2013PAP/pdf/P5.127.pdf [9] J. Decker,et al., these proceedings (2014)
[10] J-M. Moret, B.P. Duval, H.B. Le, S. Coda, H. Reimerdes, "Tokamak equilibrium reconstruction code LIUQE and its real time implementation" sub-mitted to Fusion Engineering and Design (2014) [11] J. Stober,et al., these proceedings (2014)
[12] Doohyun Kim, et al., Bulletin of the American Physical Society 55th Annual Meeting of the APS
Division of Plasma PhysicsVol.58No. 16, November 11 – 15, 2013, Denver, CO, USA (2013) PP8.00073; http://flux.aps.org/meetings/YR13/DPP13/all_DPP13.pdf [13] B.P. Duval, et al., 21st European Fusion Physics
Workshop 2013, 9-11 December, 2013, Ringsted, Denmark
[14]
http://www.efda.org/wpcms/wp-content/uploads/2013/01/JG12.356-web.pdf
[15] C. Angioni,et al., Nucl. Fusion43, 455 - 468 (2003) [16] J. I. Paley, et al., Plasma Phys. Control. Fus. 51,
055010 (2009)
[17] T.P. Goodman, et al., Phys. Rev. Lett.106, 245002 (2011)
[18] M. Lauret,et al., Nucl. Fusion52, 062002 (2012); G. Witvoet,et al., Nucl. Fusion51, 073024 (2011) [19] A.N. Karpushov, et al.,Proc.25th Symp. on Fusion
Technology (Rostock, Germany, 15 – 19 September 2008); Fusion Eng. Des.84, 993-7 (2009)
[20] A.N. Karpushov, et al., Proc. 39th European Physical Society Conf. on Plasma Physics (Stockholm, Sweden, 2 –6 July 2012) P2.037; http://ocs.ciemat.es/epsicpp2012pap/html/index.html [21] B.P. Duval, et al., in Proceedings of the 23rd
IAEA Fusion Energy Conference (Daejeon, South Korea, 11-16 October 2010); http://www-naweb.iaea.org/napc/physics/FEC/FEC2010/papers/exs _p4-01.pdf
[22] Federico Felici (2011), “Real-Time Control of Tokamak Plasmas: from Control of Physics to Physics-Based Control”. PhD thesis. Lausanne: Ecole Polytechnique Federale de Lausanne EPFL http://library.epfl.ch/en/theses/?nr=5203
[23] F. Felici, et al., 17th Joint Workshop on ECE and
ECRH, EPJ Web of Conferences (EC-17)32, 02005 (2012)
[24] E. Poli,et al., these proceedings (2014)
[25] O. Sauter, et al., Physics of Plasmas 21, 055906 (2014)
[26] F. Ryter,et al., Plasma Phys. Control. Fus.43, A323 (2001)