148
Classification of Rice Pest Data Using Decision Tree
Algorithm
Jinubala, V
1., Lawrance, R.
2And Jeyakumar, P.
31Research Scholar, Department of Computer Science, Karpagam Academy of Higher Education, Coimbatore, India.
2Director, Department of Computer Applications, Ayya Nadar Janaki Ammal College, Sivakasi, India,
3
ICAR-Indian Institute of Rice Research, Hyderabad, India,
Abstract:Data mining can be defined as the process of selecting, exploring and modeling large amounts of data to uncover previously unknown patterns. Data Mining is an emerging research field in the analysis of agricultural data. Classifications of data have been successfully applied in various applications. Classification of large volume of data especially in agriculture is a challenging task. One of the major challenges in agriculture data analysis is the prediction of prognosis, especially in pest data to determine the control measures. Decision tree method is generally used for the classification, because it is the simple hierarchical structure for the user understanding and decision making. In the present study, the various classification techniques have been applied with Leaf Folder pest data set of rice crop, for classifying them into four categories based on pest intensity range during the entire cropping season, using R statistical language.
In this paper the decision tree classification techniques as well as main issues in classifying and predicting methods for agriculture data have been reviewed. In addition to the above the performances of the various classification techniques have also been presented.
Keywords - C4.5 Classification, Data mining, Decision Tree Classification, Rice Pest data. 1.INTRODUCTION
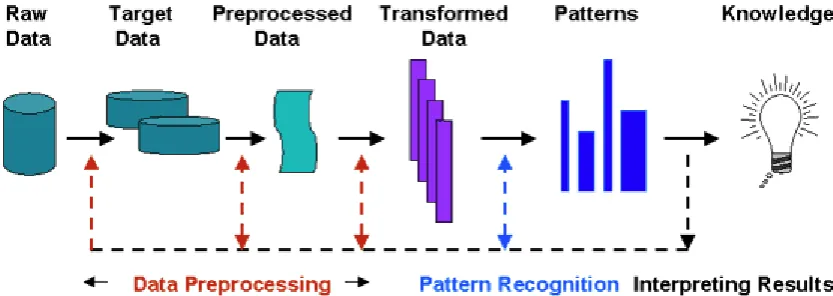
Data Mining is the process of discovering the interesting patterns or information from the data in large databases. The data sources can include databases, data warehouses, the Web, other information repositories, or data that are
[image:1.595.89.506.429.577.2]streamed into the system dynamically. Han and Kamber (2005) had defined the data mining as knowledge discovery in databases, knowledge extraction, pattern analysis, data archeology, business intelligence as shown in figure 1.
Figure 1: The Process of Knowledge Discovery in Database Alagukumar and Lawrance (2015a & b), stated that
data mining techniques have become a popular tool for analyzing large amount of data. Srinivasan and Aggarwal (2003) had discussed that, data mining techniques have become a popular research tool for agriculture data to identify and exploit patterns and relationships among large number of variables, and to predict the outcome of a pest using the historical datasets.
Priyam et al., (2013) applied ID3, C4.5, and CART algorithms on the educational data for predicting the student’s performance in examination. The algorithms are applied on student’s internal assessment data to predict their performance in the final exam. They mentioned that C4.5 is the best algorithm for small
datasets because it provides better accuracy and efficiency than other algorithms.
Hssina et al., (2014) have focused on the key elements of their construction from a set of data and then they presented the algorithm ID3 and C4.5 that respond to classification. Finally they compared ID3 and C4.5, which confirmed that the most powerful and preferred method in machine learning is certainly C4.5.
149 2009-2013 was used and various classifying techniques /
algorithms were tested to find out the suitable and effective technique for classifying the pest data based on pest intensity range during the entire cropping season in to four categories.
2.MATERIALS AND METHODS
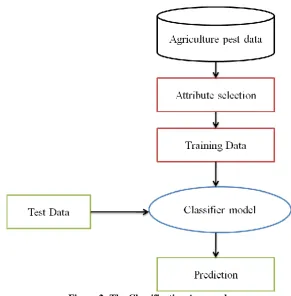
[image:2.595.157.449.148.445.2]Classification technique plays a vital role in agricultural data experiments, for purposes of classifying pest samples and prediction using agricultural pest data. The Classification System of decision tree (C4.5) on agriculture data is shown in figure 2.
Figure 2: The Classification Approach
A. Data formats
In the present study the Leaf Folder pest data set of rice crop recorded at farmers’ fields from various villages of Maharashtra under Crop Pest Surveillance and Advisory Project (CROPSAP) has been used. The
dataset can be in the form of a M x N matrix D, where the row X={ x1,x2,x3… xm} represents the fields / villages and column P={p1,p2,p3…, pn} represents pests as shown in Table 1.
Table 1: Agriculture pest Data Samples
Attributes
Category by pest intensity
P1 P2 … Pn
x1 p(1,1) p(1,2) … p(1,n) White
x2 p(2,1) p(2,2) … p(2,n) Green
x3 p(3,1) p(3,2) … p(3,n) Yellow
… … … Red
… … … Green
xm p(m,1) p(m,2) … p(m,n) Yellow
Category column represents the actual class of the pest sample based on pest intensity. For the current study
Leaf Folder pest data set of rice crop of Vidarba district
of the State of Maharashtra is used, where they are classified based on pest intensity expressed as number of folded leaves per hill. Based on pest intensity, data is classified as white (pest intensity < 25%), green (pest intensity between 25% and 50%), yellow (pest intensity between 50% and 75%) and red (pest intensity >= 75%).
B. Classification Techniques
Classification is a task performed to generalize known structure in data mining to apply to new data. It is also the categorization of data for its most effective and efficient use. There are numerous data mining classification algorithms being studied and implemented in different domains.
[image:2.595.145.459.536.655.2]150 the object. The input dataset termed as the training data
set, which contains the number of predefined labels each having a number of attributes. The attributes are either continuous or categorical. The main aim is to use the training data set to build a model, which can be used to classify unknown label data set.
C. Decision Tree
Han and Kamber (2005) have also stated that Decision Tree is a supervised classification, which predicts both the classifier and regression models. Classification trees are mainly used to classify an object to a predetermined class based on the attributes. Safavian and Landgrebe (1991), surveyed classification techniques and explained the classification trees. A Tree is a set of nodes, a node with no incoming edge and zero or more outgoing edge is called as Root, a node with exactly one incoming edge and one or more outgoing edge is called as Internal node and all other nodes are known as Leaf node which has exactly one incoming edge and no outgoing edge. Using the Training set the classifier model has been developed; testing set was applied on the classification model to predict the previously unknown class.
Raorane, A, A. et. al. (2012) has discussed that Decision tree is one of the classification algorithms which can be used in Data mining. Learning decision tree is paradigm of inductive learning. A model is built from data or observations according to some criteria. The model aims to learn a general rule from the observed instances. Decision trees can therefore accomplish two different tasks depending on whether the target attribute is discrete or continuous.
C4.5 is one of the Decision tree Classification Algorithms developed by Quinlan(1996 & 2014). It uses Gain ratio as a Splitting Criteria by calculating entropy and splitting information of an attribute. It can handle numeric attributes and missing values. The C4.5 decision tree classification is faster than ID3 algorithm and also ID3 cannot deal with missing values. Decision tree is constructed by examining a set of training samples whose class labels are known. These features of known samples are applied in order to determine the properties of unknown samples. The C4.5 Classification Algorithm provides accurate result, takes less memory space for large data set, less time to build a model and has short searching time.
D. Algorithm : Decision Tree Classification
Let the class label be represented as . There are number of possibilities for the content of the set of training samples in the given node of decision tree. If is any set of samples, let
stand for the number of samples in that belong to class (out of k possible classes), and
denotes the number of samples in the set . Then the entropy of the set :
After set has been partitioned in accordance with outcomes of one attribute test :
Criterion: then select an attribute with the highest gain value
Input:
D, Training dataset with class labels Output:
Generates Decision tree Classification model for predicting results.
Classification Model Construction Procedure:
Begin
Step1. Read the training dataset from agricultural pest data
Step2. Compute entropy value for all attributes Step3. Select best attribute having highest gain ratio according to the entropy value
Step4. Create a decision node based on the best attribute in step 3
Step5. Split the dataset based on newly created decision node in step 4
Step6. For all sub-dataset in step 5, call the algorithm recursively to get a sub-tree
Step7. Attach the tree obtained in step 6 to the decision node in step 4
Step8. Return tree
Step9. Decision tree Classification model for predicting result is the output
End
3.RESULTS & DISCUSSION
151 Table 2: Sample Data
Taluka Leaf Folder Pest count Range
T1 0.2811 Yellow
T2 0.2656 Green
T3 0.0240 White
T4 0.2000 Green
T5 0.5515 Red
T6 0.2516 Green
T7 0.3008 Yellow
[image:4.595.94.502.76.483.2]… … …
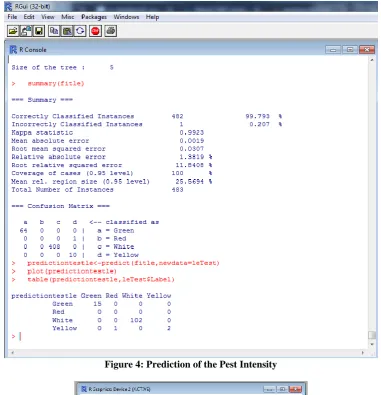
Figure 3: Working of Decision Tree Confusion matrix is a visualization tool which is
commonly used to present the accuracy of the prediction. The confusion matrix is represented in table 3.
Table 3: Confusion Matrix
Actual Class
Predicted Class
TP FN
FP TN
The confusion matrix is used to show the relationship between outcomes and predicted classes. The effective classification model is calculated with number of correct and incorrect classifications for each possible value of the variable being classified in the confusion matrix. The accuracy of a classifier for a given test set is the percentage of test set tuples that are correctly classified by the classifier.
In this study the various classification techniques have been applied and experimented with the Leaf
Folder pest data set of rice crop. The Classification
System of decision tree (C4.5) on agriculture data is shown in figure 2. Normally the classification techniques are divided into two parts such as training phase and test phase. This represents the classification and prediction step of the present system. Initially the
152 Figure 4: Prediction of the Pest Intensity
Figure 5: Graphical presentation of the Prediction The figure 5 represents the visualization of the
classification based on pest intensity. Here the Leaf
Folder pest data set of rice crop is classified, such as
white, green, yellow and red based on the pest intensity range values as explained in the previous section.
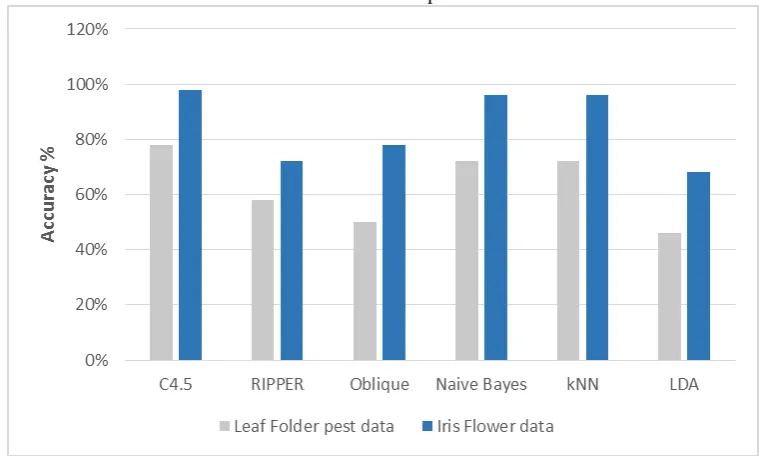
153 followed by Naïve Bayes and kNN algorithms both with
[image:6.595.147.453.103.203.2]72 % accuracy.
Table 4: Comparative Analysis
Method Accuracy on Agriculture data
C4.5 (Decision Tree) 78 %
RIPPER (Decision Tree) 60 %
Oblique (Decision Tree) 50 %
Naïve Bayes 72 %
kNN 72 %
LDA 46 %
The various classification algorithms are tested with Iris Flower bench mark dataset and tested how it was performing with Decision tree classification algorithms. Finally, the classification algorithms are tested with rice crop pest dataset and calculated classification
performance using accuracy measures. The figure 6 represents the comparative analysis of the decision tree classification performance with traditional classification algorithm for Leaf Folder pest data set of rice crop in comparison with Iris Flower bench mark dataset.
Figure 6: Comparative Analysis Thus from the accuracy measures for the
classification algorithms for the Iris Flower dataset and rice crop pest dataset, it can be observed that C4.5, Naïve Bayes and kNN classifiers are more accurate than the other classifiers. Priyam et al. (2013) and Hssina et al. (2014) also confirmed the same. Also, the oblique decision tree classifier and LDA classifier is the least accurate for both the datasets. C4.5 is used in classification problems and it is the most used algorithm for building Decision tree. It is suitable for real world problems as it deals with numeric attributes and missing values. The algorithm can be used for building smaller or larger, more accurate decision trees and the algorithm is quite time efficient. Compared to ID3, C4.5 performs by default a tree pruning process, which leads to smaller trees, more simple rules and more intuitive interpretations. For the classification of agricultural pest data in to different classes C4.5 can be used, which gives more accurate classification system, thus enabling us to quickly classify the large volume of data into different classes assisting in quick pest management decision making.
ACKNOWLEDGEMENTS
The authors are grateful to Commissionerate of Agriculture, Government of Maharashtra, for sharing the pest data set from Crop Pest Surveillance and Advisory Project (CROPSAP).
REFERENCES
[1] Alagukumar, S. and Lawrance R 2015. A Selective Analysis of Microarray Data Using Association Rule Mining. Procedia Computer Science, 47: 3-12.
[2] Alagukumar, S. and Lawrance R 2015 Algorithm for Microarray Cancer Data Analysis Using Frequent Pattern Mining and Gene Intervals.
International Journal of Computer Applications,
ISSN: 0975 – 8887, no.(1) : 9-14.
[3] Han J and Kamber M 2005. Data Mining:
Concepts and Techniques. ELSEVIER
Publications, pp744.
[image:6.595.115.498.268.496.2]154
Computer Science and Applications, 4(2) :
13-19.https://cran.r-project.org/
[5] Parthasarathy S and Aggarwal CC 2003. On the use of conceptual Reconstruction for Mining Massively Incomplete Data Sets. IEEE
Transactions on Knowledge and Data
Engineering, 15(6) : 1512-1521.
[6] Priyam A, Abhijeeta RG Ratheeb A and Srivastava BS2013. Comparative Analysis of Decision Tree Classification Algorithms. International Journal of
Current Engineering and Technology, 3(2) :
334-337.
[7] Quinlan JR 1996. Improved use of continuous attributes in C4. 5. Journal of artificial intelligence
research,4 : 77-90.
[8] Quinlan JR 2014. C4. 5: programs for machine
learning. Elsevier Publications, pp302.
[9] Raorane, A, A., Kulkarni, R, V., “Data Mining: An effective tool for yield estimation in the agricultural sector”, International Journal of Emerging Trends & Technology in Computer Science (IJETTCS), Volume.1, Issue.2, August 2012, pp: 75-79.
[10] Safavian SR and Landgrebe D 1991. A survey of decision tree classifier methodology. IEEE Transactions on Systems, Man and