A Study and Analysis of Decision Tree Based
Classification algorithms using R
V.Saranya1, R.Porkodi2
M.Phil Research Schola , Assistant Professo
Department of Computer science, Bharathiar University, Coimbatore-46, India. Email: [email protected] , [email protected]
Abstract – Nowadays, Data Mining has been successfully enforced to several fields such as business administration, marketing and sales, diagnostics, manufacturing processes and astronomy. Data mining has become a well established discipline within the domain of Artificial Intelligence and Knowledge Engineering. Data mining is explained as the non-trivial process of identifying valid, new, potentially fruitful and eventually comprehensible pattern in raw data. Alternatively, it has been called as Knowledge discovery in databases, exploratory data analysis, data driven discovery and deductive learning. Classification is one of the most familiar data mining techniques which comes under predictive model and used to classify each item in a set of data into one of a predefined set of classes or groups. In this classification, decision tree is used to estimate group relationships for exact data instances and helps to elevate the cause of dimensionality. This paper presents the comparative study on five decision tree classification algorithms such as ID3, C4.5, C5.0, PART and Bagging CART. The comparative study shows that the Bagging CART technique gives a high classification accuracy than the rest of the algorithms. These algorithms are evaluated by precision, recall, f-measures and kappa statistics.
Index Terms-Data mining, Classification, Decision tree and Bagging CART.
1. INTRODUCTION
Data mining is described as the process used to extract usable data from a larger amount of raw data. Data mining is the process of evaluating data from dissimilar perspective and shortening it into useful information.
At present, Data mining has had a significant impact on the information industry, due to the wide availability of huge datasets, which are stored in databases of various types. Data mining is presence place into apply and considered for databases, along with relational databases, object relational databases and object oriented databases, data warehouses, transactional databases, unstructured and partially structured repositories, spatial databases, multimedia databases, time-series databases and textual databases.[1]
Data mining techniques can help to providing solutions of two significant types such as prediction and description. The models generated by predictive methods measure future and unknown values using known attributes or fields of database to make the prediction. On the other hand, descriptive models, explore the properties of the proceed data to identify patterns that summarize the data. [2]
Classification is one kind of data mining task that involves finding rules that partition the data into disjoint groups. It is basically a process of discovering a model that explain and differentiate data classes of test data set based upon set of training data. [3] It is used in many applications such as artificial intelligence, machine learning, statistics and database system. It consists of several classification discovery models such as decision trees, neural networks genetic algorithms and the statistical models like linear/ geometric discriminates. The Decision tree approach is most useful and effective technique in classification problems. It is a set of conditions organized in a hierarchical structure and used to predict the data from the existing one that is similar to classification and segmentation.
The paper organized as follows: section 1 describes the introduction on data mining, section 2 describes the literature review, section 3 defines the methodology of the classification techniques, section 4 discusses about the experimental results and finally the paper is concluded in section 5.
2. LITERATURE REVIEW
developed the Weka method and it is based on choosing the file and selecting attributes to convert .csv file to flat file. The decision tree algorithms are presented and achieved a high rate of accuracy for classify the data into the correctly and incorrectly instances. Anshul Goyal et .al [7] background study a performance evaluation of Naïve bayes and J48 classification algorithms. J48 gives more classification accuracy for bank dataset having two values Male and Female. The result shows that j48 and Naïve Bayes gives better accuracy.
ShwetaKharya et.al [8] examined various data mining approaches that have been applied for breast cancer diagnosis and prognosis. Decision tree is search to be the best forecaster with 93.62% Accuracy on benchmark dataset and also on SEER data set. Abdullah H. Wahbeh et. al [9] had presented a performance evaluation of Naïve Bayes, J48 classification, sequential Minimal Optimization (SMO) classifier. Compared these three classification techniques based on two main aspects such as accuracy and execution time. In term of accuracy, results showed that the Naïve Bayes classifier achieved the highest accuracy, followed by SMO and J48 classifier. In term of execution time, results showed that the SMO model takes less execution time followed by the NB model and J48 classifier.
S.Archana et.al [10] discussed about the different classification algorithms and their advantages and disadvantages. These classification algorithms were enforced on various types of data sets similar to data of patients, financial data according to performances. Therefore these classification techniques displayed how a data can be determined and grouped when a new set of data is available. Each technique has got its own pros and cons and that based on the needed Conditions each one as needed can be selected.
Tina R. Patil et.al [11] had presented that to make comparative evaluation of classifiers such as Naive Bayes and J48 in the context of bank dataset to maximize true positive rate and minimize false positive rate of defaulters. For result, the comparison of classification based on the three main aspects such as classification accuracy, sensitivity and specificity. The outcome of the study shows that J48 gives better accuracy. Sonali Agarwal et.al [12] had proposed Support Vector Machines (SVM) are established as a best classifier with maximum accuracy and minimum root mean square error (RMSE). The study also consists of a comparative analysis of all Support
Vector Machine Kernel categories and in this the Radial Basis Kernel was known as a best choice for Support Vector Machine.
Mehrbakhsh Nilashi et.al [13] had discussed a new knowledge based systems for breast cancer disease. For experimental results, two datasets are collected from UCI machine learning repository. The datasets are WBCD and Mammographic mass. For both the datasets, the fuzzy rule-based techniques achieved good prediction accuracy. Soumadip Ghosh, Sushanta Biswas et.al [14] had proposed a Neurofuzzy (NFS) classification method that extracts the features-wise information about a set of input patterns. For experimental results, 10 benchmark data sets are collected from UCI machine learning repository. The datasets are Breast Cancer Wisconsin, KDD Cup 1999 (10-percent), Statlog Landsat Satellite, Mammographic Mass, Wilt, Mushroom, Pima Indians Diabetes, Iris, Spambase, and Car Evaluation. Three classification techniques are used namely proposed NFS, RBFNN and ANFIS. Proposed algorithm NFS was compared with already existing algorithms RBFNN and ANFIS. Comparisons are made through the performance measures such as precision, recall, f-measures and Kappa statistic value. For all the datasets, the proposed algorithm NFS gives better result as compared to the existing algorithms.
R.Porkodi [15] had compared the five classification algorithms namely Naïve Bayes, KNN, CN2, SVM and Random Forest. Random forest algorithm for lung cancer dataset outperforms well than the remaining algorithms during the validation carried by Area Under Curve. In the outset, the four algorithms KNN, CN2, Naïve Bayes and Random forest gives better performance and the SVM classification algorithm obtained poor result for this data set.
3. METHODOLOGY
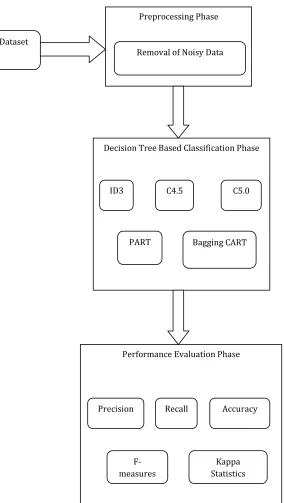
Fig .1 Study of Decision Tree based Classification Algorithms
3.1 Dataset
This study uses four datasets namely Iris, Contact lenses, Balance scale and Pima which are collected from UCI Repository. R tool is used for
analyzing the performance of the classification algorithms. The instances and attributes of the four datasets are listed in Table 1.
Table 1. Samples and Attributes list of datasets
Measures/
Attributes
Datasets
Iris Contact lenses
Balance
scale Pima
Instance 149 24 625 768
Attribute 5 5 5 9
3.2 Decision Tree Based Classification Algorithms
The goal of Classification is to build a set of models that can correctly foresee the class of the different objects. Classification is a two-step process: Build model using training data. Every object of the data must be pre-classified. The model developed in the previous step is tested by nominating class labels to data objects in a test dataset. The test data may be different from the training data. Every element of the test data is also reclassified in advance. Traditionally classification techniques are broadly divided in Decision tree classification, Bayesian classification, Distance based classification and neural network based classification algorithms and this study focuses on four Decision tree based classification algorithms.
A decision tree is also labeled as a prediction tree. A decision tree uses a construction to indicate sequences of decisions and impacts. Given input X={X1, X2,..,Xn}, the goal is to predict a response or output variable Y. Each member of the set {X1,X2,…,Xn} is called an input variable. The prediction can be attained by establishing a decision tree with test points and branches. A decision is made at each test point, to select a precise branch and traverse down the tree. [16] There are many specific decision-tree algorithms such as, ID3, C4.5, C50, CART, CHAID, Bagging CART, PART and Random Forest.
3.2.1ID3 (Iterative Dichotomiser 3)
ID3 is a common decision tree learning algorithm that created by Ross Quinlan(1983). The
Dataset
Preprocessing Phase
Decision Tree Based Classification Phase
ID3 C4.5 C5.0
PART Bagging CART
Performance Evaluation Phase
Precision Recall
F-measures
Accuracy
[image:3.612.334.553.182.289.2]fundamental idea of ID3 algorithm is to build the decision tree by applying a top-down, greedy search through the particular sets to check each element at every tree node. ID3 algorithm chooses the attribute to be splitted based on two metrics. [17] There are, (a)Entropy
It is used to measuring homogeneity of a learning set. The entropy of S related to this Boolean classification is:
Entropy(S) = - P(positive) P(positive) - P(negative) P(negative)
(b) Information Gain
It is used to measuring the expected reduction in Entropy. The information gain, Gain(S,A) of an attribute A,
Gain(S, A) = Entropy(S) – Sum for v from 1 to n of (|Sv|/|S|) * Entropy(Sv)
3.2.2 C4.5
C4.5 is also called as statiscal classifier and that creates a decision tree based on a set of labeled input data. The decision trees generated by C4.5 can be used for classification. These algorithms adopt a greedy (Backtracking) approach for construction of decision tree in top-down recursive divide and conquer manner. J48 is an open source Java implementation of the C4.5 algorithm in the Weka data mining tool [18]. C4.5 algorithm is an enhancement over the spontaneous ID3 algorithm. It can handle missing data. The over fitting problem in ID3 is overcome by the C4.5 algorithm.
3.2.3 C5.0
C5.0 algorithm is a successor of C4.5 algorithm. It gives a binary tree or multi branches tree. It uses Information Gain (Entropy) as its splitting criteria. C5.0 pruning technique adopts the Binomial Confidence Limit method. In a case of handling missing values, C5.0 allows to whether estimate missing values as a function of other attributes or apportions the case statistically among the results. [19]
3.2.4 PART
PART is a rule system that creates pruned C4.5 decision trees for the data set and extracts rules and those instances that are enclosed by the rules are eliminated from the training data. The process is
repeated until all instances are covered by extracted rules.
The PART technique avoids global optimization step used in C4.5rules and RIPPER. It generates an unlimited decision list using essential separate and conquer procedure. It builds a partial decision tree to obtain a rule. It uses C4.5’s procedures to build a tree. It uses separate-and-conquer. It builds a partial C4.5 decision tree in every iteration and makes the "best" leaf into a rule. [20]
3.2.5 Bagging CART
Breiman developed the Bagging CART algorithm and appeared shortly after his seminal work defining the field and has gained traction following the increased interest in bootstrapping and like procedures in statistical analysis and it is helpful to think of it as bootstrapping for tree analysis. It can be used to improve both the stability and predictive power of classification and regression trees, but its use is not restricted to improving tree-based predictions. It is a general technique that can be applied in a wide variety of settings to improve predictions. The name derives from bootstrap aggregating and involves creating multiple similar datasets, re-running the tree analysis, and then collecting the aggregate of the results and re-calculating the tree and associated statistics based on this aggregate.
This technique is frequently used as cross-validation for larger trees a user desires to prune and where various versions of the same tree have widely different rates of misclassification. In general, the procedure will improve the results of a highly unstable tree but may decrease the performance of a stable tree. [19]
4. EXPERIMENTAL RESULTS
In this study, the accuracy of five decision tree based classification algorithms are tested using the above mentioned four datasets and these algorithms are compared based on the Precision, Recall, F-Measure and Kappa statistics.
achieved 98% and the lowest measure is C5.0 and PART has the value as 97%.
Table 2. Performance measures for iris dataset.
Accuracy Precision Recall
F-measure
Accuracy Kappa
statistic
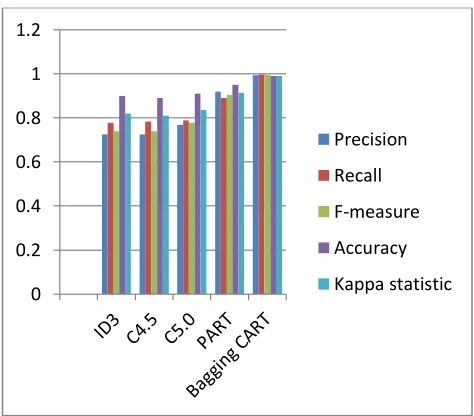
ID3 0.98 0.98 0.97 0.98 0.97
C4.5 0.98 0.98 0.98 0.99 0.98
C5.0 0.97 0.97 0.97 0.97 0.96
PART 0.97 0.97 0.97 0.97 0.96
Bagging CART
0.99 0.99 0.99 0.99 0.99
[image:5.612.331.568.352.560.2]The Fig.2 represented the C4.5 and Bagging CART classifier gives more accuracy than the rest of algorithms for iris dataset.
Fig.2 Performance measures for Iris dataset
The Table 3. describes the performance measures for the Balance scale Dataset for decision tree classification algorithms like ID3, C4.5, C5.0, PART and Bagging CART. From this Bagging CART classifier produces best accuracy measure compared to all other classifier algorithms such as ID3, C4.5, C5.0 and PART. The next highest performance measure is
PART algorithm achieved 95% and the lowest measure is C5.0 has the value as 89%.
Table 3. Performance measure for Balance scale dataset
Accuracy Precision Recall
F-measure
Accuracy Kappa
statistic
ID3 0.725 0.778 0.739 0.90 0.82
C4.5 0.725 0.783 0.739 0.89 0.81
C5.0 0.769 0.789 0.778 0.91 0.835
PART 0.919 0.891 0.904 0.95 0.914
Bagging CART
0.993 0.998 0.995 0.99 0.99
The Fig.3 represented the Bagging CART classifier gives the more accuracy result and the C4.5 classifier produce the lowest accuracy result for Balance Scale dataset.
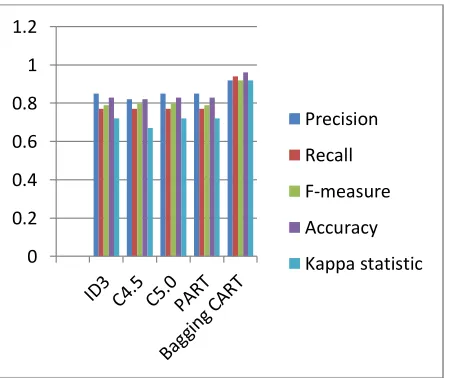
Fig.3 Performance measures for Balance scale dataset The Table 4. describes the performance measures for the Contact lenses Dataset for decision tree classification algorithms like ID3, C4.5, C5.0, PART and Bagging CART. From this Bagging CART classifier produces best accuracy measure compared to all other classifier algorithms such as ID3, C4.5, C5.0 and PART. The lowest measure is C4.5 has the value as 82%.
0 0.2 0.4 0.6 0.8 1 1.2
Precision
Recall
F-measure
Accuracy
Kappa statistic
0 0.2 0.4 0.6 0.8 1 1.2
Precision
Recall
F-measure
Accuracy
[image:5.612.72.304.373.582.2]Table 4. Performance measure for Contact lenses dataset
Accuracy Precision Recall
F-measure
Accuracy
Kappa statistic
ID3 0.85 0.77 0.79 0.83 0.72
C4.5 0.82 0.77 0.80 0.82 0.67
C5.0 0.85 0.77 0.80 0.83 0.72
PART 0.85 0.77 0.79 0.83 0.72
Bagging CART
0.92 0.94 0.92 0.96 0.92
[image:6.612.336.548.318.491.2]The Fig.4 represented the Bagging CART classifier gives the more accuracy result and the C4.5 classifier produce the lowest accuracy result for Contact lenses dataset.
Fig.4 Performance measures for Contact lenses dataset The Table 5. describes the performance measures for the Pima Indian Diabetes Dataset for decision tree classification algorithms like ID3, C4.5, C5.0, PART and Bagging CART. From this Bagging CART classifier produces best accuracy measure compared to all other classifier algorithms such as ID3, C4.5, C5.0 and PART. The next highest performance measure is ID3 and C5.0 algorithms achieved 84% and the lowest measure is PART has the value as 81%.
Table 5. Performance measure for Pima Indian Diabetes dataset
Accuracy Precision Recall
F-measure
Accuracy Kappa
statistic
ID3 0.80 0.84 0.81 0.84 0.64
C4.5 0.80 0.84 0.81 0.83 0.61
C5.0 0.81 0.83 0.82 0.84 0.63
PART 0.83 0.80 0.81 0.81 0.62
Bagging CART
0.99 0.98 0.99 0.99 0.99
[image:6.612.74.299.333.522.2]The Fig.5 represented the Bagging CART classifier gives the more accuracy result and the PART classifier produce the lowest accuracy result for Pima Indian Diabetes dataset.
Fig.5 Performance measures for Pima Indian Diabetes dataset.
5. CONCLUSION
Data mining is used to extract useful knowledge from large data repositories. Recently data mining techniques have enclosed every field in our life. Data mining have numerous algorithms to use for different purpose. In this paper discussed about the classification techniques. From this, the decision tree based classification algorithms namely ID3, C4.5, C5.0, PART and Bagging CART are used to perform classification process. The four data sets Iris, Balance scale, Contact lenses, Pima Indian Diabetes have been applied and performance is validated based on Accuracy (CA), Precision, Recall, F-Measure and Kappa Statistics.
0 0.2 0.4 0.6 0.8 1 1.2
Precision
Recall
F-measure
Accuracy
Kappa statistic
0 0.2 0.4 0.6 0.8 1 1.2
Precision
Recall
F-measure
Accuracy
The experimental result shows both C4.5 and Bagging CART classification algorithms are suitable for the Iris dataset. Because the performance measure values of Precision, Recall and F-Measure value is 0.99. The next dataset is Balance scale dataset, Bagging CART classifier gives accurate result. Because it has the best accuracy compare to other classification algorithms. For Contact lenses dataset, Bagging CART Classifier gives the maximum accuracy. The Bagging CART classifier produces the more accuracy than the other decision tree classification techniques for the Pima dataset. The future work can be extended to add some other classification algorithms for the same dataset. Overall, Bagging CART algorithm outperforms well for all four datasets.
REFERENCES
[1] Osmar R.; Zaine. (1999): Introduction to DataMining, CMPUT690 Principles of Knowledge Discovery in Databases, University of Alberta, Department of Computing Science. [2] Han Wu.; Shangqi Yang.; Zhangqin Hung.; Jian
He.; Xiaoyi Wang. (2018): Type 2 diabetes mellitus prediction model based on data mining, Informatics in Medicine Unlocked.
[3] Geetha Kashyap.; Ekta chauhan. (2016): Parametric comparisons of classification techniques in Data mining application, International journal of Engineering Development Research 4(2), pp. 1117-1123.
[4] L.Surya prasanthi.; R.Kiran kumar. (2015): ID3 and Its Applications in Generation of Decision Tree across Various Domains Survey, International Journal of computer science and Information Technologies,6, pp.5353-5357. [5] Min Song.; Sugeon Kim.; Geo Zhang.; Ying
Ding.; Tamy Chambers : Predictivity and Influence in Bioinformatics - A Bibliometric Analysis using PubMed central.
[6] Trilok Chand Sharma.; Manoj Jain.(2013): WEKA Approach for Comparative Study of Classification Algorithm, International Journal of Advanced Research in Computer and Communication Engineering, 2(4).
[7] Anshul Goyal and Rajni Mehta. (2012): Performance Comparison of Naïve Bayes and J48 Classification Algorithms, International Journal of Applied Engineering Research,7(11).
[8] Shweta Kharya. (2012): Using Data Mining Techniques For Diagnosis And Prognosis Of Cancer Disease, International Journal of
Computer Science, Engineering and Information Technology (IJCSEIT), 12(2).
[9] Abdullah H. Wahbeh and Mohammed Al-Kabi. (2012): Comparative Assessment of the Performance of Three WEKA Text Classifiers Applied to Arabic Text, Journal of Basic Science and Engineering, 21(1), pp.15-28.
[10] S.Archana1; Dr. K.Elangovan.(2014): Survey of Classification Techniques in Data Mining, International Journal of Computer Science and Mobile Applications, 2(2), pp. 65-71.
[11] Tina R. Patil; Mrs. S. S.
Sherekar.(2013):Performance Analysis of Naive Bayes and J48 Classification Algorithm for Data Classification, International Journal Of Computer Science And Applications,6(2).
[12] Sonali Agarwal; G. N. Pandey; and M. D. Tiwari.(2012): Data Mining in Education: Data Classification and Decision Tree Approach, International Journal of e-Education, e-Business, e-Management and e-Learning, 2(2).
[13] Mehrbakhsh Nilashi; Othman Ibrahim; Hossein Ahmadi; Leila Shahmoradi. (2014): A knowledge-based system for breast cancer classification using fuzzy logic method, Telematics and Informatics, 34, pp.133-144. [14] Soumadip Ghosh; Sushanta Biswas; Debasree
Sarkar ,Partha Pratim Sarkar. (2014):A novel Neuro-fuzzy classification technique for data mining, Egyptian Informatics Journal, 15, pp. 129–147.
[15] R.Porkodi. (2014): A Study on Performance Analysis of Data Mining Classification Algorithms over Lung Cancer Dataset, International Journal of Research in Information Technology (IJRIT), 2(3), pp. 49-58.
[16] Akshat Sharma; Anuj Srivastava. (2016) :Understanding decision tree algorithm by using R programming language, ACEIT conference proceeding.
[17] Rupali Bhardwaj; Sonia Vatta. (2013): Implementation of ID3 Algorithm”, International Journal of Advanced Research in Computer science and Software Engineering, 3(6).
[18] Payal pahwa; Manju papreja; Renu Migrani. (2014): Performance Analysis of classification Algorithms, IJCSMC, 3(4), pp.50-58.
[19] Alvin Nguyen. : Comparative Study of C5.0 and CART algorithms
[20] Clifton D. Sutton. : Classification and Regression Trees, Bagging, and Boosting.
catheter dataset, National Conference on Advance computing.
[22] Neha Midha; Dr. Vikram Singh. (2015): A survey on classification Techniques in Data mining, International Journal of Computer science and Management studies, 16(1).
[23] G.Suganya; Dr.R.Porkodi. (2015): Performance Analysis of classification algorithms using Disease dataset: A Comparative Study, National Conference on Advance Computing.
[24] N. Mlambo. (2016) :Data Mining: Techniques, Key Challenges and Approaches for Improvement, International Journal of Advanced Research in Computer Science and Software Engineering, 6(3), pp. 59-65.
[25] B.Nithya; Dr.V.Ilango. (2017): Comparative Analysis of classification methods in R environment with two different datasets, International Journal of scientific Research in Computer Science, Engine and Information Technology, 2(6).
[26] Sudhamathy.G; Thilagu.M; Padmavathi.G. (2016) :Comparative Analysis of R Package classifiers Using Breast Cancer Dataset, IJET, 8(5).
[27] https://en.wikipedia.org/wiki/C4.5algorithm. [28] Pablo Bermejo; José A. Gámez; José M.
Puerta.(2014): Speeding up incremental wrapper feature subset selection with Naïve Bayes classifier, Knowledge-Based Systems, 55, pp.140-147.
[29] Shadab Adam Pattekari and Asma Parveen. (2012): Prediction System For Heart Disease Using Naive Bayes, International Journal of Advanced Computer and Mathematical Sciences, 3(3),pp. 290-294.
[30] Wolfson, O.; Sistla, P.; Chamberlain, S. and Yesha. (1999): Updating and Querying Databases that Track Mobile Units, Distributed and parallel databases.
[31] Otero, J.; Sanchez, L. (2005): Induction of Descriptive Fuzzy classifiers with the Logitboost Algorithm, software computing, pp.825-835. [32] Li-Min Wang; Xiao-Lin Li; Chun-Hong Cao;
Sen-Miao Yuan. (2006) :Combining decision tree and Naive Bayes for classification, Knowledge-Based Systems, 19,pp. 511-515.
[33] S. B. Ishwarya; R. Porkodi. (2016): Survey on Biomarkers Classification in Data Mining, International Journal of Advanced Research in Computer Science and Software Engineering , 6(3), pp. 330-338.
[34] Youngjoong KO. (2017): How to use negative class information for Naive Bayes classification,