Abstract
Post-editing is commonly performed on computer-generated texts, whether from Machine Translation (MT) or NLG systems, to make the texts accept-able to end users. MT systems are often evaluated using post-edit data. In this paper we describe our experience of using post-edit data to evaluate SUMTIME-MOUSAM, an NLG system that pro-duces marine weather forecasts.
1 Introduction
Natural Language Generation (NLG) systems must of course be evaluated, like all NLP systems. Previous work on NLG evaluation has focused on either experiments con-ducted with users who read the generated texts, or on com-parisons of generated texts to corpora of human-written texts. In this paper we describe an evaluation technique, which looks at how much humans need to post-edit gener-ated texts before they are released to users. Post-edit evaluations are common in machine translation, but we be-lieve that ours is the first large-scale post-edit evaluation of an NLG system.
The system being evaluated is SUMTIME-MOUSAM [Sri-pada et al, 2003], an NLG system, which generates marine weather forecasts from Numerical Weather Prediction (NWP) data. SUMTIME-MOUSAM is operational and is used by Weathernews (UK) Ltd to generate 150 draft forecasts per day, which are post-edited by Weathernews forecasters before being released to clients.
2 Background
2.1 Evaluating NLG Systems
Common evaluation techniques for NLG systems [Mellish and Dale, 1998] include:
• Showing generated texts to users, and measuring how effective they are at achieving their goal, compared to some control text (for example, [Young, 1999])
• Asking experts to rate computer-generated texts in various ways, and comparing this to their rating of
manually authored texts (for example, [Lester and Porter, 1997])
• Automatically comparing generated texts to a corpus of human authored texts (for example, [Bangalore et al, 2000]).
Each of these techniques is effective under different ap-plication contexts in which NLG systems operate. For in-stance, a corpus based technique is effective when a high quality corpus is available. The appeal of post-edit evalua-tion as done with SUMTIME-MOUSAM is that (A) the edits should indicate actual mistakes instead of just differences in how things can be said and (B) the amount of post-editing required is a very important practical measure of how useful the system is to real users (forecasters in our case).
Post-edit evaluations are a standard technique in Machine Translation [Hutchins and Somers, 1992]. The only previ-ous use of post-edit evaluation in NLG that we are aware of is Mitkov and An Ha [2003], but their evaluation is rela-tively small, and they give little information about it.
2.2 SUMTIME-MOUSAM
SUMTIME-MOUSAM [Sripada et al, 2003] is an NLG system that generates textual weather forecasts from numerical weather prediction (NWP) data. The forecasts are marine forecasts for offshore oilrigs. Table 1 shows a small extract from the NWP data for 12-06-2002, and Table 2 shows part of the textual forecast that SUMTIME-MOUSAM generates from the NWP data. The Wind statements in Table 2 are mostly based on the NWP data in Table 1.
Time Wind Dir
Wind Spd 10m
Wind Spd 50m
Gust 10m
Gust 50m 06:00 W 10.0 12.0 12.0 16.0 09:00 W 11.0 14.0 14.0 17.0 12:00 WSW 10.0 12.0 12.0 16.0 15:00 SW 7.0 9.0 9.0 11.0 18:00 SSW 8.0 10.0 10.0 12.0 21:00 S 9.0 11.0 11.0 14.0 00:00 S 12.0 15.0 15.0 19.0
Table 1. Weather Data produced by an NWP model for 12-Jun 2002
Evaluation of an NLG System using Post-Edit Data: Lessons Learnt
Somayajulu G. Sripada and Ehud Reiter and Lezan Hawizy
Department of Computing Science
University of Aberdeen
Aberdeen, AB24 3UE, UK
SUMTIME-MOUSAM generates texts in three stages [Reiter and Dale, 2000].
Document Planning: Text structure is specified by Weathernews, via a control file. The key content-determination task is selecting ‘important’ or ‘significant’ data points from the underlying weather data to be included in the forecast text. SUMTIME-MOUSAM uses a bottom-up segmentation algorithm for this task [Sripada et al, 2002].
Micro-planning: The key decisions here are lexical selec-tion, aggregaselec-tion, and ellipsis. SUMTIME-MOUSAM uses rules for this that are derived from corpus analysis and other knowledge acquisition activities [Reiter et al, 2003; Sripada et al, 2003].
Realization: SUMTIME-MOUSAM uses a simple realiser that is tuned to the Weathernews weather sublanguage.
SUMTIME-MOUSAM is partially controlled by a control data file that Weathernews can edit. For example, this file specifies error function data that controls the segmentation process for content determination. The error function data decides the level of abstraction achieved by the segmenta-tion process – the larger the error funcsegmenta-tion value the higher the level of abstraction achieved by segmentation.
2.3 SUMTIME-MOUSAM at Weathernews
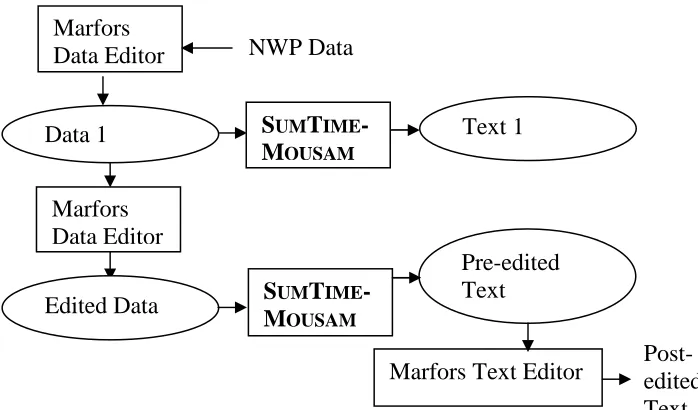
Weathernews (UK) Ltd, a private sector weather services company, uses SUMTIME-MOUSAM to generate draft fore-casts. The process is illustrated in Figure 1. Forecasters load the NWP data for the forecast into Marfors, which is Weathernews’ forecasting tool. Using Marfors, forecasters edit the NWP data, using their meteorological expertise and additional information such as satellite weather maps. They then invoke SUMTIME-MOUSAM to generate an initial draft of the forecast. This initial draft helps the forecaster under-stand the NWP data, and often suggests further edits to the NWP data. The generate-and-edit-data process may be re-peated. When the forecaster is satisfied with the NWP data, he invokes SUMTIME-MOUSAM again to generate a final
draft textual forecast, marked ‘Pre-edited Text’ in Figure 1. The forecaster then uses Marfors to post-edit the textual forecast. When the forecaster is done, Marfors assembles the complete forecast from the individual fields, and sends it to the customer.
Section 2. FORECAST 6 - 24 GMT, Wed 12-Jun 2002
Field Text
WIND(KTS) 10M W 8-13 backing SW by mid after-noon and S 10-15 by midnight. WIND(KTS) 50M W 10-15 backing SW by mid
after-noon and S 13-18 by midnight. WAVES(M)
SIG HT
0.5-1.0 mainly SW swell.
WAVES(M) MAX HT
1.0-1.5 mainly SW swell falling 1.0 or less mainly SSW swell by after-noon, then rising 1.0-1.5 by mid-night.
WAVE PERIOD (SEC)
Wind wave 2-4 mainly 6 second SW swell.
WINDWAVE PERIOD (SEC)
2-4.
SWELL PERIOD (SEC)
5-7.
WEATHER Mainly cloudy with light rain showers becoming overcast around midnight.
VISIBILITY (NM)
Greater than 10.
AIR TEMP(C) 8-10 rising 9-11 around midnight. CLOUD
(OKTAS/FT)
[image:2.612.323.549.114.395.2]4-6 ST/SC 400-600 lifting 6-8 ST/SC 700-900 around midnight.
Table 2. Extract from SUMTIME-MOUSAM Forecast Pro-duced for 12-Jun 2002 (AM).
Figure 1. Schematic Showing SUMTIME-MOUSAM Used at Weathernews
Post-edited
Text
Marfors
Data Editor
Marfors Text Editor
SUMTIME-MOUSAM
Marfors
Data Editor
Pre-edited
Text
SUMTIME-MOUSAM
Text 1
Data 1
Edited Data
[image:2.612.132.481.478.683.2]Note that SUMTIME-MOUSAM is used for two purposes by Weathernews; to help forecasters understand and there-fore edit the NWP data, and to help generate texts for cus-tomers. In this paper we focus on evaluating the second usage of the system (generating texts for customers).
When a forecast is complete, Marfors saves the final ed-ited NWP data, marked ‘Eded-ited data’ in Figure 1 and the final edited forecast marked ‘Post-edited Text’ into a data-base. This data is forwarded to us for 150 sites per day; this is the basis of our post-edit evaluation. Marfors does not directly save the SUMTIME-MOUSAM text that forecasters edit (‘Pre-edited Text’ in Figure 1), but we can reconstruct this text by running the system on the final edited NWP data.
3 Post-Edit Evaluation
3.1 Data
The evaluation was carried out on 2728 forecasts, collected during period June to August 2003. Each forecast was roughly of 400 words, so there are about 1 million words in all in the corpus.
For each forecast, we have the following data
• Data: The final edited NWP data
• Pre-edit text: The final draft forecast produced by SUMTIME-MOUSAM, which we reconstruct as de-scribed in Section 2.3.
• Post-edit text: The manually post-edited forecast, which was sent to the client.
• Background information: includes date, location, and forecaster
We do not currently use the NWP data (other than for reconstructing SUMTIME-MOUSAM texts), although we hope in the future to include it in our analyses, in a manner roughly analogous to Reiter and Sripada [2003]. This data set continues to grow, we receive approximately 150 new forecasts per day.
3.2 Analysis Procedure
The following procedure is performed automatically by a software tool. First, we perform some data transformation and cleaning. This includes breaking sentences up into phrases, where each phrase describes the weather at one point in time.
For example, the pre-edit text in Figure 2 would be bro-ken up into three phrases:
A1 SW 20-25
A2 backing SSW 28-33 by midday
A3 then gradually increasing 34-39 by midnight
Figure 2. Example pre-edit and edit texts from the post-edit corpus
The Figure 2 post-edit text is divided into two phrases:
B1 SW 22-27
B2 gradually increasing SSW 34-39
The second step is to align phrases from these two tables as a preparation for comparison in the next step. Alignment is a complex activity and is described in detail next. To start with we generate an exhaustive list of all the possible com-binations of phase alignments.
For example, consider the texts in Figure 2. Here we gen-erate the following list of possible alignments:
{(A1, B1), (A1, B2), (A2, B1), (A2, B2), (A3, B1), (A3, B2)}
Next, we compute match scores for each of these possi-ble alignments and use them for selecting the right align-ments. For each unedited phrase Ai, the alignment with the highest matching score is selected. For the purpose of com-puting the match scores, phrases are parsed using ‘parts of speech’ designed for weather sublanguage such as direction,
speed and time. The total match score of a pair of phrases is
computed as the sum of the match scores for their constitu-ents. Match score (MS) for a pair of constituents depends upon their part of speech and also their degree of match. MS is defined as a product of two terms as explained below:
• Match score due to degree of match: we assign a match score of 2 for exact matches, 1 for partial matches and 0 for mismatches.
• Weight factor denoting importance of constituents for alignment: Constituents belonging to certain parts of speech (POS) are more significant for alignment than others. For example, times are more significant for alignment than verbs. Also weights are varied for the same POS based on its context in the phrase. For ex-ample, direction receives higher weight if it occurs in a phrase without a time or speed. This is because in such phrases direction is the only means for align-ment.
Continuing with our example sentences in Figure 2, we show below how we find an alignment for A3. As described earlier, A3 can be aligned to either B1 or B2. The MS for (A3, B1) is zero as shown in Table 3.
A. Pre-edit Text: SW 20-25 backing SSW 28-33 by
midday, then gradually increasing 34-39 by midnight.
B. Post-edit Text: SW 22-27 gradually increasing
POS A3 B1 MS conjunction Then <none> 0 Adverb Gradually <none> 0 Verb Increasing <none> 0 Direction <none> SW 0 Speed range 34-39 22-27 0 Time By midnight <none> 0
Table 3 Match Score for A3 and B1
The MS for (A3, B2) is 2*(2*w1+w2) where w1 is the weight for Adverb/verb and w2 (>w1) for speed as shown in Table 4. Based on the match scores computed above A3 is aligned with B2. Similarly A1 is aligned with B1. A2 is unaligned, and treated as a deleted phrase.
POS A3 B2 MS
[image:4.612.328.543.252.361.2]conjunction Then <none> 0 Adverb Gradually Gradually w1*2 Verb Increasing Increasing w1*2 Direction <none> SSW 0 Speed range 34-39 34-39 w2*2 Time By midnight <none> 0
Table 4. Match Score for A3 and B2
The third step is to compare aligned phrases, such as A1 and B1. One evaluation metric is based on comparing aligned phrases as a whole. Here we simply record ‘match’ or ‘mismatch’. For example, both (A1, B1) and (A3, B2) are mismatches. We then compare constituents in the phrases to determine more details about the mismatches. For this detailed comparison we use the domain-specific part-of-speech tags described earlier. Each part-of-speech should occur at most once in a phrase (in our weather sub-language), so we simply align on the basis of the tag. After constituents are aligned, we label each pre-edit/post-edit pair as match, replace, add, or delete. For example, A and B are analysed as in Table 5.
POS A B label
Direction SW SW match Speed 20-25 22-27 replace
Conjunction then <none> delete Adverb gradually gradually match Verb increasing increasing match Direction <none> SSW add Speed 34-39 34-39 match Time by midnight <none> delete
Table 5. Detailed Edit Analysis
3.3 Analysis of Results
We processed 2728 forecast pairs (pre-edited and post-edited). These were divided into 73041 phrases. Out of these, the alignment procedure failed to align 7608 (10%) phrases. For instance, in the example of Section 3.2, phrase
A2 was not aligned with any B phrase. Alignment failure generally indicates that the forecaster is unhappy with SUMTIME-MOUSAM’s segmentation that is with the sys-tem’s content determination. We have manually analysed some of these cases, and in general it seems the forecasters are performing more sophisticated data analysis than SUMTIME-MOUSAM, and are also more sensitive to which changes are significant enough to be reported to the user.
We have manually inspected alignment quality of 100 random phrase pairs to determine cases where our alignment procedure erroneously aligned phrases. We found one case of improper alignment. The pre-edited phrase ‘soon becom-ing variable’ has not been aligned to its correspondbecom-ing iden-tical post-edited phrase. Inspection of the rest of the corpus showed that this error repeated 54 times in the whole cor-pus. These cases have been classified as alignment failures and therefore do not affect the post-edit analysis.
Time (Hours) Direction Speed
00 ESE 12
03 ESE 12
06 ESE 11
09 ESE 11
12 ESE 10
15 ESE 8
18 ESE 9
21 ESE 11
[image:4.612.324.539.480.621.2]24 ESE 13
Table 6. Wind 10m data for 14 Jul 2003
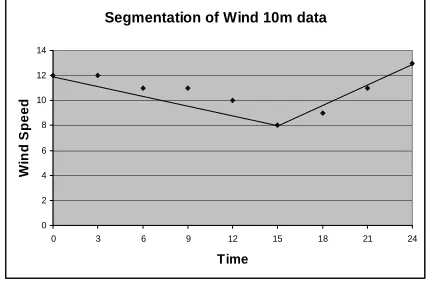
For example, consider the Wind 10m data shown in Table 6. Our content determination algorithm first segments the data in table 6 (see Sripada et al [2002] for more details). Segmentation is the process of fitting straight lines to a data set in such a way that a minimum error is introduced by the lines. Since the direction data is constant at ESE, there is only one segment for this data.
Figure 3. Segmentation of Wind speed data shown in Ta-ble 6.
Wind speed data however is segmented by two lines as shown in Figure 3, one line joining the point (0,12) with (15,8) and the second joining the point (15,8) with (24,13). Our content selection algorithm therefore selects data points
Segmentation of Wind 10m data
0 2 4 6 8 10 12 14
0 3 6 9 12 15 18 21 24
Time
W
in
d
S
p
e
e
[image:4.612.59.296.491.603.2](0,12), (15,8) and (24,13) to be included in the forecast. In this case our system produced:
“ESE 10-15 gradually easing 10 or less by mid afternoon
then increasing 11-16 by midnight”
However, forecasters view this data as a special case and don’t segment it the way we do. Here the wind speed is al-ways in the range of ‘10-15’ except at 1500 and 1800 hours. Therefore they mention the change as an additional informa-tion to an otherwise constant wind speed. In this case, the forecaster edited text is:
“ESE 10-15 decreasing 10 or less for a time later”. Talking about the segmentation differences, one of the forecasters at Weathernews told us that another factor af-fecting segmentation is related to the end user. End users of the marine forecasts are oil company staff who schedule activities on the oilrigs in the North Sea. Over the years forecasters at Weathernews have acquired a good under-standing of the informational needs of the oil company staff. So they use the forecast statements as messages to the end users about the weather and know what kind of messages will be useful to the end users. In the example texts shown in Figure 2 the forecaster could have thought that the impor-tant message to communicate about wind is that it is in-creasing monotonically and is likely to be in the range be-tween 22 (the actual initial wind speed) and 39. Everything else distracts this primary message and therefore needs to be avoided. Once again there is post segmentation reasoning used by the forecasters. We are investigating better pattern matching techniques and better user models to improve our content selection.
S. No. Mismatch Type Freq. % 1. Ellipses (word additions
and deletions)
35874 65
2. Data Related Replacements (range and direction re-placements)
10781 20
3. Lexical Replacements 8264 15
Total 54919
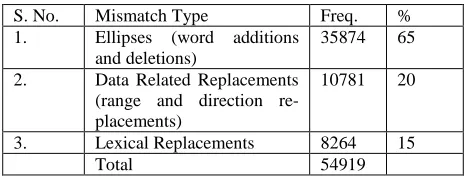
Table 7. Results of the Evaluation showing summary cate-gories and their frequencies
Going back to the successfully aligned phrases, 43914 (60%) are perfect matches, and the remaining 21519 (30%) are mismatches. Table 7 summarises the mismatches. Here, each mismatch is classified as
• Ellipses: additions and deletions. For example,
delet-ing the time phrase by midnight in the (A3, B2) pair. These generally indicate problems with SUMTIME -MOUSAM’s aggregation and ellipsis.
• Data replacements: changes (replaces) to constituents
that directly convey NWP data, such as wind speed and direction. For example, changing 20-25 to 22-27 in the (A1, B1) pair. These can indicate content prob-lems. They also occur when forecasters believe the
NWP data is incorrect but decide to just correct the forecast text and not the data (eg, skip generate-and-edit step described in section 2.3).
• Lexical replacements: All other changes (replaces). For
example, if the conjunction ‘then’ was replaced by ‘and’. This generally indicates a problem in SUMTIME-MOUSAM’s lexicalisation strategy.
For each pair of phrases compared in the evaluation, we have counted the number of times each edit operation such as add, delete and replace is performed by forecasters. For example consider the two phrase pairs shown in Table 5. For the first phrase pair of ‘SW 20-25’ and ‘SW 22-27’ fore-casters performed zero add, zero delete and one replace operation (‘20-25’ is replaced by ‘22-27’). For the second phrase pair of ‘then gradually increasing 34-39 by
mid-night’ and ‘gradually increasing SSW 34-39’ forecasters
performed one add (added ‘SSW’), two delete (deleted ‘then’ and ‘by midnight’) and zero replace operations. We hypothesized that forecasters were making significantly more add and delete operations than replace operations. For verifying this, we have performed a pairwise t-test. Vari-able1 for the t-test represents the sum of the counts of add and delete operations for each pair of phrases. Variable2 represents the count of replace operations. For example, for the two phrase pairs shown in Table 5, variable1 has values of zero and three where as variable2 has values of one and zero. This test showed (with a p value less than 10-20) that forecasters were performing more additions and deletions than replacements. In other words, ellipsis is the main prob-lem in our system. Most (25235 out of 35874, 70%) of these errors are deletions, where the forecaster deletes words from SUMTIME-MOUSAM’s texts.
A manual analysis of some ellipsis cases has highlighted some general phenomena. First of all, many ellipsis cases are “downstream” consequences of earlier changes. For ex-ample, if we look at the (A3, B2) pair above, this contains three ellipsis changes: then was deleted, SSW was added, and by midnight was deleted. The first two of these changes are a direct consequence of the deletion of phrase A2. If SUMTIME-MOUSAM’s content determination system was changed so that it did not generate A2, then the micro plan-ner would have expressed A3 as gradually increasing SSW
34-39 by midnight, which is identical to B2 except for by midnight.
[image:5.612.59.294.415.504.2]unambi-guous cases. We will not further discuss data replacement errors, since they reflect either content problems or cases where NWP data was not corrected at the input time but edited directly in the final text.
We have discussed lexical replacement errors in detail elsewhere [Reiter and Sripada, 2002]. In general terms, some errors reflect problems with SUMTIME-MOUSAM; for example, the system overuses then as a connective, so fore-casters often replaced then by alternative connectives such as and. However, many lexical replacement errors simply reflected the lexical preferences of individual forecasters [Reiter and Sripada, 2002]. For example, SUMTIME -MOUSAM always uses the verb easing to indicate a reduc-tion in wind speed. Most forecasters were happy with this, but 3 individuals usually changed this to decreasing.
A general observation is that some forecasters post-edited texts much more than others. For example, while overall 28% of phrases were edited, edit rates by individual fore-casters varied from 4% to 93%. We do not know why edit rates vary so much, although it may be significant the indi-vidual with the highest (93%) edit rate is one of the most experienced forecasters, who takes well-justified pride in producing well-crafted forecasts.
Summarizing the results of our evaluation:
1. SUMTIME-MOUSAM’s content determination can defi-nitely be improved, by using more sophisticated segmenta-tion techniques.
2. SUMTIME-MOUSAM’s micro-planner can certainly be improved in places, for example by varying connectives. However, many post-edits are due to individual differences, which we cannot do anything about.
We are currently carrying out another evaluation of S UM-TIME-MOUSAM by the end users, oilrig staff and other ma-rine staff who regularly read weather forecasts. In this study we compare user’s comprehension of weather information from human written and computer generated forecast texts. We also measure user ratings (preference) of human written and computer generated texts. Preliminary results from our study indicate that users make fewer mistakes on compre-hension questions when they are shown texts that use com-puter generated words with human selected content. Gener-ally users seem to prefer computer generated texts to human written texts given the same underlying weather data.
4 Lessons from our Post-Edit Evaluation
As stated in Section 2.1, we were attracted to post-edit evaluation because we believed that (A) people would only edit things that were clearly wrong; and (B) post-editing was an important usefulness metric from the perspective of our users (forecasters).Looking back, (B) was certainly true. The amount of post-editing that generated texts require is a crucial compo-nent of the cost of using SUMTIME-MOUSAM, and hence of the attractiveness of the system to users (forecasters). Al-though we have not measured the time required for perform-ing post-edits, we have used edit-distance measures used in MT evaluations as an approximate cost metric. We have
computed our cost metric by setting different cost (weight) values to different edit operations. Cost of add and replace operations is set to 5 and cost of delete is set to 1 as used in Su et al [1992]. The ratio of the cost of edits and the cost of writing the entire forecast manually (adding all the words) is computed to be 0.15. (A) however was perhaps less true than we had hoped. Wagner [1998] also described post-edited texts in MT as at times noisy. Our analysis of manu-ally written forecasts [Reiter and Sripada, 2002] had high-lighted a number of “noise” elements that made it more dif-ficult to extract information from such corpora. Basically there are many ways of communicating information in text, and the fact that a generated text doesn’t match a corpus text does not mean that the generated text is wrong. We as-sumed that people would only post-edit mistakes, where the generated text was wrong or sub-optimal, and hence post-edit data would be better for evaluation purposes than cor-pus comparisons.
In fact, however, there were many justifications for post-edits:
1. Fixing problems in the generated texts (such as overuse of then);
2. Refining/optimizing the texts (such as using for
a time);
3. Individual preferences (such as easing vs
de-creasing); and
4. Downstream consequences of earlier changes (such as introducing SSW in B2, in the example of Section 3.2).
We wanted to use our post-edit data to improve the sys-tem, not just to quantify its performance, and we discovered that we could not do this without attempting to analyze why post-edits were made. Probably the best way of doing this was to discuss post-edits with the forecasters. Alternatively, we could have asked forecasters to fill in problem sheets to capture their explanation of post-edits. Such feedback from the forecasters would have allowed us to reason with post-edit data to improve our system. In [Reiter et al, 2003] we explained that we found that analysis of human-written cor-pora was more useful if it was combined with directly work-ing with domain experts; and essentially this (perhaps not surprisingly) is our conclusion about post-edit data as well.
One of the lessons we learnt from this exercise has been that post-edit evaluations are useful to compute a cost metric to quantify the usefulness of a system. For example, as de-scribed earlier, we have computed a cost metric, 0.15 signi-fying the post-editing effort. Post-edit evaluations are also useful in revealing general problem areas in a system. For example, as described in section 3.3, our evaluation showed that ellipsis related problems are more serious in our system than others. However, post-edit evaluations are not affective in discovering specific problems in a system. The main rea-son for this is that many post-edits, as stated earlier, do not actually fix problems in the generated text at all. The real post-edits that fixed problems in the generated text were buried among the other noisy post-edits.
SUMTIME-MOUSAM and forecasters used Marfors (see sec-tion 2.3) to perform post-editing. Therefore, we had to ac-cept the post-edit data with all the noise. In MT, post-editors often work under predefined guidelines on post-editing and also use post-editing tools. For example, post-editing tools automatically revise texts to fix ‘down-stream’ conse-quences of human edits. If post-edit tools are similarly inte-grated into NLG systems, there is going to be a significant reduction in the number of noisy post-edits allowing us to focus on real post-edits.
Because post-editing is subjective varying from individ-ual to individindivid-ual, we need to understand the post-editing behaviour of individuals to analyze the noisy post-edit data. Although we have data on forecaster variations in our post-edit corpus, these variations have not been observed from different forecasters post-editing the same text. This we could have achieved by performing a pilot before the actual evaluation. For the pilot all the forecasters post-edit the same set of forecasts, thus revealing their individual prefer-ences. Post-edit data from the pilot would have enabled us to factor out the effects of forecaster variation from the real evaluation data. As described above noise in the post-edit data can be reduced by using post-edit tools and by perform-ing a pilot before the real evaluation. This means that post-edit evaluations need preparation in the form of developing post-edit tools and carrying out pilot studies. This is another lesson we learnt from our current evaluation.
Although analyzing the post-edit data was a major en-deavour for us, the overall cost of post-edit evaluation was not much compared to the effort that would have been re-quired to conduct end user experiments on 2728 texts. Of course, this was only true because SUMTIME-MOUSAM texts were being post-edited in any case by Weathernews. The cost-effectiveness of post-edit evaluation is less clear if the evaluators must organize and pay for the post-editing, as Mitkov and An Ha [2003] did. In this context we should speculate that when more and more NLG systems are de-ployed in the real world, post-editing will be accepted as a component in the process of automatic text generation much in the same way post-editing is now a part of MT.
5 Conclusion
Evaluation is a key aspect of NLG; we need to know how well theories and systems work. We have used analysis of post-edits, a popular evaluation technique in machine trans-lation, to evaluate SUMTIME-MOUSAM, an NLG system that generates marine weather forecasts. We encountered some problems, such as the need to identify why post-edits were made which make post-edit data hard to discover spe-cific clues for system improvement. However, post-edit evaluation can reveal problem areas in the system and also quantify system utility for real users.
References
[Bangalore et al., 2000] Srinivas Bangalore, Owen Ram-bow, and Steve Whittaker. 2000. Evaluation metrics for
generation. In Proc. of the First International Natural Language Generation Conference (INLG2000), Israel. [Hutchins and Somers, 1992] John Hutchins and Harold L.
Somers, 1992. An Introduction to Machine Translation, Academic Press.
[Lester and Porter, 1997] James Lester and Bruce Porter. 1997. Developing and empirically evaluating robust explanation generators: The KNIGHT experiments. Computational Linguistics, 23-1:65-103.
[Mellish and Dale, 1998] Chris Mellish and Robert Dale, 1998. Evaluation in the context of natural language gen-eration, Computer Speech and Language 12:349-373. [Mitkov and An Ha, 2003] Ruslan Mitkov and Le An Ha,
2003. Computer-Aided Generation of Multiple-Choice Tests, In Proc. of the HLT-NAACL03 Workshop on Building Educational Applications Using NLP, Edmon-ton, Canada, pp. 17-22.
[Reiter and Dale, 2000] Ehud Reiter and Robert Dale, 2000. Building Natural Language Generation Systems. Cam-bridge University Press.
[Reiter and Sripada, 2002] Ehud Reiter and Somayajulu G. Sripada, 2002. Human Variation and Lexical Choice. Computational Linguistics 28:545-553.
[Reiter et al., 2003] Ehud Reiter, Somayajulu G. Sripada, and Roma Robertson, 2003. Acquiring Correct Knowl-edge for Natural Language Generation. Journal of Artifi-cial Intelligence Research, 18: 491-516, 2003.
[Reiter and Sripada, 2003] Ehud Reiter and Somayajulu G. Sripada, 2003. Learning the Meaning and Usage of Time Phrases from a Parallel Text-Data Corpus. In Proc. of the HLT-NAACL03 Workshop on Learning Word Meaning from Non-Linguistic Data, pp 78-85.
[Sripada et al., 2002] Somayajulu, G. Sripada, Ehud Reiter, Jim Hunter and Jin Yu. 2002 Segmenting Time Series for Weather Forecasting. In: Macintosh, A., Ellis, R. and Coenen, F. (ed) Proc. of ES2002, pp. 193-206.
[Sripada et al., 2003] Somayajulu G. Sripada, Ehud Reiter, and Ian Davy, 2003. SUMTIME-MOUSAM: Configur-able Marine Weather Forecast Generator. Expert Update, 6(3):4-10.
[Su et al., 1992] Keh-Yih Su, Ming-Wen Wu and Jing-Shin Chang, 1992, A new quantitative quality measure for machine translation systems. In Proceedings of COLING-92, Nantes, pp 433-439.
[Wagner, 1998] Simone Wagner, 1998. Small Scale Evalua-tion Methods In: Rita Nübel; Uta Seewald-Heeg (eds.): Evaluation of the Linguistic Performance of Machine Translation Systems. Proc. of the Workshop at the KONVENS-98. Bonn, pp 93-105.