Improvements in Automatic Thesaurus Extraction
James R. Curran and Marc Moens
Institute for Communicating and Collaborative Systems University of Edinburgh
2 Buccleuch Place, Edinburgh EH8 9LW United Kingdom
jamesc,marc @cogsci.ed.ac.uk
Abstract
The use of semantic resources is
com-mon in modernNLPsystems, but methods
to extract lexical semantics have only re-cently begun to perform well enough for practical use. We evaluate existing and new similarity metrics for thesaurus ex-traction, and experiment with the trade-off between extraction performance and efficiency. We propose an approximation
algorithm, based on canonical attributes
and coarse- and fine-grained matching, that reduces the time complexity and ex-ecution time of thesaurus extraction with only a marginal performance penalty.
1 Introduction
Thesauri have traditionally been used in information retrieval tasks to expand words in queries with syn-onymous terms (e.g. Ruge, (1997)). Since the de-velopment of WordNet (Fellbaum, 1998) and large electronic thesauri, information from semantic
re-sources is regularly leveraged to solve NLP
prob-lems. These tasks include collocation discovery (Pearce, 2001), smoothing and model estimation (Brown et al., 1992; Clark and Weir, 2001) and text classification (Baker and McCallum, 1998).
Unfortunately, thesauri are expensive and time-consuming to create manually, and tend to suffer from problems of bias, inconsistency, and limited coverage. In addition, thesaurus compilers cannot keep up with constantly evolving language use and cannot afford to build new thesauri for the many
sub-domains that NLP techniques are being applied to.
There is a clear need for methods to extract thesauri automatically or tools that assist in the manual cre-ation and updating of these semantic resources.
Much of the existing work on thesaurus extraction and word clustering is based on the observation that
related terms will appear insimilarcontexts. These
systems differ primarily in their definition of “con-text” and the way they calculate similarity from the contexts each term appears in.
Most systems extract co-occurrence and syntactic information from the words surrounding the target term, which is then converted into a vector-space representation of the contexts that each target term appears in (Pereira et al., 1993; Ruge, 1997; Lin, 1998b). Other systems take the whole document as the context and consider term co-occurrence at the document level (Crouch, 1988; Sanderson and Croft, 1999). Once these contexts have been de-fined, these systems then use clustering or nearest neighbour methods to find similar terms.
Alternatively, some systems are based on the
ob-servation that related terms appeartogether in
par-ticular contexts. These systems extract related terms
directly by recognising linguistic patterns (e.g. X, Y
and other Zs) which link synonyms and hyponyms (Hearst, 1992; Caraballo, 1999).
Our previous work (Curran and Moens, 2002) has evaluated thesaurus extraction performance and effi-ciency using several different context models. In this paper, we evaluate some existing similarity metrics and propose and motivate a new metric which out-performs the existing metrics. We also present an approximation algorithm that bounds the time com-plexity of pairwise thesaurus extraction. This re-sults in a significant reduction in runtime with only a marginal performance penalty in our experiments.
2 Automatic Thesaurus Extraction
Vector-space thesaurus extraction systems can be separated into two components. The first compo-nent extracts the contexts from raw text and com-piles them into a statistical description of the con-texts each potential thesaurus term appears in. Some systems define the context as a window of words surrounding each thesaurus term (McDonald, 2000). Many systems extract grammatical relations using either a broad coverage parser (Lin, 1998a) or shal-low statistical tools (Grefenstette, 1994; Curran and Moens, 2002). Our experiments use a shallow rela-tion extractor based on (Grefenstette, 1994).
We define a context relation instance as a tuple
(w,r,w0) wherewis the thesaurus term, which
oc-curs in some grammatical relation r with another
wordw0in the sentence. We refer to the tuple(r,w0)
as an attribute of w. For example, the tuple(dog,
direct-obj, walk)indicates that the termdogwas
the direct object of the verbwalk.
Our relation extractor begins with a Na¨ıve Bayes
POS tagger and chunker. After the raw text has
been tagged and chunked, noun phrases separated by prepositions and conjunctions are concatenated, and the relation extracting algorithm is run over each sentence. This consists of four passes over the sen-tence, associating each noun with the modifiers and verbs from the syntactic contexts they appear in:
1. nouns with pre-modifiers (left to right) 2. nouns with post-modifiers (right to left) 3. verbs with subjects/objects (right to left) 4. verbs with subjects/objects (left to right)
This results in tuples representing the contexts:
1. term is the subject of a verb
2. term is the (direct/indirect) object of a verb 3. term is modified by a noun or adjective 4. term is modified by a prepositional phrase
The relation tuple is then converted to root form using the Sussex morphological analyser (Minnen
et al., 2000) and the POS tags are removed. The
relations for each term are collected together and counted, producing a context vector of attributes and
(adjective, good) 2005 (adjective, faintest) 89 (direct-obj, have) 1836 (indirect-obj, toy) 74 (adjective, preconceived) 42 (adjective, foggiest) 15
Figure 1: Example attributes of the nounidea
their frequencies in the corpus. Figure 1 shows some
example attributes foridea.
The second system component performs nearest-neighbour or cluster analysis to determine which terms are similar based on their context vectors. Both methods require a function that calculates the similarity between context vectors. For experimen-tal analysis we have decomposed this function into
measure and weight functions. Themeasure func-tion calculates the similarity between two weighted
context vectors and theweightfunction calculates a
weight from the raw frequency information for each context relation. The primary experiments in this paper evaluate the performance of various existing and new measure and weight functions, which are described in the next section.
The simplest algorithm for thesaurus extraction is nearest-neighbour comparison, which involves pair-wise vector comparison of the target with every
ex-tracted term. Givenn terms and up to mattributes
for each term, the asymptotic time complexity of
nearest-neighbour thesaurus extraction is O(n2m).
This is very expensive with even a moderate vocab-ulary and small attribute vectors. The number of terms can be reduced by introducing a minimum cut-off that ignores potential synonyms with a frequency less than the cutoff, which for our experiments was 5. Section 5 reports on the trade-off between the minimum cutoff and execution time.
3 Experiments
Early experiments in thesaurus extraction (Grefen-stette, 1994) suffered from the limited size of avail-able corpora, but more recent experiments have used much larger corpora with greater success (Lin, 1998a). For these experiments we ran our relation
extractor over the British National Corpus (BNC)
consisting of 114 million words in 6.2 million
sen-tences. The POS tagging and chunking took 159
addi-SETCOSINE |(wm,∗,∗)∩(wn,∗,∗)|
√
|(wm,∗,∗)|×|(wn,∗,∗)|
COSINE
P
(r,w0)wgt(wm,∗r,∗w0)×wgt(wn,∗r,∗w0)
√Pwgt(w
m,∗,∗)2×Pwgt(wn,∗,∗)2
SETDICE 2|(wm,∗,∗)∩(wn,∗,∗)|
|(wm,∗,∗)|+|(wn,∗,∗)|
DICE
P
(r,w0)wgt(wm,∗r,∗w0)×wgt(wn,∗r,∗w0)
P
(r,w0)wgt(wm,∗r,∗w0)+wgt(wn,∗r,∗w0)
DICE† 2
P
(r,w0)min(wgt(wm,∗r,∗w0),wgt(wn,∗r,∗w0))
P
(r,w0)wgt(wm,∗r,∗w0)+wgt(wn,∗r,∗w0) SETJACCARD |(wm,∗,∗)∩(wn,∗,∗)|
|(wm,∗,∗)∪(wn,∗,∗)|
JACCARD
P
(r,w0)min(wgt(wm,∗r,∗w0),wgt(wn,∗r,∗w0))
P
(r,w0)max(wgt(wm,∗r,∗w0),wgt(wn,∗r,∗w0)) JACCARD†
P
(r,w0)wgt(wm,∗r,∗w0)×wgt(wn,∗r,∗w0)
P
(r,w0)wgt(wm,∗r,∗w0)+wgt(wn,∗r,∗w0)
LIN
P
(r,w0P)wgt(wm,∗r,∗w0)+wgt(wn,∗r,∗w0)
[image:3.612.76.293.82.272.2]wgt(wm,∗,∗)+Pwgt(wn,∗,∗)
Table 1: Measure functions evaluated
tional7.5minutes. The resultant representation
con-tained a total of 28 million relation occurrences over 10 million different relations.
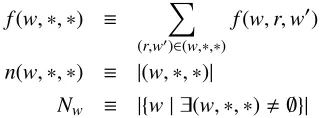
We describe the functions evaluated in these ex-periments using an extension of the asterisk notation used by Lin (1998a), where an asterisk indicates a set ranging over all existing values of that variable.
For example, the set of attributes of the termwis:
(w,∗,∗)≡ {(r,w0)| ∃(w,r,w0)}
For convenience, we further extend the notation for weighted attribute vectors. A subscripted asterisk indicates that the variables are bound together:
X
(r,w0)
wgt(wm,∗r,∗w0)×wgt(wn,∗r,∗w0)
which is a notational abbreviation of:
X
(r,w0)∈(wm,∗,∗)∩(wn,∗,∗)
wgt(wm,r,w0)×wgt(wn,r,w0)
For weight functions we use similar notation:
f(w,∗,∗) ≡
X
(r,w0)∈(w,∗,∗)
f(w,r,w0)
n(w,∗,∗) ≡ |(w,∗,∗)|
Nw ≡ |{w| ∃(w,∗,∗),∅}|
Table 1 defines the measure functions evaluated in these experiments. The simplest measure
func-tions (prefix SET) use the attribute set model from
IDENTITY 1.0
CHI2 cf. Manning and Sch¨utze (1999)
LR cf. Manning and Sch¨utze (1999)
LIN98A log(ff((w,r,w∗,r,w00))ff((w,r,∗,r,∗∗)))
LIN98B −log(n(∗N,r,ww 0))
DICE p(w,2∗p(w,r,w0)
,∗)+p(∗,r,w0)
GREF94 log2(f(w,r,w0)+1)
log2(n(∗,r,w0)+1)
MI log(p(w,p∗(,w,r,w∗)p(∗0,r,w) 0)) TTEST p(w,r,w0)−p(∗,r,w0)p(w,∗,∗)
√p(
[image:3.612.322.525.84.253.2]∗,r,w0)p(w,∗,∗)
Table 2: Weight functions evaluated
IRand are taken from Manning and Sch¨utze (1999),
pp. 299. When these are used with weighted at-tributes, if the weight is greater than zero, then it is
considered in the set. Other measures, such as LIN
and JACCARD have previously been used for
the-saurus extraction (Lin, 1998a; Grefenstette, 1994). Finally, we have generalised some set measures us-ing similar reasonus-ing to Grefenstette (1994). Alter-native generalisations are marked with a dagger.
These experiments also cover a range of weight functions as defined in Table 2. The weight
func-tions LIN98A, LIN98B, and GREF94 are taken
from existing systems (Lin, 1998a; Lin, 1998b; Grefenstette, 1994). Our proposed weight func-tions are motivated by our intuition that highly pre-dictive attributes are strong collocations with their terms. Thus, we have implemented many of the
statistics described in the Collocations chapter of
Manning and Sch¨utze (1999), including the T-Test,
χ2-Test, Likelihood Ratio, and Mutual
Informa-tion. Some functions (suffix LOG) have an extra
log2(f(w,r,w0)+1)factor to promote the influence of higher frequency attributes.
4 Evaluation
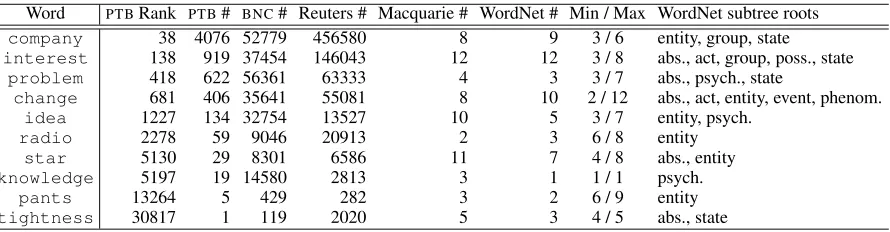
[image:3.612.105.266.614.673.2]Word PTBRank PTB# BNC# Reuters # Macquarie # WordNet # Min / Max WordNet subtree roots
company 38 4076 52779 456580 8 9 3 / 6 entity, group, state
interest 138 919 37454 146043 12 12 3 / 8 abs., act, group, poss., state
problem 418 622 56361 63333 4 3 3 / 7 abs., psych., state
change 681 406 35641 55081 8 10 2 / 12 abs., act, entity, event, phenom.
idea 1227 134 32754 13527 10 5 3 / 7 entity, psych.
radio 2278 59 9046 20913 2 3 6 / 8 entity
star 5130 29 8301 6586 11 7 4 / 8 abs., entity
knowledge 5197 19 14580 2813 3 1 1 / 1 psych.
pants 13264 5 429 282 3 2 6 / 9 entity
[image:4.612.86.531.70.186.2]tightness 30817 1 119 2020 5 3 4 / 5 abs., state
Table 3: Examples of the 70 thesaurus evaluation terms
frequency Penn Treebank andBNCfrequencies; number of senses WordNet and Macquarie senses;
specificity depth in the WordNet hierarchy;
concreteness distribution across WordNet subtrees.
Table 3 lists some example terms with frequency
and frequency rank data from the PTB, BNC and
REUTERS, as well as the number of senses in
Word-Net and Macquarie, and their maximum and mini-mum depth in the WordNet hierarchy. For each term we extracted a thesaurus entry with 200 potential synonyms and their similarity scores.
The simplest method of evaluation is direct com-parison of the extracted thesaurus with a manually-created gold standard (Grefenstette, 1994). How-ever, on small corpora, rare direct matches provide limited information for evaluation, and thesaurus coverage is a problem. Our evaluation uses a com-bination of three electronic thesauri: the Macquarie (Bernard, 1990), Roget’s (Roget, 1911) and Moby (Ward, 1996) thesauri. Roget’s and Macquarie are topic ordered and the Moby thesaurus is head or-dered. As the extracted thesauri do not distinguish between senses, we transform Roget’s and Mac-quarie into head ordered format by conflating the sense sets containing each term. For the 70 terms we create a gold standard from the union of the syn-onyms from the three thesauri.
With this gold standard in place, it is possible to use precision and recall measures to evaluate the quality of the extracted thesaurus. To help overcome the problems of direct comparisons we use several measures of system performance: direct matches (DIRECT), inverse rank (INVR), and precision of the
topnsynonyms (P(n)), forn=1, 5 and 10.
Measure DIRECT P(1) P(5) P(10) INVR
SETCOSINE 1276 14% 15% 15% 0.76
SETDICE 1496 63% 44% 34% 1.69
SETJACCARD 1458 59% 43% 34% 1.63
COSINE 1276 14% 15% 15% 0.76
DICE 1536 19% 20% 20% 0.97
DICE† 1916 76% 52% 45% 2.10
JACCARD 1916 76% 52% 45% 2.10
JACCARD† 1745 40% 30% 28% 1.36
LIN 1826 60% 46% 40% 1.85
Table 4: Evaluation of measure functions
INVR is the sum of the inverse rank of each
matching synonym, e.g. matching synonyms at ranks 3, 5 and 28 give an inverse rank score of
1
3+15+281, and with at most 200 synonyms, the
max-imum INVR score is 5.878. Precision of the topnis
the percentage of matching synonyms in the top n
extracted synonyms. There are a total of 23207 syn-onyms for the 70 terms in the gold standard. Each measure is averaged over the extracted synonym lists for all 70 thesaurus terms.
5 Results
For computational practicality, we assume that the performance behaviour of measure and weight func-tions are independent of each other. Therefore, we
have evaluated the weight functions using the JAC
-CARDmeasure, and evaluated the measure functions
using the TTEST weight because they produced the
best results in our previous experiments.
Table 4 presents the results of evaluating the sure functions. The best performance across all
mea-sures was shared by JACCARD and DICE†, which
produced identical results for the 70 words. DICE†
is easier to compute and is thus the preferred mea-sure function.
Weight DIRECT P(1) P(5) P(10) INVR CHI2 1623 33% 27% 26% 1.24
DICE 1480 61% 45% 34% 1.70
DICELOG 1498 67% 45% 35% 1.73 GREF94 1258 54% 38% 29% 1.46
IDENTITY 1228 46% 34% 29% 1.33
[image:5.612.315.537.69.216.2]LR 1510 53% 39% 32% 1.58 LIN98A 1735 73% 50% 42% 1.96 LIN98B 1271 47% 34% 30% 1.37 MI 1736 66% 49% 42% 1.92 MILOG 1841 71% 52% 43% 2.05 TTEST 1916 76% 52% 45% 2.10 TTESTLOG 1865 70% 49% 41% 1.99
Table 5: Evaluation of bounded weight functions
Weight DIRECT P(1) P(5) P(10) INVR MI± 1511 59% 44% 39% 1.74
MILOG± 1566 61% 46% 41% 1.84
TTEST± 1670 67% 50% 43% 1.96
TTESTLOG± 1532 63% 50% 42% 1.89
Table 6: Evaluation of unbounded weight functions
weight functions. Here TTEST significantly
outper-formed the other weight functions, which supports our intuition that good context descriptors are also strong collocates of the term. Surprisingly, the other collocation discovery functions did not perform as
well, even though TTEST is not the most favoured
for collocation discovery because of its behaviour at low frequency counts.
One difficulty with weight functions involving logarithms or differences is that they can be nega-tive. The results in Table 6 show that weight func-tions that are not bounded below by zero do not per-form as well on thesaurus extraction. However, un-bounded weights do produce interesting and unex-pected results: they tend to return misspellings of the term and synonyms, abbreviations and lower
fre-quency synonyms. For instance, TTEST± returned
Co, Co. and PLC for company, but they do not
ap-pear in the synonyms extracted with TTEST. The
unbounded weights also extracted more hyponyms,
such as corporation names for company,
includ-ing Kodak and Exxon. Finally unbounded weights
tended to promote the rankings of synonyms from minority senses because the frequent senses are
de-moted by negative weights. For example, TTEST±
returned writings, painting, fieldwork, essay
and masterpiece as the best synonyms for work,
whereas TTEST returned study, research, job,
activityandlife.
0 25 50 75 100 125 150 175 200 Minimum Frequency Cutoff
1600 1700 1800 1900 2000
Direct Matches
TTest matches Lin98b matches
500 1000 1500 2000 2500 3000
Run Time (seconds)
[image:5.612.83.287.70.205.2]TTest time Lin98b time
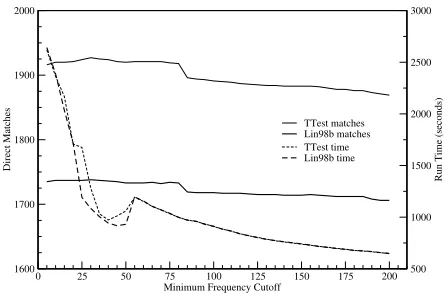
Figure 2: Performance against minimum cutoff
Introducing a minimum cutoff that ignores low frequency potential synonyms can eliminate many unnecessary comparisons. Figure 2 presents both the performance of the system using direct match evaluation (left axis) and execution times (right axis) for increasing cutoffs. This test was performed using JACCARDand the TTESTand LIN98Aweight
func-tions. The first feature of note is that as we increase the minimum cutoff to 30, the direct match results
improve for TTEST, which is probably a result of
the TTEST weakness on low frequency counts.
Ini-tially, the execution time is rapidly reduced by small increments of the minimum cutoff. This is because Zipf’s law applies to relations, and so by small incre-ments of the cutoff we eliminate many terms from the tail of the distribution. There are only 29,737 terms when the cutoff is 30; 88,926 terms when the cutoff is 5; and 246,067 without a cutoff, and
be-cause the extraction algorithm is O(n2m), this
re-sults in significant efficiency gains. Since extracting only 70 thesaurus terms takes about 43 minutes with a minimum cutoff of 5, the efficiency/performance trade-off is particularly important from the perspec-tive of implementing a practical extraction system.
6 Efficiency
[image:5.612.80.288.236.292.2]Curran and Moens (2002)), which would increase both number of attributes for each term and the total number of terms above the minimum cutoff, this is not nearly fast enough. The problem is that the time complexity of thesaurus extraction is not practically scalable to significantly larger corpora.
Although the minimum cutoff helps by
reduc-ingn to a reasonably small value, it does not
con-strain m in any way. In fact, using a cutoff
in-creases the average value ofmacross the terms
be-cause it removes low frequency terms with few
at-tributes. For instance, the frequent company
ap-pears in 11360 grammatical relations, with a total frequency of 69240 occurrences, whereas the
infre-quentpantsappears in only 401 relations with a
to-tal frequency of 655 occurrences.
The problem is that for every comparison, the al-gorithm must examine the length of both attribute vectors. Grefenstette (1994) uses bit signatures to test for shared attributes, but because of the high fre-quency of the most common attributes, this does not skip many comparisons. Our system keeps track of the sum of the remaining vector which is a signifi-cant optimisation, but comes at the cost of increased representation size. However, what is needed is some algorithmic reduction that bounds the number
of fullO(m)vector comparisons performed.
7 Approximation Algorithm
One way of bounding the complexity is to perform an approximate comparison first. If the approxima-tion returns a positive result, then the algorithm per-forms the full comparison. We can do this by
in-troducing another, much shorter vector of
canoni-cal attributes, with a bounded length k. If our
ap-proximate comparison returns at most ppositive
re-sults for each term, then the time complexity be-comes O(n2k
+npm), which, sincekis constant, is
O(n2
+npm). So as long as we find an
approxima-tion funcapproxima-tion and vector such thatpn, the system
will run much faster and be much more scalable in
m, the number of attributes. However, p n
im-plies that we are discarding a very large number of potential matches and so there will be a performance penalty. This trade-off is governed by the number of the canonical attributes and how representative they are of the full attribute vector, and thus the term
it-(adjective, smarty) 3 0.0524 (direct-obj, pee) 3 0.0443 (noun-mod, loon) 5 0.0437 (direct-obj, wet) 14 0.0370 (direct-obj, scare) 10 0.0263 (adjective, jogging) 5 0.0246 (indirect-obj, piss) 4 0.0215 (noun-mod, ski) 14 0.0201
Figure 3: The top weighted attributes ofpants
(direct-obj, wet) 14 0.0370 (direct-obj, scare) 10 0.0263 (direct-obj, wear) 17 0.0071 (direct-obj, keep) 7 0.0016 (direct-obj, get) 5 0.0004
Figure 4: Canonical attributes forpants
self. It is also dependent on the functions used to compare the canonical attribute vectors.
The canonical vector must contain attributes that best describe the thesaurus term in a bounded
num-ber of entries. The obvious first choice is the
most strongly weighted attributes from the full vec-tor. Figure 3 shows some of the most strongly
weighted attributes forpantswith their frequencies
and weights. However, these attributes, although
strongly correlated withpants, are in fact too
spe-cific and idiomatic to be a good summary, because there are very few other words with similar
canoni-cal attributes. For example,(adjective, smarty)
only appears with two other terms (bunandnumber)
in the entire corpus. The heuristic is so aggressive that too few positive approximate matches result.
To alleviate this problem we filter the attributes so
that only strongly weighted subject, direct-obj
and indirect-obj relations are included in the
canonical vectors. This is because in general they constrain the terms more and partake in fewer id-iomatic collocations with the terms. So the gen-eral principle is the most descriptive verb relations constrain the search for possible synonyms, and the other modifiers provide finer grain distinctions used to rank possible synonyms. Figure 4 shows the
5 canonical attributes for pants. This canonical
vector is a better general description of the term
pants, since similar terms are likely to appear as
the direct object of wear, even though it still
con-tains the idiomatic attributes (direct-obj, wet)
and(direct-obj, scare).
at-Word DIRECT BIG/MAX P(1) P(5) P(10) INVR BIG/MAX
company 27 110 / 355 100 % 80 % 60 % 2.60 2.71 / 6.45
interest 64 232 / 730 100 % 80 % 70 % 3.19 3.45 / 7.17
problem 25 82 / 250 100 % 60 % 50 % 2.46 2.52 / 6.10
change 31 104 / 544 100 % 60 % 40 % 2.35 2.44 / 6.88
idea 59 170 / 434 100 % 100 % 80 % 3.67 3.87 / 6.65
radio 19 45 / 177 100 % 60 % 60 % 2.31 2.35 / 5.76
star 31 141 / 569 100 % 60 % 60 % 2.36 2.49 / 6.92
knowledge 26 56 / 151 100 % 80 % 70 % 2.50 2.55 / 5.60
pants 12 13 / 222 100 % 80 % 50 % 2.40 2.40 / 5.98
[image:7.612.317.535.235.381.2]tightness 3 3 / 152 0 % 0 % 0 % 0.03 0.03 / 5.60 Average (over 70) 26 86 / 332 76 % 52 % 44 % 2.08 2.17 / 6.13
Table 7: Example performance using techniques described in this paper
tributes like (direct-obj, get) are not
informa-tive. We know this because(direct-obj, get)
ap-pears with 8769 different terms, which means the algorithm may perform a large number of
unnec-essary full comparisons since (direct-obj, get)
could be a canonical attribute for many terms. To avoid this problem, we apply a maximum cutoff on the number of terms the attribute appears with.
With limited experimentation, we have found that
TTESTLOGis the best weight function for selecting
canonical attributes. This may be because the extra
log2(f(w,r,w0)+1) factor encodes the desired bias towards relatively frequent canonical attributes. If a canonical attribute is shared by the two terms, then our algorithm performs the full comparison.
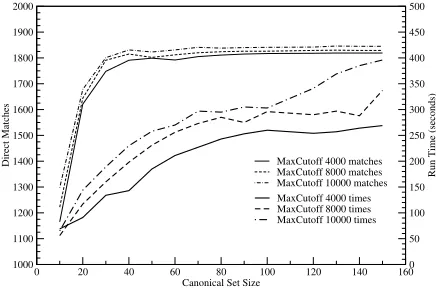
Figure 5 shows system performance and speed, as canonical vector size is increased, with the maxi-mum cutoff at 4000, 8000, and 10,000. As an exam-ple, with a maximum cutoff of 10,000 and a
canoni-cal vector size of 70, the total DIRECTscore of 1841
represents a 3.9% performance penalty over full ex-traction, for an 89% reduction in execution time. Ta-ble 7 presents the example term results using the
techniques we have described: JACCARD measure
and TTESTweight functions; minimum cutoff of 30;
and approximation algorithm with canonical vector
size of 100 with TTESTLOG weighting. The BIG
columns show the previous measure results if we
re-turned 10,000 synonyms, andMAXgives the results
for a comparison of the gold standard against itself.
8 Conclusion
In these experiments we have proposed new mea-sure and weight functions that, as our evaluation has shown, significantly outperform existing similarity
0 20 40 60 80 100 120 140 160 Canonical Set Size
1000 1100 1200 1300 1400 1500 1600 1700 1800 1900 2000
Direct Matches MaxCutoff 4000 matches MaxCutoff 8000 matches MaxCutoff 10000 matches
0 50 100 150 200 250 300 350 400 450 500
Run Time (seconds)
MaxCutoff 4000 times MaxCutoff 8000 times MaxCutoff 10000 times
Figure 5: Performance against canonical set size
functions. The list of measure and weight functions we compared against is not complete, and we hope to add other functions to provide a general frame-work for thesaurus extraction experimentation. We would also like to expand our evaluation to include direct methods used by others (Lin, 1998a) and us-ing the extracted thesaurus in NLP tasks.
We have also investigated the speed/performance trade-off using frequency cutoffs. This has lead to the proposal of a new approximate comparison
algo-rithm based oncanonical attributesand a process of
Acknowledgements
We would like to thank Stephen Clark, Caroline Sporleder, Tara Murphy and the anonymous review-ers for their comments on drafts of this paper. This research is supported by Commonwealth and Syd-ney University Travelling scholarships.
References
L. Douglas Baker and Andrew McCallum. 1998. Distri-butional clustering of words for text classification. In
Proceedings of the 21st annual international ACM SI-GIR conference on Research and Development in In-formation Retrieval, pages 96–103, Melbourne, Aus-tralia, 24–28 August.
John R. L. Bernard, editor. 1990. The Macquarie Ency-clopedic Thesaurus. The Macquarie Library, Sydney, Australia.
Peter F. Brown, Vincent J. Della Pietra, Peter V. deSouza, Jennifer C. Lai, and Robert L. Mercer. 1992. Class-based n-gram models of natural language. Computa-tional Linguistics, 18(4):467–479, December.
Sharon A. Caraballo. 1999. Automatic construction of a hypernym-labeled noun hierarchy from text. In Pro-ceedings of the 37th annual meeting of the Association for Computational Linguistics, pages 120–126, Col-lege Park, MD USA, 20–26 June.
Stephen Clark and David Weir. 2001. Class-based prob-ability estimation using a semantic hierarchy. In Pro-ceedings of the Second Meeting of the North American Chapter of the Association for Computational Linguis-tics, pages 95–102, Pittsburgh, PA USA, 2–7 June.
Carolyn J. Crouch. 1988. Construction of a dynamic the-saurus and its use for associated information retrieval. In Proceedings of the eleventh international confer-ence on Research and Development in Information Re-trieval, pages 309–320, Grenoble, France, 13–15 June.
James R. Curran and Marc Moens. 2002. Scaling con-text space. In Proceedings of the 40th annual meet-ing of the Association for Computational Lmeet-inguistics, Philadelphia, PA USA, 7–12 July. (to appear).
Cristiane Fellbaum, editor. 1998. WordNet: an elec-tronic lexical database. The MIT Press, Cambridge, MA USA.
Gregory Grefenstette. 1994. Explorations in Automatic Thesaurus Discovery. Kluwer Academic Publishers, Boston, USA.
Marti A. Hearst. 1992. Automatic acquisition of hy-ponyms from large text corpora. InProceedings of the 14th international conference on Computational Lin-guistics, pages 539–545, Nantes, France, 23–28 July.
Dekang Lin. 1998a. Automatic retrieval and cluster-ing of similar words. InProceedings of the 17th In-ternational Conference on Computational Linguistics and of the 36th Annual Meeting of the Association for Computational Linguistics, pages 768–774, Montr´eal, Qu´ebec, Canada, 10–14 August.
Dekang Lin. 1998b. An information-theoretic definition of similarity. InProceedings of the Fifteen Interna-tional Conference on Machine Learning, pages 296– 304, Madison, WI USA, 24–27 July.
Christopher D. Manning and Hinrich Sch¨utze. 1999.
Foundations of Statistical Natural Language Process-ing. MIT Press, Cambridge, MA USA.
Scott McDonald. 2000. Environmental determinants of lexical processing effort. Ph.D. thesis, University of Edinburgh.
Guido Minnen, John Carroll, and Darren Pearce. 2000. Robust applied morphological generation. InIn Pro-ceedings of the First International Natural Language Generation Conference, pages 201–208, 12–16 June.
Darren Pearce. 2001. Synonymy in collocation extrac-tion. In Workshop on WordNet and Other Lexical Resources: Applications, Extensions and Customiza-tions, (NAACL 2001), pages 41–46, Pittsburgh, PA USA, 2–7 June.
Fernando Pereira, Naftali Tishby, and Lillian Lee. 1993. Distributional clustering of English words. In Pro-ceedings of the 31st annual meeting of the Associ-ation for ComputAssoci-ational Linguistics, pages 183–190, Columbus, Ohio USA, 22–26 June.
Peter Roget. 1911. Thesaurus of English words and phrases. Longmans, Green and Co., London, UK.
Gerda Ruge. 1997. Automatic detection of thesaurus re-lations for information retrieval applications. In Foundations of Computer Science: Potential Theory -Cognition, Lecture Notes in Computer Science, vol-ume LNCS 1337, pages 499–506. Springer Verlag, Berlin, Germany.
Mark Sanderson and Bruce Croft. 1999. Deriving con-cept hierarchies from text. In Proceedings of the 22nd annual international ACM SIGIR conference on Research and Development in Information Retrieval, pages 206–213, Berkeley, CA USA, 15–19 August.