| INVESTIGATION
Inference of the Distribution of Selection Coef
fi
cients
for New Nonsynonymous Mutations Using
Large Samples
Bernard Y. Kim,* Christian D. Huber,* and Kirk E. Lohmueller*,†,‡,1 *Department of Ecology and Evolutionary Biology,†Interdepartmental Program in Bioinformatics, and‡Department of Human Genetics, David Geffen School of Medicine, University of California, Los Angeles, California 90095
ABSTRACTThe distribution offitness effects (DFE) has considerable importance in population genetics. To date, estimates of the DFE come from studies using a small number of individuals. Thus, estimates of the proportion of moderately to strongly deleterious new mutations may be unreliable because such variants are unlikely to be segregating in the data. Additionally, the true functional form of
the DFE is unknown, and estimates of the DFE differ significantly between studies. Here we present aflexible and computationally
tractable method, called Fit@a@i, to estimate the DFE of new mutations using the site frequency spectrum from a large number of
individuals. We apply our approach to the frequency spectrum of 1300 Europeans from the Exome Sequencing Project ESP6400 data set, 1298 Danes from the LuCamp data set, and 432 Europeans from the 1000 Genomes Project to estimate the DFE of deleterious
nonsynonymous mutations. We infer significantly fewer (0.38–0.84 fold) strongly deleterious mutations with selection coefficient
|s|. 0.01 and more (1.24–1.43 fold) weakly deleterious mutations with selection coefficient |s| , 0.001 compared to previous
estimates. Furthermore, a DFE that is a mixture distribution of a point mass at neutrality plus a gamma distribution fits better than
a gamma distribution in two of the three data sets. Our results suggest that nearly neutral forces play a larger role in human evolution than previously thought.
KEYWORDSdeleterious mutations; diffusion theory; population genetics; site frequency spectrum
A
fundamental concept in population genetics is the dis-tribution offitness effects (DFE) of new mutations. The DFE refers to the proportion of new mutations that have particular effects onfitness. The DFE is a crucial quantity in evolutionary genetics because it determines how selection affects genetic variation (Eyre-Walker and Keightley 2007), the conditions under which recombination could evolve (Keightley and Otto 2006), and the spectrum of mutations potentially involved in genetic diseases (Eyre-Walker 2010). Further, an accurate DFE is required for robust inference of the amount of adaptive evolution across taxa (Boykoet al.2008; Gossmannet al.2012; Castellanoet al.2016; Galtier 2016); a topic of widespread interest. Because this distribu-tion is so important, considerable effort has been put forth toward estimating it in several species.
In organisms that allow experimental manipulation, the DFE can be directly estimated. Here, the DFE is either derived from direct measurements of fitness from a collection of single-step mutants, or indirectly inferred from observed changes in population fitness in mutation accumulation (MA) experiments (Eyre-Walker and Keightley 2007; Bataillon and Bailey 2014). Thefirst approach, in combina-tion with high-throughput methods, has been successfully applied to examine the full spectrum of (even weak) selection coefficients of mutations in small mutational target regions in a number of viral, bacterial, and yeast systems (Fowler
et al.2010; Hietpaset al.2011; Boucheret al.2014). They
frequently report a gamma or unimodal, similarly shaped distribution of fitness effects (Bataillon and Bailey 2014), or a bimodal distribution with a second cluster of highly del-eterious mutations (Acevedo et al.2014; Banket al.2014; Copyright © 2017 by the Genetics Society of America
doi:https://doi.org/10.1534/genetics.116.197145
Manuscript received October 23, 2016; accepted for publication February 14, 2017; published Early Online February 27, 2017.
Available freely online through the author-supported open access option.
Supplemental material is available online atwww.genetics.org/lookup/suppl/doi:10. 1534/genetics.116.197145/-/DC1.
Boucher et al. 2014). The second approach infers the DFE from fitness trajectories of a collection of populations over time in MA experiments, without directly identifying the mu-tations involved. Assuming that the true DFE is gamma dis-tributed, they estimate the parameters of a gamma DFE that bestfit to the observed changes in the mean and variance of
fitness among replicate populations (Halligan and Keightley 2009). These studies point to a shape of the DFE that is less leptokurtic than an exponential distribution, with the mode different from zero. This could indicate that the true under-lying DFE is more complex than the gamma distribution (Halligan and Keightley 2009), or reflect a bias of MA-based methods toward mutations with largefitness effects (Eyre-Walker and Keightley 2007). In summary, experimental estimates of the DFE suggest that a substantial proportion of new mutations are strongly deleterious. However, due to the inherent limitations of these methods, inference of the exact functional form of the genome-wide DFE is challenging.
A second category of methods to infer the DFE involves examining patterns of neutral and putatively deleterious ge-netic variation in natural populations, andfinding the model of demographic history and purifying selection that can match the observed level of variation. This framework has been applied to many species including humans (Eyre-Walker
et al. 2006; Keightley and Eyre-Walker 2007; Boyko et al.
2008; Liet al.2010),Drosophila(Keightley and Eyre-Walker 2007; Kousathanas and Keightley 2013), yeast (Koufopanou
et al.2015), orangutans (Maet al.2013), gorillas (McManus
et al.2015), and mice (Halliganet al.2013). Many of these
studies suggest that the DFE has a strongly leptokurtic distri-bution, conflicting with the MA-based estimates. Consistent with the bimodal DFE found by many site-directed mutagen-esis studies (Bataillon and Bailey 2014; Boucheret al.2014), theyfind a large proportion of nearly neutral mutations, as well as many strongly deleterious mutations. For example, previous studies in humans (Eyre-Walkeret al.2006; Boyko
et al.2008) have estimated the parameters of a gamma
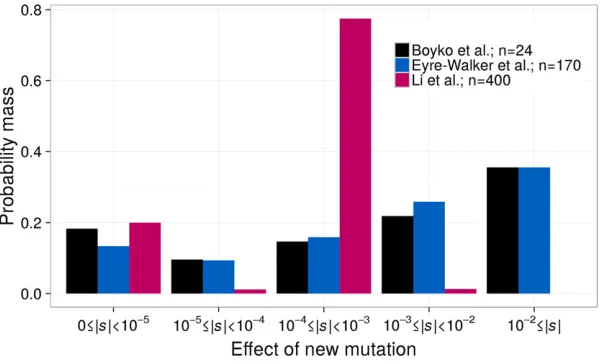
dis-tribution for the DFE of new nonsynonymous mutations. These studies have found57–61% of new nonsynonymous mutations to be moderately to strongly deleterious (|s|$1023), about 15–16% to be weakly deleterious (1024#|s|,1023), and the remainder (24–28%) to be nearly neutral (Figure 1).
The estimates of the DFE from genetic variation data for humans by Eyre-Walkeret al.(2006) and Boykoet al.(2008) have been widely used in human population genetic studies. For example, these DFEs were used to estimate differences in the genetic load across human populations (Henn et al. 2016), to model the ancient introgression of Neanderthal alleles into humans (Harris and Nielsen 2016), as a model for the frequency spectrum of deleterious polymorphisms in simulating data for disease studies (Uricchioet al.2016), to evaluate the contribution of background selection to diversity on theYchromosome in humans (Wilson Sayreset al.2014), and to estimate the strength of selection acting on disease genes (Moon and Akey 2016). While the Boykoet al.(2008)
study has had considerable impact in thefield, it is important to appreciate that the estimates of the DFE were made using a sample of a small number of individuals. As such, most of the variation segregating in those samples is likely to be neutral or nearly neutral. Inferences about the proportion of moder-ately and strongly deleterious mutations largely come from assuming the gamma distribution approximates the DFE of new mutations well, and then tabulating the proportion in those categories predicted by the gamma distribution. In other words, the second mode of strongly deleterious and lethal mutations observed by experimental studies is un-likely to be directly observed in polymorphism data sets, and these proportions are extrapolated from the long tail of the DFE.
This extrapolation of the proportion of strongly deleterious mutations may not be accurate. A more recent study using exome sequencing data from 200 Danish individuals (Liet al. 2010) estimated a DFE that differs considerably from that inferred in Boyko et al. (2008) or from the experimental estimates in lower organisms. Specifically, Liet al.(2010) found a mixture distribution consisting of a neutral point mass and gamma distributionfit best to their data (Figure 1). Additionally, they estimated that only 1% of new mutations have |s|.1024(compared to 57% in Boykoet al.2008), and 78% of new mutations fall in the 1024#|s|,1023range (compared to 15% in Boykoet al.2008). Liet al.(2010) attrib-uted this difference in the DFEs to their study considering a larger sample of individuals. As such, they surmised that they sampled more weakly deleterious variants, allowing more ac-curate inferences. However, this explanation has not been tested using simulations or larger data sets. Thus, the propor-tions of moderately vs.strongly deleterious nonsynonymous mutations in humans, as well as the functional form of the DFE, remain elusive.
Due to large-scale genome and exome sequencing projects, samples of hundreds to thousands of individuals are available (Tennessen et al. 2012; Fu et al. 2013; Lohmueller et al. 2013; The 1000 Genomes Project Consortium 2015). These large data sets should yield more reliable inferences of the DFE because moderately deleterious polymorphisms should be segregating, albeit at low frequency, in these samples (Supplemental Material, Figure S1 in File S1). As such, it should be possible to determine the functional form of the DFE and directly estimate the proportion of moderately and strongly deleterious mutations.
two size changes due to computational complexity, and it can be slow for the two-size-change model. This is particularly limiting in large samples of human genetic variation since a single-size-change demographic model is insufficient for capturing the excess of rare variation in human popula-tions (Keightley and Eyre-Walker 2007; Kousathanas and Keightley 2013). Another class of methods to infer the DFE uses the Poisson random field (PRF) approach (Sawyer and Hartl 1992; Hartlet al.1994; Williamsonet al.2005; Eyre-Walkeret al.2006; Boykoet al.2008; Liet al.2010). This approach has been implemented in the program PRFREQ (Boyko et al. 2008), but that implementation becomes numerically unstable when applied to samples larger than a few hundred individuals. The program @a@i (Gutenkunst et al. 2009) uses a similar framework, but implementing a DFE is slow due to the way that the DFE is repeatedly integrated (Figure S2 inFile S1). Thus, there is a need for a new software tool to infer the DFE from large samples.
In this study, wefirst extend the program@a@i to analyze arbitrary DFEs in a computationally efficient manner. We implement these features in a module for@a@i, which we call Fit@a@i. We then use this approach to estimate the DFE of deleterious, nonsynonymous mutations from multiple large human data sets. We consider several different functional forms for the DFE. Wefind that across the multiple data sets, a mixture distribution where a proportion of mutations are neutral and the remainder are gamma distributedfits best. Analysis of multiple data sets suggests there are fewer strongly deleterious mutations where |s| . 1022 (0.38– 0.84 fold) than previously estimated in Boykoet al.(2008) (35%), regardless of the functional form of the DFE. Further, our results are not consistent with a model where 99% of new mutations have a selection coefficient weaker than 1023, as suggested by Liet al.(2010). Because we anticipate that our estimates of the DFE will be useful in subsequent simulation studies, we provide SFS_CODE (Hernandez 2008) and SLiM (Messer 2013) commands to simulate data where mutations havefitness effects from these DFEs.
Materials and Methods Fit›a›i: software to infer the DFE
Here we present our new software, Fit@a@i, to infer distribu-tions of selection coefficients of new mutations under the PRF model using the SFS. Fit@a@i is a module that extends the functionality of the Python package, @a@i (Gutenkunstet al. 2009). Specifically,@a@i uses diffusion theory to compute the expected SFS for a set of demographic parameters and selec-tion coefficients. Fit@a@i offers a substantial computational im-provement over the existing implementation of@a@i for models involving more than a single selection coefficient. To do this, Fit@a@i computes SFSs for a range of selection coefficients and saves each SFS into an array. Then, subsequent integrations of the DFE are done using the array of precomputed SFSs. This process results in a substantial improvement in computational speed compared to the existing implementation of@a@i, which recomputes the SFS for each selection coefficient in each step of the optimization process (Figure S2 in File S1). Fit@a@i also allows parallel computation of the SFS by using multiple cores or a cluster. Importantly, Fit@a@i leverages the modular nature of@a@i to allow the user to define any arbitrary demographic model and DFE, including DFEs that are complex mixture dis-tributions. Lastly, we incorporated an optimization routine that allows for constrained optimization of complex mixture distri-butions. Below we describe our inference procedure in greater detail, starting with inference of demography, followed by the details of Fit@a@i. We then discuss a simulation study to assess its performance, both under the assumptions of the PRF model as well as when some are violated, and then the data sets that we use to infer the DFE in humans.
Inference using the SFS
estimating a demographic model for putatively neutral, syn-onymous sites. Then, conditional on the demographic param-eter estimates, we infer the paramparam-eters for the DFE of nonsynonymous mutations.
To do this, we summarized synonymous and nonsynon-ymous sites with the SFS. The SFS can be described as a vector, X= [X1,X2,. . .,Xn21], in which each entryXidescribes the number of SNPs at frequencyiin a data set of sizen chromo-somes. In the PRF framework, each entry in the SFS is as-sumed to be comprised of independent sites (Sawyer and Hartl 1992; Hartlet al.1994).
Additionally, we folded the SFS to avoid difficulties with misidentification of the ancestral state (Hernandez et al. 2007). This form of the SFS counts the number of SNPs of minor allele frequencies (MAFs) 1 ton/2 without taking the ancestral state into account. The folded SFS has been shown to perform well at inferring the DFE of deleterious mutations (Keightley and Eyre-Walker 2007; Boyko et al. 2008; Tataruet al.2016).
Inference of demography
A demographic model, the parameters of which are denoted as D, was fit to the SFS of synonymous sites with @a@i (Gutenkunstet al.2009). Here,@a@i uses a diffusion approx-imation to compute the distribution of allele frequencies given some demographic model,f(x;D). Then, the expected number of SNPs at frequencyiin a sample of sizen chromo-somes can be written as:
E½Xi¼
u 2
Z 1
0
xið12xÞn2ifðx; DÞdx: (1)
The multinomial likelihood, computed with the folded SFS, is maximized to estimate the demographic parameters:
LðX*jDÞ¼Y i
EXi*D
P
iE
X*
iD
!X*
i
; (2)
whereX*
i denotes the observed count of SNPs at frequencyi in the folded SFS. The multinomial likelihood uses the pro-portions of SNPs at a particular frequency in the sample rather than the counts from the model. Therefore, it does not require ana prioriassumption about the mutation rate or ancestral population size. The mutation rate of synony-mous sites, denoted uS, was then computed as the scaling factor difference between the optimized SFS and the data.
Whenfitting models incorporating periods of rapid expo-nential growth with@a@i, we set the program parameterdadi.
Inference.set_timescale_factor=1026, in contrast to the
de-fault setting of 1023. In@a@i, periods of exponential growth are approximated with a series of instantaneous size changes and, if the time steps are not small enough, parameters re-lated to exponential growth will not be inferred correctly. This causes the demographic model to inaccurately predict the expected numbers of rare variants, biasing downstream inference of selection.
Inference of selection
To infer the DFE, we developed the Fit@a@i module, which uses@a@i and some of the methodological improvements of Ragsdale et al. (2016). First, we condition on the demo-graphic model that was fit to synonymous sites using the procedure described above. Given that demography,@a@i is used to compute a distribution of allele frequenciesf(x;D,g), whereDis a vector containing the demographic param-eters inferred from synonymous sites and g is a single population-scaled selection coefficient. Specifically,g= 2NAs, whereNAis the ancestral population size, but it is rescaled in each time period of the demographic model by the fold size change relative to the ancestral population. A DFE, denoted g(g), can be incorporated by generatingf(x; D,g) for a range ofg, then weighting the contribution of each of these frequency spectra byg(g) (Boykoet al.2008):
E½Xi¼
u 2
Z N
2N
Z 1
0
xið12xÞn2ifðx; D;gÞgðgjDFEÞdxdg:
(3)
In the standard implementation of@a@i, this process is time consuming because the SFS must be computed repeatedly during each step of optimization. In other words,f(x;D,g) is computed each time a given value ofgis evaluated in a DFE. This process can be especially slow for large ranges ofg and for large sample sizes. Therefore, similar to Ragsdale
et al.(2016), we initially computed the SFS for a range of
selection coefficients, and then cached these results to avoid recomputing the frequency spectra (Figure S2 inFile S1). In addition, we computed many frequency spectra in parallel to save time, added compatibility for user-defined DFEs, modified the optimization routines available in@a@i to work with cached spectra, and added the option to use constrained optimization for the inference of complex mixture distribu-tions. These extensions are part of the Fit@a@i module.
To infer selection, wefixed the demographic parameters to the maximum-likelihood estimates (MLEs) inferred from syn-onymous sites, ^D: Then, wefit a DFE, the parameters of which are denoted asDFE, to the folded SFS of nonsynon-ymous sites by maximizing the Poisson likelihood:
LðX*j^D;DFEÞ¼Y i
exp
2E
h
X*
i^D;DFE
i
3E
Xi*^D;DFE
X*
i!
: (4)
Each DFE is defined as an integrable function over a log-spaced range of 600 selection coefficients over intervals be-tween |s| = [1028, 0.5]. We considered any portion of the DFE smaller than |s| = 1028to be effectively neutral (|s| = 0), and any variants of |s|.0.5 to have negligible probability of being found in polymorphism data (i.e., not found in the data). Note that here we only consider the del-eterious DFE but this function can easily be extended to in-corporate positive selection (Huberet al.2016).
Fit@a@i includes many of the standard DFEs (Boykoet al. 2008; Kousathanas and Keightley 2013), such as a gamma distribution and several mixture distributions. Specifically, we investigated mixture distributions where a proportion of mutations are neutral; with the rest following a gamma dis-tribution as well as a mixture disdis-tribution where a fraction is neutral, a fraction is lethal, and the remainder follows an exponential distribution of fitness effects. Lastly, Fit@a@i in-cludes arbitrary mixture distributions with afixed number of
fitness classes, or bins, where each bin can have its own range of selection coefficients (called the“discrete DFE”). Fit@a@i infers the proportion of new mutations in eachfi t-ness class. For mixture distributions incorporating a point mass at neutrality or lethality, we define the DFE so it can be treated as a single integrable function. We add the area of the point mass to a part of the distribution that is as-sumed to be neutral or lethal. For example, to add a point mass of neutral mutations to the“neutral+gamma DFE,” we add the probability mass of neutral mutations,pneu, to the |s| = [0, 1028] portion of the distribution. Then, we integrate the gamma DFE between |s| = [0, 1028] and sum it withpneuto obtain the total mass of neutral muta-tions. Additionally, we used the SLSQP algorithm (Kraft 1988) as implemented in SciPy 0.17.1 to perform con-strained optimization for mixture distributions incorporat-ing more than two components. Throughout, we will usea and b to denote the shape and scale parameters of the gamma distribution, respectively, andlto denote the rate parameter of the exponential distribution. The DFEs we report will be scaled by the ancestral population size. To estimate confidence intervals (C.I.’s) for our data, we Pois-son resampled the nonsynonymous SFS and refit the DFE to the resampled data (Boykoet al.2008). We note these C.I.’s are likely too narrow because they assume indepen-dence between all sites and do not account for the uncer-tainty in the demographic inference.
Simulations
To assess the performance of Fit@a@i, we performed forward-in-time simulations under different models of selection and demography. Simulations of independent sites were done using the program PReFerSIM (Ortega-Del Vecchyo et al. 2016), which simulates unlinked SNPs under the PRF model. We simulated synonymous sites separately with a population-scaled mutation rate ofuS= 4000 to approximately match the amount of synonymous genetic diversity in our data sets. We simulated nonsynonymous sites at a ratio of 2.5 nonsynonymous
to 1 synonymous site, in other words usingLNS/LS= 2.5. These simulations included sample sizes of n = 24 and n = 2596 chromosomes using a demographic model of constant size, a twofold instantaneous size change, and the demography inferred from the LuCamp data. We con-sidered a variety of DFEs, which are described in more detail in specific instances below.
Because the PRF model makes several restrictive assump-tions that are likely to not apply to real data sets, we performed an additional set of forward simulations violating these assumptions, and assessed the effect on inferences using Fit@a@i. Specifically, we investigated the effects that unmodeled linkage, background selection, and population structure might have on our inference of the DFE. To do this, we simulated 100–150 Mb regions using the recombination rate and arrangement of functional elements on human chromosome1(Huberet al.2016) using the forward simu-lation program SLiM (Messer 2013). We assumed a gamma DFE for both nonsynonymous (a= 0.2,b= 200) and con-served noncoding sites (a= 0.0415,b= 50; see Torgerson
et al.2009). We assume that 400 generations ago, the
an-cestral population expanded eightfold and split into eight genetically isolated populations. This population size in-crease reflects the Neolithic expansion into Europe under the demic diffusion model (Chikhi et al. 2002; Gazave
et al. 2014). We then sampled 100 chromosomes equally
across the eight populations, combined them together, and analyzed them as though they were from a single popula-tion. The ancestral population was simulated for a burn-in period of 10Ngenerations. To avoid prohibitively slow for-ward simulations, we simulated with an ancestral effective population size of 1000 and scaled mutation rate, recombina-tion rate, selecrecombina-tion coefficients, and demographic parameters accordingly (Aberer and Stamatakis 2013). We thenfit a single population demographic model (which is the incorrect model) to the synonymous SNPs in each simulated data set using@a@i. Then, conditional on these demographic parameters, we inferred the DFE using Fit@a@i. Our goal with these simula-tions is to mimic what researchers do in practice; where they do not know the true demographic model, but try to fit a simplified model to the data.
Data
We downloaded SNP data for 432 unrelated European (EUR) individuals from the 1000 Genomes Project phase 3 release (The 1000 Genomes Project Consortium 2015); 6503 individ-uals from the National Heart, Lung, and Blood Institute ESP6500SI-V2 European American (EUR) data set (Tennessen
et al.2012; Fuet al.2013); and 2000 Danish individuals from
maskfilter were used. The total length of sites considered in the analysis, LS + LNS, was computed by taking this fi lter-ing into account. Variants were annotated uslter-ing the 1000 Ge-nomes Project-filtered annotations. The Exome Sequencing Project (ESP) ESP6400 data set was downloaded from the Exome Variant Server (http://evs.gs.washington.edu/EVS/). Only sites with 1800 or more European individuals sequenced, according to the site-by-site annotations, were used for the analysis. The LuCamp data were obtained from Lohmueller
et al.(2013). For computational tractability, a hypergeometric
distribution was used to project the LuCamp and ESP data sets down to sample sizes of 1298 and 1300 diploids (Gutenkunst
et al.2009), respectively, afterfiltering problematic individuals.
All 432 unrelated European individuals from the 1000 Ge-nomes Project were used. From these data, we assembled the folded SFS of synonymous and nonsynonymous sites, which were used for subsequent inference. To examine the effect of a smaller sample size on inference of demography and selection, we also projected the data down to a sample size of 24 chromosomes.
Estimating s from 2Ns
The DFEs inferred using the approach described above were for the population-scaled selection coefficient, scaled by twice the ancestral population size (g= 2NAs). Because we were interested in the distribution ofs, we needed to estimateNA. We computedNAfrom the value ofuSinferred from synony-mous sites (Table S1 in File S1) using the equationuS = 4NAmLS. Detailed information about these parameters used for our analysis can be found in Table S2 inFile S1. However, this value ofNAdepends on assumptions about the per-base-pair mutation rate and the ratio of possible nonsynonymous to synonymous sites,LNS/LS, since these quantities are computed from the total number of coding sites,LS+LNS. We assumed the mutation rate to bem= 1.531028to reflect estimates of the mutation rate in the human exome (Ségurelet al.2014). For comparison to results from Boyko et al.(2008), we as-sumed the mutation rate to bem= 1.831028. For the re-analysis of the Boykoet al.(2008) data set, we assumed the same ancestral population size,N= 7778 diploids, instead of computing it. To compute the total number of coding sites, LS+ LNS, in each data set, we intersected the coding exons from the University of California Santa Cruz canonical tran-script with the relevant filters for each data set. For the 1000 Genomes data, we intersected the phase 3 strict mask, the exome targets, and the hg19 coding exons. For the analysis of the ESP data set, we used the intersection of the hg19 coding exons and the site-by-site annotations to count the total number of coding sites for whichn$2600 alleles had been sequenced. For the LuCamp data, we obtained the value of LS+LNSfrom Lohmuelleret al.(2013).
Data availability
This research uses previously published data sets obtained as previously described. The Fit@a@i software is available at https://github.com/LohmuellerLab/fitdadi.
Results
Validation of Fit›a›i by comparison to previous analyses
We first examined the performance of Fit@a@i by fitting a demographic model and DFE to the African-American SFS from Boykoet al.(2008). Fit@a@i produces similar estimates of the shape and scale parameters of the gamma distribution compared to Boyko et al.(2008) (Boyko:a= 0.184, b= 2488; Fit@a@i:a= 0.179,b= 3161). Additionally, Fit@a@i produced similar estimates of the proportions of mutations in different bins of the DFE (Table S3 inFile S1).
Performance on simulated data
We further investigated the performance of Fit@a@i by per-forming forward simulations under the PRF model (see
Materials and Methods). Wefirst considered the best-fit DFE
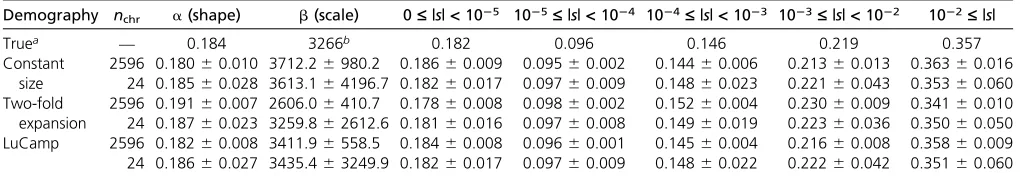
of Boykoet al.(2008), rescaled to have an ancestral popula-tion size of N= 10,085 diploids (a = 0.184, b = 3226). Fit@a@i is able to accurately infer the DFE from our simulated data sets (Table 1). Predictably, the variance of our estimates of the most deleterious portion of the DFE (|s|.1022) is
five- to sixfold greater for the small (n= 24) samples. How-ever, for the samples of sizen= 2596, the variance in the estimates of this portion of the DFE is significantly reduced and overall estimates of the proportions of the DFE where |s|.1023are accurate. Therefore, this sample size should allow us to accurately infer the most deleterious portions of the DFE.
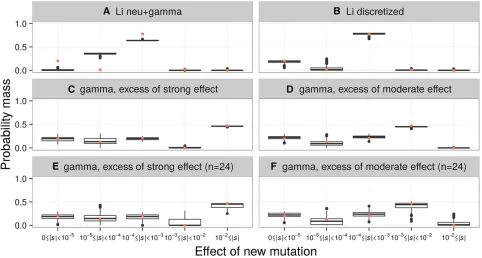
Because it is not certain that the DFE is truly gamma distributed, we simulated data sets of 2596 chromosomes with other DFEs. Again, we scaled these DFEs to an ancestral population size of 10,085 diploids. We considered the mixture distribution of Liet al.(2010), which consists of 20% neutral and 80% gamma-distributed (a= 4,b= 2.148) selection coefficients (the neutral+gamma DFE). We also considered a mixture distribution consisting offive bins, (the discrete DFE) with breaks at |s| = [0, 1025, 1024, 1023, 1022, 1]. Within each bin, the values ofswere uniformly distributed. We ex-amined three weighting schemes for this distribution. First, we computed the probability mass in each bin from the mix-ture distribution of Liet al.(2010). Then, we computed the probability mass in each bin from a gamma distribution with parametersa= 0.203 andb= 1082.1, but where the mass in the |s| = [1022, 1] bin was placed into the |s| = [1023, 1022) bin, and the opposite case where the mass in the |s| = [1023, 1022) bin was placed into the |s| = [1022, 1] bin. This was done to evaluate whether we could distinguish be-tween these discrete DFEs and to evaluate our ability to dis-tinguish strongly deleterious mutations from moderately deleterious mutations in a large sample.
discrete DFE correctly estimates a negligible fraction of mod-erately or strongly deleterious new mutations (|s|.1023), and correctly infers a mode of weakly deleterious mutations (1024#|s|,1023). However, estimates of the proportion of nearly neutral and neutral mutations (|s|,1024) are less accurate (Figure 2A). When we simulate with the discretized distribution of Liet al.(2010), our estimates of the propor-tions of the discrete DFE are unbiased (Figure 2B). Addition-ally, we can distinguish between DFEs with varying proportions of moderately and strongly deleterious muta-tions (Figure 2, C and D). Although it is unlikely that the DFE of any natural population is discretized in this manner, these results show that the discrete DFE can help to approx-imate the general form of the underlying DFE, even if the true DFE is multimodal. This mimics what would be done in prac-tice, where the precise functional form of the DFE is not known a priori. Therefore, fitting the discrete DFE should provide a general idea of the true DFE, especially if the true DFE is significantly multimodal. Notably, the discrete distri-bution can distinguish between strongly and moderately del-eterious mutations at our sample size of 2596 chromosomes.
Simulations with linkage and population structure
The procedure offirst inferring demography from the synon-ymous SFS and then selection from the nonsynonsynon-ymous SFS provides unbiased estimates of selection, even in the presence of linkage (Boyko et al. 2008; Messer and Petrov 2013; Comeron 2014). In other words, this methodology controls for the effects of selection at linked sites. However, it is un-clear what effect population structure might have on infer-ence of the DFE. It is well known that such cryptic structure affects the SFS and may bias demographic inference (Ptak and Przeworski 2002; Gazave et al. 2014). Further, large human resequencing data sets may contain cryptic popula-tion structure (Novembre and Ramachandran 2011). For ex-ample, the 1000 Genomes European sample is comprised of
five different subpopulations. To examine the performance of Fit@a@i when applied to data sets where the assumptions of the PRF model and a single, unstructured population are violated, we performed forward simulations including back-ground selection and population structure (seeMaterials and
Methods). Wefit a single population, single-size-change
de-mographic model to synonymous sites; and then, conditional
on the size-change demographic model, a gamma DFE to nonsynonymous sites for each simulation replicate. Even when using the incorrect demographic model, we accurately infer se-lection from simulated data in the presence of linkage and pop-ulation structure (Figure 3). Importantly, the single-size-change demographic model provides a reasonable approximation to the SFS when there are both population expansions and structure (Figure 3A). This in turn allows for the accurate estimation of both the shape and scale parameters of the gamma DFE (Figure 3B).
Therefore, simulations and a comparison to existing em-pirical data suggest that Fit@a@i can reliably infer the DFE in the presence of complex demographic scenarios. Below we present additional simulation scenarios to examine the per-formance of Fit@a@i with varying sample sizes and when the assumed demography and DFE are misspecified.
Demographic inference
We begin byfitting a demographic model to the synonymous SFS of each of the three data sets (LuCamp, ESP, and 1000 Genomes) using@a@i. Briefly, this demographic model incor-porates an out-of-Africa bottleneck, a recovery period, and recent exponential population growth (Figures S3 and S4 in File S1). Our estimates of demography as well as the inferred population sizes are presented in Tables S1 and S2 inFile S1. Predictably, the parameter describing the magnitude of re-cent population expansion is harder to infer when using a sample size of 24 chromosomes than when using the larger sample sizes (n= 2596 chromosomes). Although the demo-graphic model we infer is biased by linked selection, this step controls for these effects when inferring selection (Boyko
et al. 2008; Kousathanas and Keightley 2013; Messer and
Petrov 2013; Huberet al.2016).
Inference of the DFE from large data sets
Here we estimate the DFE for new nonsynonymous mutations using large samples. First, like previous studies, we fit a gamma distribution to the DFE (Table S4 inFile S1). We infer a strongly leptokurtic distribution where there are many neu-tral and nearly neuneu-tral mutations (i.e., 34–37% of new mu-tations have |s| , 1024), as well as a class of strongly deleterious mutations (i.e., 15–22% of new mutations have |s| . 1022). Interestingly, the estimates from the three Table 1 Performance of Fit›a›i on simulated data sets
Demography nchr a(shape) b(scale) 0£|s|<1025 1025£|s|<1024 1024£|s|<1023 1023£|s|<1022 1022£|s|
Truea — 0.184 3266b 0.182 0.096 0.146 0.219 0.357
Constant size
2596 0.18060.010 3712.26980.2 0.18660.009 0.09560.002 0.14460.006 0.21360.013 0.36360.016 24 0.18560.028 3613.164196.7 0.18260.017 0.09760.009 0.14860.023 0.22160.043 0.35360.060 Two-fold
expansion
2596 0.19160.007 2606.06410.7 0.17860.008 0.09860.002 0.15260.004 0.23060.009 0.34160.010 24 0.18760.023 3259.862612.6 0.18160.016 0.09760.008 0.14960.019 0.22360.036 0.35060.050 LuCamp 2596 0.18260.008 3411.96558.5 0.18460.008 0.09660.001 0.14560.004 0.21660.008 0.35860.009 24 0.18660.027 3435.463249.9 0.18260.017 0.09760.009 0.14860.022 0.22260.042 0.35160.060
95% intervals were estimated as61.96 SD of 100 replicates in each simulation set. chr, chromosome. aValues show the true DFE used to simulate the data.
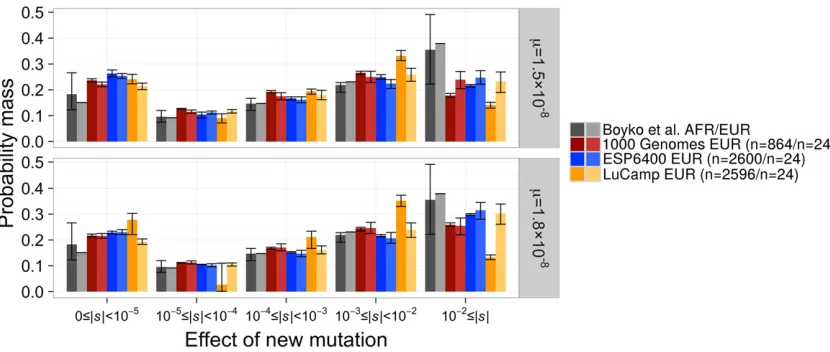
different data sets are generally concordant, though the 95% C.I.’s sometimes do not overlap. While this may suggest that the differences cannot be attributable to limited amounts of data in the SFS, we caution that these C.I.’s are likely too narrow because they do not account for the nonindepen-dence of SNPs or the uncertainty of demographic estimates. When compared directly to Boykoet al.(2008), the best-fit gamma DFEs inferred from all three data sets are generally shifted toward neutrality (Table 2 and Tables S4 and S5 in File S1), even when matching the mutation rates to those of Boykoet al.(2008) (m= 1.831028andLNS/LS= 2.5). We infer 19.2–22.9% of new mutations have a selection coeffi -cient |s|,1025, compared to the 18.3% observed by Boyko
et al. (2008). This corresponds to a 1.05- to 1.25-fold
in-crease. Additionally, we infer 24.5–29.8% of new mutations are strongly deleterious (|s|.1022), which corresponds to a 0.69- to 0.84-fold decrease of the 35.5% inferred by Boyko
et al.(2008). Taken together, when assuming a gamma
dis-tribution for the DFE, all three data sets suggest fewer strongly deleterious mutations than seen in Boyko et al. (2008).
Next, we explored thefit of complex DFEs to these large samples. Using the same combination of mutation rates as with the gamma, wefit the neutral+gamma mixture distri-bution; a mixture distribution of a point mass of neutral, a point mass of lethal, and exponentially distributed new
Figure 3 Inference of the DFE is robust to misspecifi ca-tion of the demographic model and background selec-tion. Points show the MLEs of the (A) demographic parameters and (B) DFE parameters inferred from 100 simulated data sets with linkage and population structure. Red lines denote the true values and the yel-low dots denote the median estimates across the 100 data sets. Estimates of time of expansion (T1) and
the ratio of current to ancestral population size (N1/NANC)
tend to be biased because demography is incorrectly modeled due to background selection, but estimates of the DFE are unbiased.
Figure 2 The discrete DFE can recover the approximate form of the DFE from simulated data. The distributions of the proportions of mutations with different selective effects, as inferred by the discrete DFE for 100 simulated data sets, are shown. Each simulation set assumed the demographic model fit to the LuCamp synonymous SFS. A red point depicts the true proportions of the simulated DFE. The true DFE for each set is: (A) the continuous neutral+gamma distribution of Liet al.(2010) (pneu= 0.2,a= 4,b= 1.06531024), (B) the discretized version of that distribution, (C–F) a gamma DFE (a= 0.215,b= 567.1), but
where (C and E) the mass of the 1023#|s|,1022bin was added to the 1022#|s| bin, and (D and F) where the mass of the 1022#|s| bin was
added to the 1023#|s|,1022bin. The data sets simulated for (C) and (D) had sample sizes ofn= 2596 chromosomes, while the data sets for (E)
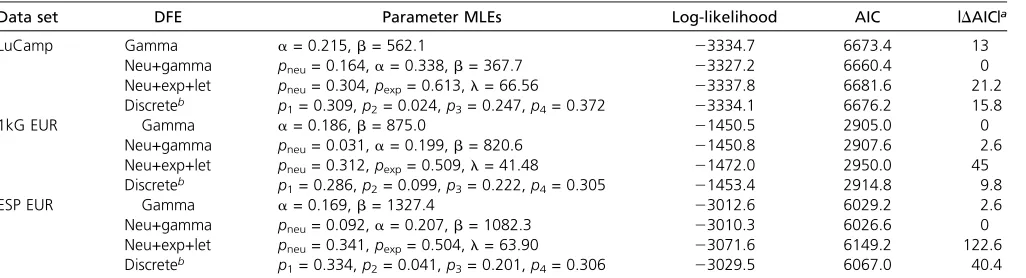
mutations (the “neutral+exp+lethal”DFE); and the dis-crete DFE described previously. The MLEs, as well as the proportion of mutations with varying selection coefficients predicted by these distributions, are depicted in Table 2, Table 3, and Table S4 inFile S1.
When we assumem= 1.531028andLNS/LS= 2.31, the neutral+gamma DFEfit best to the LuCamp and ESP data sets as reflected by the highest log-likelihood and Akaike information criterion (AIC) score (Table 3 and Table S4 in File S1). The gamma stillfit best to the 1000 Genomes data set. Compared to the gamma DFEs inferred previously for two data sets, our best-fitting DFEs predict slightly fewer (0.92–0.98 fold) new mutations with |s|.1022, and slightly more (1.06–1.18 fold) new mutations of |s| , 1025. When we matched the mutation rates of Boykoet al.(2008) withm= 1.831028andLNS/LS= 2.5, the discrete DFEfit best to the LuCamp data set (Table 3 and Table S4 inFile S1). However, the gamma DFE continued tofit best to the 1000 Ge-nomes and ESP data sets under these assumptions. The best
fitting DFEs are depicted in Figure 4 and Figure S5 inFile S1, and a comparison of the model to the SFS of the data are shown in Figure S6 inFile S1. When using the larger mutation rate, wefind the discrete DFE tofit best to the LuCamp data set, which predicts significantly fewer (0.54 fold) new muta-tions of |s|,1022than the gamma DFEfit using the same mutation rate.
One concern is that biases in SNP calling may affect these inferences. One way to test for this is by masking the singletons in the analysis, since singletons may be enriched for false SNPs due to sequencing errors (Boyko et al. 2008). We fit the gamma and neutral+gamma DFEs while masking the single-ton category in the SFS and find little difference in the inferred DFEs (Table S6 in File S1). This finding suggests our inferences are robust to potential errors in SNP calling in these data sets.
The DFEs we have inferred thus far differ from that inferred in Boykoet al.(2008). In that study, 35.5% of new
nonsynon-ymous mutations were inferred to be strongly deleterious in African-Americans, and 37.9% in Europeans. We infer fewer new strongly deleterious nonsynonymous mutations, even when matching the mutation rates used in Boyko et al. (2008) (Figure 4 and Figure S5 in File S1). Furthermore, the distribution of 2Nsalso shows fewer strongly deleterious mutations (27.1–36.9% of mutations with 2Ns . 100) than seen in Boykoet al. (2008) (40.4% of mutations with 2Ns.100; Figure S5 inFile S1). Our results remain consis-tent across data sets and assumed forms of the DFE.
Additionally, our estimates of the DFE differ substantially from the estimates provided by Liet al.(2010). Specifically, Li
et al.(2010) infer almost no strongly or moderately
delete-rious new nonsynonymous mutations. That is, 1% of new nonsynonymous mutations have selection coefficients of 1023 , |s| , 1022 and 0% have a selection coefficient |s|.1022(Figure 1). All of our estimates infer that at least 30% of new nonsynonymous mutations have a selection coefficient |s|.1023, even when the assumed mutation rate is small (Figure 4 and Table 3). Our simulations suggest if the true underlying DFE follows that suggested by Li et al. (2010), we should be able to estimate those proportions us-ing both the neutral+gamma and the discrete DFE (Figure 2, A and B). The fact that our inferences did not show similar estimates to those inferred by Liet al.(2010) suggests that our data and analyses are not consistent with the distribution inferred by Liet al.(2010) (Table S5 inFile S1). In the fol-lowing sections, we explore several reasons why the different studies infer different DFEs.
Assessing the role of sample size and model misspecification using simulations
One possibility for the distinct estimates of the DFE is that the three studies used different sample sizes. Larger samples will have more moderately and strongly deleterious variants seg-regating than will smaller data sets (Figure S1 inFile S1). To investigate the effect of sample size on our ability to infer the Table 2 MLEs of various DFEs
Data set DFE Parameter MLEs Log-likelihood AIC |DAIC|a
LuCamp Gamma a= 0.215,b= 562.1 23334.7 6673.4 13
Neu+gamma pneu= 0.164,a= 0.338,b= 367.7 23327.2 6660.4 0
Neu+exp+let pneu= 0.304,pexp= 0.613,l= 66.56 23337.8 6681.6 21.2
Discreteb p
1= 0.309,p2= 0.024,p3= 0.247,p4= 0.372 23334.1 6676.2 15.8
1kG EUR Gamma a= 0.186,b= 875.0 21450.5 2905.0 0
Neu+gamma pneu= 0.031,a= 0.199,b= 820.6 21450.8 2907.6 2.6
Neu+exp+let pneu= 0.312,pexp= 0.509,l= 41.48 21472.0 2950.0 45
Discreteb p
1= 0.286,p2= 0.099,p3= 0.222,p4= 0.305 21453.4 2914.8 9.8
ESP EUR Gamma a= 0.169,b= 1327.4 23012.6 6029.2 2.6
Neu+gamma pneu= 0.092,a= 0.207,b= 1082.3 23010.3 6026.6 0
Neu+exp+let pneu= 0.341,pexp= 0.504,l= 63.90 23071.6 6149.2 122.6
Discreteb p
1= 0.334,p2= 0.041,p3= 0.201,p4= 0.306 23029.5 6067.0 40.4
These results are reported assumingLNS/LS= 2.31 andm= 1.531028. See Table S4 inFile S1for additional information. The shape and scale parameters of the gamma distribution are denoted withaandb, respectively, and the rate parameter of the exponential distribution is denoted withl. Neu, neutral; exp, exponential; let, lethal; 1kG, 1000 Genomes.
aChange in AIC relative to the model with the lowest AIC.
DFE, we simulated 200 data sets, without linkage, of sample sizesn= 12, 24, 100, 250, and 500 chromosomes. Each data set was simulated using the demographic model and gamma DFE inferred from the LuCamp data set.
First, we simulated neutral synonymous sites and inferred the demographic parameters from each data set. This was done in two ways. First, we estimated the parameters from the full demographic model that was used to generate the data (herein the“full”model). Second, we inferred the parameters in a demographic model with only three instantaneous size changes (herein the“three-epoch”model). This is meant to mimic the situation in Boyko et al.(2008), where the true demography of the European population was likely complex, but simpler three-epoch demographic models could accu-ratelyfit the synonymous SFS. Next, as done in our inference and in previous studies, we estimated the parameters of a gamma distribution for the DFE of nonsynonymous muta-tions, conditioning separately upon the two demographic models.
When the full demographic model wasfit to the simulated data sets, we found the variance of our estimates, both of demography and selection, decreased as sample size in-creased (Figure S7 inFile S1). We were unable to correctly infer the magnitude of recent population growth with small sample sizes, consistent with previous work (Keinan and Clark 2012; Nelson et al. 2012; Tennessenet al.2012; Fu
et al. 2013). However, this did not affect the inference of
selection as long as the demographic model fit reasonably well to synonymous sites (Figure S7 in File S1). At small sample sizes, the three-epoch model could fit the synony-mous SFS well and thus estimates of selection were also un-biased. However, we found that for sample sizes .100 chromosomes, the three-epoch model increasingly became unable to account for the excess of rare variants caused by recent growth. The inability to account for the rare variants in the sample then biased the estimates of both the shape and scale parameters of the gamma distribution. However, this effect seems to be negligible at a sample size of 24 chromo-somes (Figure S7 inFile S1).
As long as the demographic modelfits the observed SFS of synonymous sites, small sample sizes can estimate the param-eters in a gamma distributed DFE, even when the demographic model is not the correct one. The accuracy of the estimates increases with sample size, especially for the scale parameter, and notably provides better estimates of the strongly deleteri-ous portion of the DFE (Figure S7B inFile S1and Table 1). Thus, the results of Boyko et al. (2008) are unlikely to be affected by misspecification of demography due to small sam-ple size.
Another possibility for the varying estimates of the DFE is that the DFE itself may be misspecified. Although parametric distributions are convenient for approximating the DFE, the true form of the DFE is unknown. Additionally, we have shown that the neutral+gamma DFE and the discrete DFE canfit large data sets better than the gamma DFE. To investigate an example of what would happen if the DFE is misspecified, we
Table 3 W e in fer more nea rly neutra l (| s | < 10 2 5) and fewer strong ly dele terious (| s | ‡ 10 2 2) new muta tions th an pr evious studie s Data set m , LNS / LS Best fi t D FE 0 £ | s | < 10 2 5 10 2 5£ | s | < 10 2 4 10 2 4£ | s | < 10 2 3 10 2 3£ | s | < 10 2 2 10 2 2£ | s | Boyk o et al. (2008 ) (AA a) 1.8 3 10 2 8, 2.5 b Gam ma 0.183 0.096 0.1 47 0.219 0.355 1000 Genom es 1.8 3 10 2 8, 2.5 b Gam ma 0.217 (0.212 – 0.223 ) 0.112 (0.111 – 0.1 13) 0.169 (0.165 – 0.172) 0.2 43 (0.2 35 – 0.249) 0.259 (0.252 – 0.266) ESP Gam ma 0.229 (0.223 – 0.234 ) 0.105 (0.104 – 0.1 06) 0.152 (0.150 – 0.155) 0.2 16 (0.2 12 – 0.221) 0.298 (0.294 – 0.302) LuCa mp Discrete 0.278 (0.221 – 0.303 ) 0.027 (0.001 – 0.1 10) 0.211 (0.167 – 0.234) 0.3 52 (0.3 30 – 0.373) 0.132 (0.124 – 0.142) 1000 Genom es 1.5 3 10 2 8, 2.31 Gam ma 0.237 (0.231 – 0.243 ) 0.127 (0.125 – 0.1 28) 0.192 (0.188 – 0.197) 0.2 66 (0.2 59 – 0.272) 0.178 (0.171 – 0.186) ESP Neu+ gamma 0.263 (0.250 – 0.277 ) 0.104 (0.091 – 0.1 14) 0.167 (0.160 – 0.173) 0.2 49 (0.2 41 – 0.259) 0.217 (0.211 – 0.221) LuCa mp Neu+ gamma 0.242 (0.223 – 0.260 ) 0.091 (0.072 – 0.1 07) 0.194 (0.183 – 0.203) 0.3 32 (0.3 13 – 0.352) 0.141 (0.129 – 0.152) Results in comparison w ith data from Boyko et al. (2008). C .I. ’ s w ere constructed b y P oisson resampling the nonsynonymous SFS a nd fi tting a DFE 200 times. See T able S5 in File S1 for a dditional information. N eu, n eutral.
aAfrican-American. bThe
simulated 100 data sets without linkage for the best-fit neutral+gamma DFE inferred from the LuCamp data set, scaled to an ancestral population size of 10,085 diploids (pneu= 0.164,
a= 0.338,b= 358.8). We also downsampled each data set to n= 24 chromosomes. Then, wefit a gamma and neutral+gamma DFE to each full and downsampled data set.
When the true DFE is neutral+gamma distributed, infer-ence of the DFE from small samples overestimates the pro-portion of strongly deleterious mutations (Figure 5). When the DFE is correctly specified, we obtain unbiased estimates of the DFE even from small samples. However, at a sample size ofn= 24 chromosomes, both the gamma and neutral+gamma dis-tributions have a similar log-likelihood (Figure 5A). This was also observed in Boykoet al.(2008). Then, the extra parame-ter in the neutral+gamma distribution penalizes the true DFE when choosing the best-fit DFE by AIC score. This leads one to choose the gamma distribution as the best-fit DFE to the small sample, even when the true DFE follows a neutral+gamma distribution. Fitting the gamma distribution yields a DFE with more new mutations with |s|.1022and a decrease in the proportion of new mutations with |s|,1025compared to the true DFE (Figure 5B).
Assessing the role of sample size using real data
Next, we investigated the role that sample size has on in-ference of the DFE from real data. To do this, we projected our synonymous and nonsynonymous frequency spectra down to a sample size ofn= 24 chromosomes to match the sample size of Boykoet al.(2008), thenfit a demographic model and DFEs as previously described. Here we used the mutation rate assumptions m = 1.5 3 1028 and LNS/LS = 2.31, but also matched the mutation rate of Boyko et al. (2008) (m = 1.8 3 1028 and LNS/LS = 2.5). Then, we fit the gamma, neutral+gamma, and discrete DFEs—which were
the best-fitting distributions to the full data—to the down-sampled data sets.
As predicted by our simulations, there is generally little difference in thefit of the different DFEs to the downsampled data sets in terms of log-likelihood (Table S5 inFile S1). The neutral+gamma and discrete DFEs oftenfit better than the gamma, but the difference in log-likelihood is small (0.1–0.6 log-likelihood units). Thus, the gamma DFE is selected as the best-fit DFE for all downsampled data sets by AIC. These results mimic what was observed in our simulations, al-though the pattern is not wholly consistent across data sets and mutation rates. When we assumem= 1.831025and LNS/LS= 2.5, the gamma DFEfits best to both the full and downsampled 1000 Genomes and ESP data sets (Figure 4 and Table S5 inFile S1). There also appears to be little dif-ference between the gamma DFE fit to the full and down-sampled data. By contrast, the discrete DFEfits best to the LuCamp data under these mutation rates. Additionally, the neutral+gamma fit best to the full ESP and LuCamp data when we assumem= 1.531025andLNS/LS= 2.31. The gamma DFEfit to the downsampled versions of these data sets predicts more strongly deleterious (|s| . 1022) and more nearly neutral (|s|,1025) new mutations (Figure 4 and Table S5 inFile S1). The DFEfit to the 1000 Genomes data using the lower mutation rates does not follow this pat-tern. The gamma DFEfits best to both versions of the data set, yet the estimates from the small data set still predict more strongly deleterious new mutations. These results seem to corroborate the results from our simulations. That is,fitting a DFE using a small sample may result in misspecification of the DFE, which, in turn, may cause inaccuracies in the inferred proportions of the DFE. We believe this may explain some of the differences between thefindings of Boykoet al. (2008) and thefindings in this study.
Figure 4 The distribution of selection coefficients of new mutations under our best-fit DFEs compared to Boykoet al.(2008). Results are presented for the best-fit DFE to each full data set and the best-fit DFE when the data were projected down ton= 24 chromosomes. C.I.’s were estimated by Poisson resampling the nonsynonymous SFS andfitting a DFE 200 times. C.I.’s for the DFEfit to the Boykoet al.(2008) European data set were unavailable. Note that our models predict more nearly neutral mutations (0#|s|,1025) and fewer strongly deleterious mutations (1022#|s|) than Boykoet al.(2008),
Assessing the role of the likelihood function using simulations
Next, we investigated the performance of the multinomialvs. Poisson likelihoods at inferring the DFE. In this study, as well as in Boykoet al. (2008), wefit the DFE using the Poisson likelihood, which uses ana prioriestimate of the population-scaled mutation rate,u, tofit the curvature of the SFS as well as the total number of SNPs. Too few segregating variants would suggest the presence of strongly deleterious variants that are not segregating in the sample (Boykoet al.2008).
The multinomial likelihoodfits the curvature of the SFS while conditioning on the total number of SNPs. As such, the number of SNPs provides no additional information. The multinomial inference is similar to how the DFE was inferred by Liet al.(2010) in that they only used information from the curvature of the SFS. Note, however, Liet al.(2010)fit the population frequency spectrum using a least-squares approach while the multinomial likelihood fits the sample frequency spectrum. As such, the multinomial likelihood function does not strictly mirror the procedure of Liet al.(2010). Using the multinomial likelihood is convenient because it does not require any prior assumptions about the population scaled mutation rate, u, yet may be underpowered when trying to identify the proportion of strongly deleterious mutations, un-less such variants are segregating in the sample.
To compare the two likelihood methods at varying sample sizes, wefit the full model to simulated data sets ofn= 12, 24, 50, 100, 150, 200, and 250 chromosomes using both the
multinomial and Poisson likelihoods (Figure S8 inFile S1). Again, we simulated 200 data sets at each sample size with the LuCamp demography and a gamma DFE with parameters a= 0.203 andb= 1082.1. In general, the accuracy of our shape parameter estimate improves as the sample size in-creases, and wefind the multinomial and Poisson likelihoods can both be used to reliably estimate the shape parameter. While this trend holds true for the scale parameter using the Poisson likelihood, wefind that we are unable to accurately infer the scale parameter using the multinomial likelihood, even for a sample of n= 250 chromosomes. For example, nearly 50% of all the parameter estimates lie close to the max-imum bound and 25% lie close to the minmax-imum bound allowed during optimization. We found that this result can be explained by the likelihood surface being exceptionallyflat with respect to the scale parameter. In other words, we cannot estimate the strength of purifying selection using only the curvature of the SFS with these sample sizes. Therefore, because Liet al.(2010)
fit only the curvature of the SFS and excluded rare variants (,2% MAF) in a sample of size of n= 400 chromosomes, the power to detect strongly deleterious variants may be quite low, resulting in different parameter estimates from those in Boykoet al.(2008) and our present work.
Discussion
We developed a computational method to infer the DFE of new mutations from large data sets, and then estimated the DFEs Figure 5 Small sample size and misspecification of the DFE can explain some of the differences between previous estimates and our estimates. Gamma and neutral+gamma DFEs werefit to 100 simulated data sets of sample sizesn= 24 andn= 2596 chromosomes, where the true DFE was neutral+ gamma distributed (pneu= 0.164,a= 0.338,b= 358.8). (A) The distributions of the difference in log-likelihood between the gamma and neutral+gamma
for nonsynonymous mutations using the SFS of 432 Europeans from the 1000 Genomes Project, 1300 Europeans from the ESP, and 1298 Europeans from the LuCamp project. The new DFEs suggest there are fewer strongly deleterious mutations than previously estimated (Figure 4). Although we find a neutral+gamma mixture DFE fits best to the ESP and LuCamp data sets, a gamma DFE seems to be a betterfit to the 1000 Genomes data (Table 3). Nevertheless, our best-fit DFEs predict 0.38 to 0.84 as many strongly deleterious new mutations compared to the current, widely used estimates of Boyko et al.(2008). Additionally, thesefindings are ro-bust to assumptions about the mutation rate or the assumed functional form of the DFE. We show small sample size can lead to incorrect estimates of the DFE, specifically when the DFE is approximated with a parametric distribution that is not the true distribution (Figure 5). Therefore, our esti-mates provide an important update to previous studies of the DFE that used smaller sample sizes. Our current esti-mates of the DFE, particularly the estiesti-mates of the propor-tion of moderately and strongly deleterious mutapropor-tions, should be more reliable and precise than previous estimates. To facilitate their utility for future researchers, we provide scripts for implementing these models on GitHub (see
Materials and Methods).
Our results suggest misspecification of the DFE may explain some of the differences in the DFEs we infer from small and large data sets. This is particularly relevant because the true DFE is almost certainly not a parametric distribution. At small sample sizes, different forms of the DFE tended to similarlyfit the data in terms of log-likelihood (Table S5 in File S1). Therefore, the DFE that had fewer parameters (i.e., gamma) was selected as the best-fit DFE. Additionally, we infer more strongly deleterious (|s|.1022) new mutations from the downsampled data sets. We showed through simulations that even if the true DFE is neutral+gamma distributed, a gamma DFE is selected as the best fit to a small sample. Furthermore, this leads to inaccuracy in recovering the true proportions of the DFE (Figure 5). While the neutral+gamma distribution is also unlikely to be the true DFE, our simula-tions reproduce the patterns observed when downsampling the real data. Therefore, large sample size not only helps to improve the precision of the estimated DFEs, but also helps to approximate the correct form of the DFE. We expect this question to be better resolved as additional and larger se-quencing data sets continue to be generated in the future.
A gamma or similarly shaped distribution of deleterious mutations is well supported by experimental estimates of the DFE in laboratory organisms (Martin and Lenormand 2006; Bataillon and Bailey 2014), although some studies suggest more complex distributions (Halligan and Keightley 2009; Hietpaset al.2011; Jacquieret al.2013). A number of theo-retical models also predict the functional form of the DFE (Huberet al.2016). Most progress in this regard comes from phenotypefitness-landscape models such as Fisher’s geomet-ric model (FGM) (Martin and Lenormand 2006; Chevinet al. 2010; Lourenço et al. 2011; Tenaillon 2014; Huber et al.
2016) and biophysical models of protein stability (Cherry 1998; Goldstein 2013; Serohijos and Shakhnovich 2014). Under fairly general assumptions, the predicted DFE under these models for a perfectly adapted population is gamma distributed (Martin and Lenormand 2006; Martin 2014; Serohijos and Shakhnovich 2014), and a strongly leptokurtic shape would suggest that most mutations have low pleiot-ropy (Martin and Lenormand 2006; Lourençoet al.2011). However, ourfinding of a neutral+gamma distribution sug-gests that the general FGM is inadequate, since it does not predict the neutral point mass. Alternatively, our support for a neutral point mass might not reflect truly neutral mutations, but rather slightly beneficial mutations that behave effec-tively neutral under the historically small human population size (Huberet al.2016). Since these mutations would segre-gate at frequencies similar to neutral mutations, and since we do not explicitly model the effect of beneficial mutations on the SFS, our method would place these mutations at the neutral point mass. Such slightly beneficial mutations are predicted under FGM when deleterious mutations fix and move the population away from the optimal phenotype (Lourenço et al. 2011). Slightly deleterious mutations can
fix in the population when the effect of drift is large, i.e., the effective population size is small. Thus, our support for the neutral+gamma distribution might be consistent with a large effect of drift in the relatively small human population (Huber et al. 2016). Alternatively, a recent change in the selective environment could have moved the human popula-tion away from the phenotypic optimum at many genes, lead-ing to a similar increase of the proportion of slightly beneficial mutations (Martin and Lenormand 2006; Chevinet al.2010; Lourençoet al.2011; Banket al.2014).
Additionally, our results show that estimates of the DFE are sensitive to the mutation rate. For any given data set, assuming a higher nonsynonymous mutation rate will result in the inference of stronger purifying selection due to the increased number of SNPs expected (but not observed) relative to the nonsynonymous mutation rate. There are two assumptions that factor into the calculation of the nonsynonymous muta-tion rate: First, it is unclear what the true mutamuta-tion rate is. Whole genome, pedigree-based estimates suggest a mutation rate of about 1028per base pair per generation, exome-based estimates suggest rates of 1.5 3 1028, and phylogenetic estimates suggest a mutation rate in the range of 2.0–2.53 1028(Ségurelet al.2014). Second, we infer a mutation rate from synonymous sites, but use that mutation rate to make an
a prioriassumption about the nonsynonymous mutation rate.
deleterious when assuminguNS/uS= 2.5 andm= 2.531028. Although our results remain qualitatively consistent across the range of mutation rates, uncertainty about the true rate leads to uncertainty in estimating the DFE.
Another important aspect of our results is the consistency of our estimates of the DFE between data sets. Our estimates of the DFE suggest a skew toward neutrality compared to pre-vious studies, and we infer a consistent range of neutral (|s|, 1025, 24–26%), moderately deleterious (1023,|s|,1022, 25–33%), and strongly deleterious (|s|, 1022, 14–22%) new mutations between the three data sets. The consistency of our results across data sets suggests our inferences are accurate and robust to sampling from different populations, sequencing, bioinformatic processing, and sample size. This suggests the DFEs we have inferred are reliable updates to the DFEs inferred by Eyre-Walker et al.(2006) and Boyko
et al.(2008).
It is also worth noting that our methodology has key dif-ferences from that of Li et al.(2010). Liet al.(2010) esti-mated the DFE using the population frequency spectrum excluding rare variants (MAF,2%), under a constant size demographic model using a least-squares method, and fit the curvature of the SFS while not considering the total number of SNPs in the sample. The extent to which these methodological differences as well as differences in se-quencing or bioinformatic processing of the data between their study and our present study contribute to the different estimated DFEs remains unclear. However, we have shown that for small and moderately sized samples,fitting only the curvature of the SFS is insufficient for estimating the scale parameter of the DFE. In other words, for smaller samples, the number of SNPs in the data must be considered to esti-mate the proportions of moderately and strongly deleteri-ous new mutations, since moderately to strongly deleterideleteri-ous mutations are unlikely to be found in the sample.
Fit@a@i infers the DFE for new mutations rather than seg-regating variants. Interestingly, even inference using the mul-tinomial likelihood function, which only uses the frequencies of segregating variants, still infers the DFE for new muta-tions. We used simulations to compare the DFE of new mutations to that of segregating variants (Figure S9 and Table S7 inFile S1). The DFE of segregating variants de-pends on the sample size and is shifted to be more neutral than that of new mutations. Approximating the DFE of segregating variants using a gamma distribution reveals a different shape parameter than that of new mutations (Table S7 in File S1); confirming that Fit@a@i, when ap-plied to segregating variants, estimates the DFE of new mutations. While long-tailed distributions such as the gamma do not directly capture the mode of very strongly deleterious new mutations observed by many experimen-tal studies (Eyre-Walker and Keightley 2007), the propor-tion could be extrapolated from the DFEs we inferred. For example, for a gamma-distributed DFE, the proportion of new mutations that is lethal would be computed as the mass of the distribution greater than |s|.1.
Our results argue that, provided the demographic modelfit to the data can adequately match the SFS of neutral synon-ymous sites, inference of the DFE should be robust to cryptic, unmodeled, population structure. In other words, the skew in the frequency spectrum due to demography must be repro-duced accurately, but inference of selection is relatively robust to the way the skew is modeled. This result is consistent with the work of Maet al.(2013). Alternately, other studies rescale the entries of the nonsynonymous SFS independently to match the skew of the synonymous SFS from the standard neutral model (Eyre-Walkeret al.2006; Galtier 2016; Tataru
et al.2016). However, this method is not always accurate for
demographies including recent, rapid expansions since the skew on neutral and selected sites may differ (Eyre-Walker
et al. 2006). Further,fitting many independent scaling
pa-rameters to large samples can be problematic (Tataruet al. 2016). Thus, Fit@a@i offers an advantage over the rescaling methods in these contexts.
Although Fit@a@i was developed to work with large se-quencing data sets, it still has several limitations. The infer-ence framework we use becomes increasingly slower for larger samples and requires significant computational re-sources and time to initially generate the SFS for the range of selection coefficients. Additionally, the frequency spectrum becomes difficult to compute for larger selection coefficients (2Ns.10,000). This is mainly becausefiner integration grids must be used to accurately estimate low frequency variants. Also, like the method of Boyko et al. (2008), our method assumes additive selective effects and should be interpreted as averaging of selection over all heterozygotes and genetic backgrounds. Nevertheless, we anticipate that our method will be useful for estimating the DFE across the tree of life as polymorphism data sets from different species continue to accumulate.
Our results suggest that there may be more weakly and moderately deleterious nonsynonymous mutations than pre-viously appreciated. This has a number of important impli-cations for medical genetic studies. These variants could possibly contribute to disease risk. However, these mutations could also confound statistical tests that compare observed levels of variation to those predicted by population genetic models. For example, using the DFE of Boykoet al.(2008) would predict fewer segregating deleterious variants be-cause more new mutations were estimated to be strongly deleterious and would not segregate in the sample. How-ever, if those mutations were instead only moderately dele-terious, some could drift up in frequency and actually segregate in the sample. Further, a common approach to modeling how deleterious variants affect complex traits (Eyre-Walker 2010) assigns mutational effects on a trait as a function of their effects onfitness. This approach has been widely used to quantify the architecture of complex traits (Morriset al.2012; Mancusoet al.2016), to study the ef-fects of demography on traits (Lohmueller 2014a; Simons
et al.2014), and to assess the power of rare variant
of these models depend on having accurate estimates of the DFE.
Additionally, the DFE determines the extent to which background selection affects patterns of neutral variation. Accurately characterizing the reduction in diversity (i.e., ef-fective population sizeNe) should reduce bias when trying to learn the true demography of a population using sites linked to selected variants (Ewing and Jensen 2016; Schrideret al. 2016). We used a deterministic approximation (Nicolaisen and Desai 2013) of the models of Zeng and Charlesworth (2011) to contrast the effects of background selection pre-dicted from the DFE of Boykoet al.(2008) and the DFEs we inferred in our study (Figure S10 inFile S1). We computed the reduction inNe(i.e., increase in the rate of coalescence) as a function of time due to background selection for the two different mutation rates used in our inferences (m= 1.53 1028,LNS/LS= 2.31;m= 1.831028andLNS/LS= 2.5) as well as the higher deleterious mutation rate of McVickeret al. (2009):m= 7.431028, also assumingLNS/LS= 2.5. Impor-tantly, all the DFEs predict that background selection will reduce diversity and skew the SFS toward an excess of rare variants compared to models of constant population size (Figure S10 inFile S1). However, DFEs with fewer strongly deleterious mutations, like the bestfit DFEs to the ESP EUR and LuCamp data sets, predict less of an overall reduction in neutral diversity compared to Boykoet al.(2008). Further, the change in coalescent rates over time varies across DFEs, suggesting that the degree to which background selection affects the curvature of the SFS does depend on the specific DFE.
More broadly, our results have important implications for understanding and quantifying deleterious variants across human populations (Lohmueller et al. 2008; Lohmueller 2014b; Simonset al.2014; Doet al.2015). Specifically, the fate of strongly deleterious mutations is relatively insensitive to population demography. The fate of weakly and moder-ately deleterious mutations, however, is linked more closely with effective population size (Henn et al. 2016). Human evolution in particular is influenced by nearly neutral processes due to relatively small effective population sizes. Then, a DFE containing fewer strongly deleterious new muta-tions suggests the nature of purifying selection in humans may be different from what is currently understood. For example, larger proportions of moderately and weakly deleterious mu-tations may suggest greater differences in the proportion of segregating deleterious mutations and genetic load between human populations (Hennet al.2016). Accurate inferences of the DFE are critical in this regard as researchers begin to use explicit models of demography and selection to quantify dif-ferences in the amounts of deleterious variants across popula-tions (Brandvain and Wright 2016; Gravel 2016).
Acknowledgments
We thank Emilia Huerta-Sanchez, Diego Ortega-Del Vecchyo, and Noah Rosenberg, as well as two reviewers, for constructive
comments on the manuscript. This work was supported by a Searle Scholars Fellowship, an Alfred P. Sloan Re-search Fellowship in Computational and Molecular Bi-ology, and National Institutes of Health grant R35 GM-119856 to K.E.L.
Literature Cited
Aberer, A. J., and A. Stamatakis, 2013 Rapid forward-in-time sim-ulation at the chromosome and genome level. BMC Bioinfor-matics 14: 216.
Acevedo, A., L. Brodsky, and R. Andino, 2014 Mutational and
fitness landscapes of an RNA virus revealed through population sequencing. Nature 505: 686–690.
Bank, C., R. T. Hietpas, A. Wong, D. N. Bolon, and J. D. Jensen, 2014 A Bayesian MCMC approach to assess the complete dis-tribution of fitness effects of new mutations: uncovering the potential for adaptive walks in challenging environments. Genetics 196: 841–852.
Bataillon, T., and S. F. Bailey, 2014 Effects of new mutations on
fitness: insights from models and data. Ann. N. Y. Acad. Sci. 1320: 76–92.
Boucher, J. I., P. Cote, J. Flynn, L. Jiang, A. Laban et al., 2014 Viewing protein fitness landscapes through a next-gen lens. Genetics 198: 461–471.
Boyko, A. R., S. H. Williamson, A. R. Indap, J. D. Degenhardt, R. D. Hernandez et al., 2008 Assessing the evolutionary impact of amino acid mutations in the human genome. PLoS Genet. 4: e1000083.
Brandvain, Y., and S. I. Wright, 2016 The limits of natural selec-tion in a nonequilibrium world. Trends Genet. 32: 201–210. Castellano, D., M. Coronado-Zamora, J. L. Campos, A. Barbadilla,
and A. Eyre-Walker, 2016 Adaptive evolution is substantially impeded by Hill–Robertson interference in Drosophila. Mol. Biol. Evol. 33: 442–455.
Cherry, J. L., 1998 Should we expect substitution rate to depend on population size? Genetics 150: 911–919.
Chevin, L.-M., R. Lande, and G. M. Mace, 2010 Adaptation, plastic-ity, and extinction in a changing environment: towards a predictive theory. PLoS Biol. 8: e1000357.
Chikhi, L., R. A. Nichols, G. Barbujani, and M. A. Beaumont, 2002 Y genetic data support the Neolithic demic diffusion model. Proc. Natl. Acad. Sci. USA 99: 11008–11013.
Comeron, J. M., 2014 Background selection as baseline for nucle-otide variation across theDrosophilagenome. PLoS Genet. 10: e1004434.
Do, R., D. Balick, H. Li, I. Adzhubei, S. Sunyaevet al., 2015 No evidence that selection has been less effective at removing del-eterious mutations in Europeans than in Africans. Nat. Genet. 47: 126–131.
Ewing, G. B., and J. D. Jensen, 2016 The consequences of not accounting for background selection in demographic inference. Mol. Ecol. 25: 135–141.
Eyre-Walker, A., 2010 Genetic architecture of a complex trait and its implications forfitness and genome-wide association studies. Proc. Natl. Acad. Sci. USA 107: 1752–1756.
Eyre-Walker, A., and P. D. Keightley, 2007 The distribution of
fitness effects of new mutations. Nat. Rev. Genet. 8: 610–618. Eyre-Walker, A., M. Woolfit, and T. Phelps, 2006 The distribution
of fitness effects of new deleterious amino acid mutations in humans. Genetics 173: 891–900.