MULTIPARENTAL POPULATIONS
High-Resolution Genetic Mapping of Complex Traits
from a Combined Analysis of F
2
and Advanced
Intercross Mice
Clarissa C. Parker,*,1Peter Carbonetto,†,1Greta Sokoloff,†Yeonhee J. Park,†
Mark Abney,†and Abraham A. Palmer†,‡,2
*Department of Psychology and Program in Neuroscience, Middlebury College, Middlebury, Vermont 05753, and†Department of
Human Genetics and‡Department of Psychiatry and Behavioral Neuroscience, The University of Chicago, Chicago, Illinois 60637
ABSTRACT Genetic influences on anxiety disorders are well documented; however, the specific genes underlying these disorders
remain largely unknown. To identify quantitative trait loci (QTL) for conditioned fear and openfield behavior, we used an F2intercross (n= 490) and a 34th-generation advanced intercross line (AIL) (n= 687) from the LG/J and SM/J inbred mouse strains. The F2provided strong support for several QTL, but within wide chromosomal regions. The AIL yielded much narrower QTL, but the results were less statistically significant, despite the larger number of mice. Simultaneous analysis of the F2and AIL provided strong support for QTL and within much narrower regions. We used a linear mixed-model approach, implemented in the program QTLRel, to correct for possible confounding due to familial relatedness. Because we recorded the full pedigree, we were able to empirically compare two ways of accounting for relatedness: using the pedigree to estimate kinship coefficients and using genetic marker estimates of “realized relatedness.”QTL mapping using the marker-based estimates yielded more support for QTL, but only when we excluded the chro-mosome being scanned from the marker-based relatedness estimates. We used a forward model selection procedure to assess evidence for multiple QTL on the same chromosome. Overall, we identified 12 significant loci for behaviors in the openfield and 12 significant loci for conditioned fear behaviors. Our approach implements multiple advances to integrated analysis of F2and AILs that provide both power and precision, while maintaining the advantages of using only two inbred strains to map QTL.
A
NXIETY disorders are among the most prevalent psy-chiatric disorders in the world; in the United States, they affect the lives of 18% of the adult population (Demyttenaere et al.2004; Kessler et al.2005a,b). Many of these debilitating illnesses can be characterized by exagger-ations of normal and adaptive emotional response to fearful or stressful events (Mahan and Ressler 2012). Twin and family studies support a genetic basis for anxiety disorders, but attempts to identify the underlying genetic substrates have been disappointing—to date, genome-wide associa-tion studies (GWAS) have not reliably replicated candi-date genes associated with anxiety disorders (Hettemaet al.2011). As a result, we have little knowledge of the specific genes that underlie these disorders. Genetic loci relevant to these disorders may be difficult to map via GWAS be-cause anxiety disorders are only modestly heritable and, like many psychiatric conditions, are expected to behighly polygenic—that is, modulated by a large number of genetic factors with individually small effects (Sullivan et al.2012). Therefore, genetic contributions to anxiety are likely to be difficult to distinguish from correlations that occur by chance alone (Flint 2011; Parker and Palmer 2011; Flint and Eskin 2012).
While the full spectrum of any human psychiatric dis-order can never be fully recapitulated in a single mouse model, there is substantial behavioral, genetic, and neuro-anatomical conservation between humans and mice. When broken down into individual components, many of the symp-toms of anxiety disorders can be modeled in mice. Thus, translational mouse models can provide a powerful strategy for understanding the genetic and biological underpinnings of
Copyright © 2014 by the Genetics Society of America doi: 10.1534/genetics.114.167056
Manuscript received May 2, 2014; accepted for publication July 3, 2014
Supporting information is available online athttp://www.genetics.org/lookup/suppl/ doi:10.1534/genetics.114.167056/-/DC1.
1These authors contributed equally to this work.
2Corresponding author: Department of Human Genetics, University of Chicago, 920 E.
the acquisition of fear, as well as the etiologic processes related to anxiety (Kalueffet al.2007; Flint and Shifman 2008; Hovatta and Barlow 2008). Animal models provide similarly strong models for comorbidity of traits, like evidence for a shared genetic substrate in anxiety and fear. For example, selective breeding paradigms in mice and rats have shown that selection of anxiety-like behavior also selects for differences in fear and vice versa (Ponderet al.2007a; López-Aumatellet al.2009).
Reverse genetic approaches using genetically modified mice have been important for testing hypotheses about specific genes relevant to fear and anxiety, but they have tended to focus on the “usual suspects”underlying anxiety disorders. Alternatively, forward genetic approaches in mice have been developed to measure phenotypes and identify the underly-ing sources of standunderly-ing genetic variability in these pheno-types without prior hypotheses. However, forward genetic approaches have been less successful at identifying relevant genes. This may be because forward genetic studies in mice have traditionally used recombinant inbred (RI) lines, back-crosses (BC), or F2intercrosses to identify quantitative trait
loci (QTL)—in these experimental crosses, we can have high statistical power to detect genetic loci, but poor mapping resolution due to limited recombination (Chenget al.2010; Flint 2011; Parker and Palmer 2011).
To better pinpoint candidate genes and genetic loci that might influence anxiety, we mapped QTL in a combined F2
intercross and an F34advanced intercross line (AIL). An AIL
is created by successive generations of pseudorandom mat-ing after the F2generation. Each additional generation leads
to the accumulation of new recombinations, which allows for more precise mapping due to a breakdown in linkage disequilibrium. We show that our analysis not only yields strong support for several QTL in anxiety-related pheno-types, but also highlights a narrower set of candidate genes than previous studies of these phenotypes.
AILs have been employed in several previous studies to successfully map QTL for complex traits in mice, including locomotor activity (Chenget al.2010), muscle weight (Lionikas et al. 2010), red blood cell characteristics (Bartnikaset al. 2012), body weight (Parkeret al.2011), methamphetamine sensitivity (Parkeret al.2012a), prepulse inhibition (Samocha et al.2010), and the conditioned fear phenotypes studied in this article (Parkeret al.2012b). This study makes several key contributions over previous work in this area. First, we dem-onstrate that the combination of an F2intercross and a
34th-generation AIL allows us to map more QTL for conditioned fear and anxiety-related phenotypes and at a greater precision than our earlier study of an 8th-generation AIL (Parker et al. 2012b). Second, unlike previous studies, we use SNP data to account for the varying levels of genetic sharing that may confound detection of QTL. This is particularly relevant be-cause assessing evidence for QTL in an AIL population is more challenging than in traditional designs such as F2intercrosses
because varying levels of genetic sharing among individuals in the AIL can confound tests for association (Chenget al.2010). Third, we demonstrate the benefits of using marker data in
place of a pedigree to infer familial relationships in an AIL. We find that the linear mixed model with marker-based related-ness estimates yields greater support for QTL compared to using the pedigree to estimate genetic sharing, afinding that is consistent with a recent comparison of these approaches in simulated populations (Cheng and Palmer 2013). Finally, we show that a simple permutation test that assumes indepen-dence of the samples—that is, the permutation test ignores the varying levels of genetic sharing—provides an adequate way to assess significance of QTL in our AIL population.
Materials and Methods
Animals and housing
Subjects consisted of 487 F2 mice (249 males and 241
females) derived from a cross between LG/J and SM/J in-bred strains obtained from The Jackson Laboratories (Bar Harbor, ME) and 687 F34LG/J3SM/J AIL mice (353 males
and 334 females) derived from F33breeders obtained from
the laboratory of James Cheverud (Washington University, St. Louis). Three mice were later removed from the F2
co-hort because a high proportion of their markers were not reliably genotyped. The colony was maintained on a 12:12-hr light:dark cycle with lights on at 0630 hr. Mice were housed in clear acrylic cages with corn-cob bedding in same-sex groups of 2–5 mice with food and water availablead libitum. The full pedigree of all AILs was recorded so that the ancestry of each mouse could be traced back to the inbred founders.
To produce F34mice from the F33breeders, we mated the
F33mice such that no mating pairs shared a common
grand-parent. (In subsequent generations, which are not described in this article, we selected pairs of mice for breeding that produced the smallest possible inbreeding coefficients in the offspring. This was achieved using R code written by Andrew Skol, which we have made available at http://github.com/ pcarbo/breedail.)
Behavioral testing
Behavioral testing in all mice was always conducted during the light phase, between 0800 and 1700 hr. We waited for the mice to acclimatize to the testing room for at least 30 min before beginning the tests. Mice were2–3 months of age on the first day of behavioral testing (F2range was
53–71 days; AIL range was 50–76 days). All mice went through an identical testing sequence: first, we measured openfield (OF) behavior as part of a locomotor testing par-adigm (Bryant et al. 2012); 1 week later, we began the conditioned fear (CF) paradigm. All experiments were per-formed in accordance with the National Institutes of Health guidelines for care and use of laboratory animals. Experimental procedures were approved by the University of Chicago’s In-stitutional Animal Care and Use Committee.
OF
2011). Briefly, after 30 min of acclimation to the testing room, mice were removed from the home cage and placed into individual holding cages for 5 min, and then they were weighed individually, injected i.p. with physiological saline (0.01 ml/g body weight), and immediately placed in the center of the OF (AccuScan Instruments, Columbus, OH). Each OF was housed inside a sound-attenuating environ-mental chamber (AccuScan Instruments) with overhead light-ing providlight-ing illumination (80 lux) and a fan in the rear wall providing ventilation. Mice were tested in the OF arena (40340330 cm) for 30 min during the locomotor test. The first 10 min were used to measure OF behavior. We measured three phenotypes (Versamax, AccuScan Instruments): (1) dis-tance traveled (centimeters) in the periphery (width: 10 cm), (2) distance traveled (centimeters) in the center (20 3 20 cm), and (3) proportion of time spent in the center of the arena. We mapped QTL for these three phenotypes. After testing, mice were returned to their home cage, and thefield was cleaned with 10% isopropanol before the next mouse was tested. At the end of testing, mice were returned to the vivarium. Distance traveled from this same session was also analyzed in a previous article (Chenget al.2010).
CF
CF procedures were identical to those described previously (Ponderet al.2007a). Briefly, mice were tested in standard CF chambers (29 3 19 3 25 cm) housed within sound-attenuating chambers (Med Associates, St. Albans, VT). Lights in each chamber provided dim illumination (3 lux), and fans provided a low level of masking background noise. Chambers were cleaned with 10% isopropanol between animals. Behavior was digitally recorded by a computer and subsequently ana-lyzed with FreezeFrame software (Actimetrics, Evanston, IL).
Testing for CF consisted of a 5-min test that occurred three times over three consecutive days. After habituating to the procedure room for 30 min in their home cages, mice were transferred to the CF chambers in individual holding cages. On day 1, baseline freezing (“pretraining freezing”) was measured beginning 30 sec after mice were placed in the test chambers and ending 150 sec later. After the pre-training period, mice were exposed twice to the conditioned stimulus (CS), a 30-sec tone (85 dB, 3 kHz) that cotermi-nated with the unconditioned stimulus (US), a 2-sec, 0.5-mA foot shock delivered through the stainless steel floor grid. After each CS–US pairing, there was a 30-sec period in which no stimuli were delivered to the subject.
Test day 2 began exactly 24 hr after the start of test day 1. The testing environment was identical to that of day 1, except that neither tones nor shocks were presented. Pro-portion of time freezing in response to the test chamber (“% freezing to context”) was measured over the same time period as pretraining freezing (30–180 sec). We chose this time pe-riod to permit immediate comparison to the pretraining freez-ing scores on day 1 and to avoid measurfreez-ing freezfreez-ing behavior during the latter part of the trial in which the mice might have anticipated shocks based on tests from previous days.
Test day 3 began exactly 24 hr after the start of test day 2. On day 3, the context was altered in several ways: (1) a dif-ferent experimenter conducted the testing and wore a difdif-ferent style of gloves; (2) the transfer cages had no bedding; (3) the metal shock grid, chamber door, and one wall were covered with hard white plastic; (4) yellow film was placed over the chamber lights; (5) chambers and plastic surfaces were cleaned with 0.1% acetic acid solution; and (6) the vent fan was partially obstructed to alter background noise. On day 3, the tone was presented at the same times as on day 1, but there was no shock. We measured “freezing to cue,” which was defined as the average percentage of time spent freezing dur-ing the two 30-sec tone presentations (180–210 sec and 240– 270 sec).
Genotyping
DNA from the F2 mice was extracted by LGC Genomics
(Hoddesdon, Hertfordshire, UK; formerly KBiosciences). F2
genotypes were called using KASPar, a fluorescence-based PCR assay (LGC Genomics), at 162 evenly spaced markers on autosomal and X chromosomes. These markers are a sub-set of the 1638 SNPs suggested by Petkovet al. (2004) for QTL mapping in mouse strains. AIL genotypes at 4601 SNPs on autosomal and X chromosomes were ascertained using an Illumina Infinium Platform (iSelect) custom genotyping array (http://www.illumina.com), as described previously (Cheng et al. 2010). To avoid having to impute unascer-tained genotypes in the AIL mice, we discarded 7 of the 162 SNPs genotyped in the F2cohort that were not genotyped
in the F34samples. Of thefinal set of 4601 candidate SNPs,
4535 (98.6%) correspond to SNPs in the dbSNP reference database (Sherryet al.2001). A list of SNPs used in the pres-ent study is available at the Mouse Phenome Database (http:// phenome.jax.org) under project name“Chicago1”(http:// phenome.jax.org/db/q?rtn=projects/projdet&reqprojid=316). The Chicago1 data set includes8200 SNPs; of these, 4601 are polymorphic between LG/J and SM/J mice. All SNP identifiers and locations of the SNPs reported in this article are based on release 37 (July 2007) of the NCBI Mouse Genome Assembly. Average SNP allele frequencies in the F2and F34cohorts
were 0.50 and 0.51, respectively, indicating little unin-tended selection or genetic drift. As expected, we observed greater variation in allele frequencies in the F34cross; SNP
allele frequencies in F2 mice ranged from 0.45 to 0.54,
whereas allele frequencies in F34mice ranged from 0.12 to
0.90. (See Chenget al.2010 for further discussion of genetic drift in the F34AIL.)
Genotypes called with lower confidence were removed and treated as missing. In the F2mice, ,1% of the
geno-types were treated as missing. At most 9% of genogeno-types were missing for any single SNP and at most 26% in any F2mouse (after removing the three mice with a large
frac-tion of poor-quality genotype calls). In the F34mice, 1% of
Genotype imputation
To analyze the combined data, we estimated the probabil-ities of missing genotypes and the genotypes of SNPs that were called in the F34mice and not called in the F2mice.
Probabilities of missing or unavailable genotypes in the F2
and F34 crosses were estimated based on correlation
pat-terns with available genotypes, using recombination models for autosomal chromosomes in advanced intercrosses (Darvasi and Soller 1995). Genotype probabilities were calculated separately in F2and F34crosses as they exhibited different
patterns of recombination. Even though only a small fraction of the full set of SNPs were genotyped in the F2mice (155 of
4601), this small panel of SNPs was mostly sufficient to accurately estimate genotypes at other SNPs, since F2
chro-mosomes experience little recombination, and most alleles occur at high frequencies. In the F2mice, 85% of genotypes
were imputed with high confidence (maximum genotype probability .0.9). Only a small fraction of SNPs were im-puted less accurately, presumably because they were not in sufficient linkage disequilibrium with a SNP genotyped in the F2mice; for 109 SNPs (2.4%),,20% of the genotypes
in the F2mice were estimated with high confidence
(maxi-mum genotype probability .0.9). Since we accounted for genotype uncertainty in the QTL mapping, the contribution of each sample to the association signal was appropriately adjusted to reflect the confidence of the genotype estimates. We used the Haley–Knott approximation (Broman and Sen 2009) to account for uncertainty in missing genotypes. Note that we did not perform interval mapping to assess support for QTL between markers.
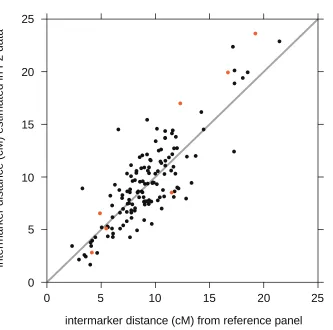
Estimation of missing genotypes requires genetic distance estimates at all markers. We used the genetic distance estimates from the reference panel described in Coxet al.(2009). These estimates were retrieved from the Mouse Map Converter hosted at Jackson Laboratories (http://cgd.jax.org/mousemapconverter). We checked these genetic distances against intermarker distan-ces estimated from our F2genotypes. Estimates were obtained
using the Lander–Green method (Lander and Green 1987), as implemented in R/qtl (Broman and Sen 2009). Intermarker distances on the X chromosome were estimated using females only. Comparison of the two intermarker genetic distance estimates on X and autosomal chromosomes (Supporting Information,Figure S1) shows that they are well correlated (r= 0.85), and they do not exhibit any bias—that is, neither estimate is consistently larger or smaller than the other.
QTL mapping
Linear mixed model for QTL mapping:Individuals in an F2
cross are full sibs that share roughly the same amount of the genome, so it is common to map QTL using a simple linear regression approach that ignores familial relatedness. By contrast, genetic sharing can vary considerably in an AIL, so it is important to correct for possible confounding due to varied levels of relatedness (Abney et al. 2000; Cheng et al.2010). We used the QTLRel mixed-model framework,
which was developed for QTL mapping in AILs (Chenget al. 2010, 2011). What makes QTLRel different from a standard linear regression is the inclusion of a“polygenic effect”that captures how correlations in the phenotype are explained by genome-wide genetic sharing. QTLRel models the pheno-type as a linear combination of these variables: additive genotype (allele count), dominance genotype (0 = hetero-zygous, 1 = homozygous), additional covariates such as sex and coat color, the polygenic effect, and the residual. (Note that the X chromosome requires a separate treatment, as we explain below.) Fitting this model to the data involves esti-mating the n 3 n covariance matrix of the polygenic ef-fect, wherenis the number of samples. While the general expression for this covariance matrix is derived in Abney et al. (2000) for analyzing quantitative traits in an inbred population, that article suggests using a simpler expression in which only the additive and dominance terms are retained. Following this suggestion, the covariance matrix entry corre-sponding to pairs of individualsði;jÞissij¼2Fijs2a þ Dij;7s2d;
whereDij;k is the conditional probability of identity statekfor
pair ði;jÞ;otherwise known as the “condensed coefficient of identity”; Fij¼Dij;1þ ð1=2ÞðDij;3þDij;5þDij;7Þ þ ð1=4Þ
Dij;8 is the kinship coefficient for pairði;jÞ—i.e., the probability
that a pair of randomly chosen alleles from individualsiandj at the same autosomal locus are identical by descent (IBD); and
s2
a ands2dare parameters to befitted to the data.
QTLRel uses a two-step procedure tofit the mixed model to the data: first, the model parameters are estimated as-suming that no markers have an effect on the phenotype (the null hypothesis); second, for a given marker, the additive and dominance effects are estimated while the other model components arefixed to their values obtained from thefirst step, up to a scaling factor that is also estimated in this step. This is similar to the strategy used in EMMAX (Kang et al. 2010). [More recently, efficient methods have been developed to integrate modelfitting into a single step, which can some-times lead to improved power to detect QTL (see Lippertet al. 2011; Zhou and Stephens 2012)]. Once the model-fitting steps are completed, QTLRel uses the parameter estimates to com-pute the log-likelihood-ratio test statistic. For each SNP, we reported support for a genotype–phenotype association using the (base 10) logarithm of the likelihood ratio, commonly called the LOD score.
Since F2 crosses are approximately equally related to
each other, QTL mapping that does not account for familial relationships should yield similar results to those of QTLRel. To verify this, we compared our results in the F2 sample
using QTLRel against results from a linear regression model that did not include the polygenic component, implemented in R/qtl (Broman and Sen 2009). Conversely, ignoring re-latedness in the F34 and combined cohorts is expected to
yield very different QTL mapping results (Chenget al.2010).
(Abney et al. 2000; Cheng et al. 2010). Specifically, the additive and dominance variance components of this covari-ance matrix require estimates of the kinship coefficientFij
and identity coefficientDij;7for each pair of individualsði;jÞ:
We derived estimates of identity coefficients in two different ways, using the pedigree, and using the marker data. Algo-rithms to compute identity coefficients from the pedigree are far too complex for large pedigrees such as the one used here, so we applied the scalable approximation developed by Chenget al.(2010), building on Karigl (1981). Even this approximate algorithm was not sufficiently scalable for com-putation of coefficients for F2–F34pairs, so for each of these
pairs we assigned the identity coefficients to their expected values in an inbred cross,Fij¼1=2 andDij;7¼1=4:
One advantage of using the markers to estimate re-latedness was that it was much easier to compute identity coefficient estimates for all pairs of individuals. In keeping with other methods that use marker-based estimates of relatedness to correct for confounding due to population stratification or familial relationships (Yuet al.2006; Kang et al.2008; Lippertet al.2011; Listgartenet al.2012; Zhou et al. 2013), we included only the additive portion of the polygenic effect. The rationale is that dominance effects typ-ically make a much smaller contribution to the variance of a complex trait. Therefore, we needed to calculate only kin-ship coefficients. At a single locus, the estimate of 2Fij is
simply equal to the number of alleles that share the same state between individuals (2 if both genotypes are homozy-gous and the same, 0 if both genotypes are homozyhomozy-gous and different, and 1 in all other cases). This is equivalent to the number of alleles IBD, since the mice are crosses of inbred founders. Note that other marker-based estimates of the kinship coefficients have been used, and these are based on different derivations of the polygenic covariance matrix. To account for uncertainty in missing genotypes at a given marker, we calculated the expected number of shared alleles. The final marker-based kinship coefficient estimate was obtained by averaging over markers across the genome, excluding the X chromosome. To avoid“proximal contami-nation”when assessing evidence for a QTL at a given SNP, this SNP, and all nearby SNPs, should be excluded from estimation of the kinship coefficient (Listgartenet al. 2012; Chenget al.2013; Yanget al.2014). We accomplished this by omitting markers on the same chromosome to estimate re-latedness. Therefore, we fitted the mixed model to the data separately for each chromosome and used this mixed model only to quantify support for QTL on that chromosome.
Covariates: In all analyses, we included four covariates in the regression model of the phenotype: age (in days) and three binary traits, sex (1 = male, 0 = female), albino (1 = white coat color, 0 = non-white), and agouti (1 = agouti coat color, 0 = nonagouti). We found that coat color confounded some of the phenotype measurements obtained from video tracking; if we did not account for the effect of coat color, for some phenotypes we obtained strong evidence
for a QTL that mapped to a region overlapping theTyrgene on chromosome 7, which is the gene variant for the albino trait (Jackson 1994, 1997). Some phenotype and coat color observations were not recorded for some mice; at most 75 samples in any one phenotype were excluded from QTL map-ping due to missing phenotype or covariate values.
A larger proportion of F34mice showed less freezing to
context and freezing to cue than F2 mice. However, this
difference disappeared if we excluded albino mice, reinforc-ing the importance of includreinforc-ing coat color traits as covariates in the QTL mapping. We observed no systematic differences in distributions of other phenotypes from the F2 and F34
crosses.
Transformation of quantitative traits:We mapped QTL for six phenotypes: the three measurements recorded in open field testing (distance traveled in the periphery, distance traveled in the center, and percentage of time in the center of the arena) and the three measurements from our con-ditioned fear tests (pretraining freezing, freezing to context, and freezing to cue). Four of these phenotypes (percentage of time in center, pretraining freezing, freezing to context, and freezing to cue) are proportions between 0 and 1. To obtain numbers on the real line, and to admit a normal model for these phenotypes, we transformed the pro-portions to the log-odds scale using the logit function, logitðxÞ ¼ logðx=ð12xÞÞ:To avoid extreme values after the transformation, any proportions ,0.01 or.0.99 were fixed to 0.01 and 0.99, respectively. Observed quantiles of the transformed phenotypes, separately in the F2 and F34
crosses, after removing linear effects of the covariates, closely matched expected quantiles under the normal distri-bution (results not shown), suggesting that the normal dis-tribution was a goodfit for these phenotypes.
Determining significance of genotype–phenotype associa-tions: To calculate significance thresholds for the LOD scores, we must first obtain the distribution of this test statistic under the null distribution. This distribution is commonly estimated by permuting the phenotype values relative to the genotypes (Broman and Sen 2009). However, this approach will not preserve the covariance structure in the samples that is due to unequal relatedness of the individuals and therefore may lead to inadequately strin-gent significance thresholds and inflated type 1 error rates (Abneyet al.2002; Zouet al.2005; Aulchenkoet al.2007; Chenget al.2010; Cheng and Palmer 2013). A simple alter-native to this approach would be to use a Bonferroni correc-tion of the P-values calculated from the test statistics. But this would lead to overly stringent significance thresholds because it would ignore correlations between the markers— that is, it would ignore the fact that the association tests are not independent.
reasonably accurate significance thresholds because (1) we do not observe systematic population stratification in the AIL (e.g., clusters of samples that are more related to each other than they are to other mice) and (2) no individuals are closely related to each other (e.g., no mice from the same litter). Careful inspection of our marker-based estimates of kinship coefficients confirms that expectations 1 and 2 do not apply to our AIL. Therefore, we performed permutation-based tests using R/qtl, ignoring unequal relatedness of the individuals (note that the tests for association still used the full-relatedness model). To obtain an estimate for the signif-icance threshold at the 100(12a)th percentile of the test statistic, with a = 0.05, we recorded the maximum LOD score for each permutation replicate and defined the signif-icance threshold to be the empirical percentile obtained from 1000 maximum LOD scores, following the recommen-dation of Churchill and Doerge (1994).
To provide an independent validation of this significance threshold, which is based on the assumption that the sam-ples are exchangeable, we compared it against a more com-putationally intensive permutation test that accounts for relatedness among individuals (Cheng et al. 2010; Cheng and Palmer 2013), similar to the permutation test proposed by Aulchenko et al. (2007). This permutation procedure differs from the standard method in two key ways: (1) it estimates parameters of a “null” model that includes the polygenic effect, in which kinship coefficients are calculated using the markers, and (2) instead of permuting the pheno-types,it permutes the genotypes,which preserves the relation-ship between phenotype and polygenic effect. (Note that the accuracy of this permutation procedure hinges on how well the polygenic covariance matrix captures the true covariance structure in the phenotype, which is, of course, unknown.) Following our procedure described above, wefitted a sepa-rate mixed model for each chromosome during the permu-tation tests to avoid the problem of proximal contamination. InResults, we show empirically that this more sophisticated permutation-based test produced significance thresholds that closely corresponded to the thresholds obtained from the much simpler permutation procedure using R/qtl.
QTL regions: We used a 1.5-LOD support interval to ap-proximate the confidence interval for the location of the QTL. This is a slightly smaller interval than the suggested 1.8-LOD interval based on simulations in two intercrosses, although in practice the best interval for each QTL de-pends on a number of factors, including the QTL effect size (Manichaikulet al. 2006). The main reason we chose this interval was to be consistent with our previous studies using AIL mice (e.g., Parkeret al.2011; Bartnikaset al.2012).
Assessment of multiple QTL: For several phenotypes, the initial genome-wide scan indicated appreciable support for QTL at multiple locations on the same chromosome. However, testing each marker one at a time cannot indicate whether there is support for multiple QTL on a chromosome.
To address this question, we included the SNP with the highest LOD score as a covariate, and then we recalculated the LOD scores for all other SNPs on the same chromosome. We repeated this procedure for each of the 30 QTL regions identified in the initial genome-wide scans for the six phenotypes.
X chromosome: QTL mapping must be performed differ-ently in the X chromosome due to differences in males and females (Broman and Sen 2009; Wise et al.2013) and due to recombination frequencies that are specific to the X chro-mosome (Broman 2012). Therefore, a proper analysis of the X chromosome that corrects for confounding due to familial relationships is beyond the capabilities of QTLRel. Nonethe-less, we used QTLRel to obtain rough estimates of support for QTL to investigate whether there was a suggestion that markers might warrant further investigation. To adapt the mixed model to analyze the X chromosome, we included sex as an interactive covariate—that is, we included separate additive and dominance effects for males and females. We then estimated the null distribution of the test statistic using the same model (without marker effects), using 1000 per-mutation replicates as before. Note that this model has one too many degrees of freedom (there is no need to include both additive and dominance terms in hemizygous males since there are only two possible genotypes), so our analysis was overly conservative, and one could improve on our X chromosome analysis, for example, following the approach of Pan et al.(2007). On the X chromosome, we computed genotype probabilities for missing genotypes separately for females and hemizygous males.
Bioinformatics databases:To identify genes containing non-synonymous coding SNPs within 1.5-LOD support intervals, we used sequence data for LG/J and SM/J inbred strains generously provided by James Cheverud and Heather Lawson from the Genome Sequencing Center at Washington University [http://genome.wustl.edu(Norgardet al.2011)].
The full code and data reproducing the steps of the analyses are available for download at http://github.com/ pcarbo/lgsmfear.
Results
QTL mapping for openfield and conditioned fear phenotypes
the F34 advanced intercross, and in the combined sample
(Figure 1, Figure 2, and Table 1).
In the analysis of the combined sample, we identified a total of 24 QTL exceeding significance thresholds (we discuss the significance thresholds in greater detail below). Specifically, we identified 12 QTL for OF phenotypes and 12 QTL for CF phenotypes, and we identified at least 1 QTL for each of the six behavioral traits.
Our analysis did not yield any compelling QTL on the X chromosome; the largest LOD score, 4.6, for the phenotype
“percentage of time spent in center,”was considerably below the significance threshold, 5.7 (ata= 0.05). Since sex-linked chromosomes require a separate treatment from that of au-tosomal chromosomes, X chromosome results are not shown in Table 1, Figure 1, and Figure 2. (Note that our analysis of the X chromosome was probably overly conservative, and an improved analysis of the X chromosome correcting for relat-edness could yield stronger support for QTL; see Materials and Methodsfor more details.)
The initial genome-wide scan (Figure 1 and Figure 2) identified multiple distinct regions located on the same chro-mosome containing significant QTL (Table 1). In all cases ex-cept one—chromosome 2 for freezing to cue—support for a second QTL fell short of our significance thresholds once we conditioned on the estimated effect of the peak SNP from the same chromosome. Table 1 gives two regions on chromosome 17 that each show strong evidence for containing a QTL for freezing to context, although we have sufficient support for a QTL in only one of the two loci.
Several phenotypes were associated with regions that ap-pear to overlap each other (Table 1). However, the QTL map-ping did not yield sufficient resolution to determine whether the overlapping QTL regions highlight the same gene or genes. Be-low, we examine some of the more interesting overlapping QTL. Most of the QTL with the strongest support from the com-bined sample were also identified using the F2sample alone.
One exception was the QTL for freezing to cue on chromo-some 2. This locus showed no appreciable association signal in the F2sample, but strong support from the F34data.
In the F2analyses, each of the QTL regions (based on
1.5-LOD support intervals) covered a large portion of the chromo-some, owing to limited recombination in F2crosses. Compared
to the QTL regions in the F2cross, the QTL were much
nar-rower in the F34alone. However, few SNPs reached the
thresh-old for significance ata= 0.05, owing to a loss of power due to many more candidate haplotypes. By comparison, in the combined analysis, we identified 24 QTL with narrow 1.5-LOD support intervals, ranging in size from 1.7 Mb to 29.4 Mb and with a median interval length of 4.3 Mb. Of these, 13 QTL had support intervals,5 Mb in length. The number of annotated genes within these intervals ranged from 10 to 236, with a median of 71 genes.
As expected, support for QTL in the F2 sample for the
most part did not change appreciably when we accounted for possible confounding due to relatedness; F2crosses are
full sibs with respect to one another and hence are expected
to exhibit roughly the same amount of genetic sharing. None-theless, there were several cases where support for a QTL increased notably in the F2cross after accounting for varying
relatedness and occasionally yielded a significant QTL only after correcting for relatedness. This comparison was not sys-tematic, nor did we experience a uniform increase in support across the genome after correcting for relatedness. Nonethe-less, this hints at the potential gains in applying mixed models to conventional intercrosses—a topic that we plan to explore in greater depth in subsequent work.
Since we had kept track of the complete pedigree for the F34
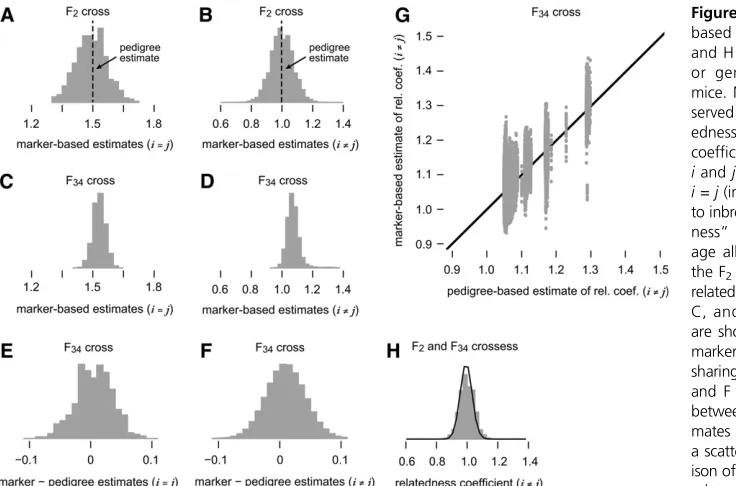
mice, we were able to compare the QTL mapping results, cor-recting for relatedness using (1) marker-based estimates of the kinship coefficients and (2) pedigree-based estimates. Both ana-lyses showed broad agreement; compare the dark blue and light red lines in Figure 1, J–L, and Figure 2, M–O. In several regions, the association signal was considerably stronger in the analysis using marker-based estimates. A notable exception to this tendency was the QTL on chromosome 4 for freezing to cue. These results are consistent with a more systematic com-parison of pedigree- and marker-based estimates of relatedness for QTL mapping in simulated populations (Chenget al.2013). Comparison of the pedigree- and marker-based estimates of the kinship coefficients also offers the opportunity to point out some features of the marker-based estimates. Figure 3 shows the distribution of pairwise relatedness coefficientsRij¼ 2Fij
in the F2and F34crosses. First, using the marker data we were
able to predict that some F2mice share a greater proportion of
their genome than others (Figure 3B), whereas pedigree-based estimates of sharing are all identical, as the relationship to the inbred founders is the same for all F2crosses. (For any F2cross,
pairwise relatedness is Rii¼3=2 and Rij¼ 1;for i6¼j; see
Lange 2002.) By comparison, using the marker data we predict much less variation in genetic sharing between pairs of F34
-generation mice (compare Figure 3B with Figure 3D). This was expected because of the greater number of accumulated crossovers in the F34 mice. Second, we observed that the
marker-based estimates were for the most part unbiased; dif-ferences in the marker- and pedigree-based estimates were centered near zero (see Figure 3, A, B, E, and F). Even though the genetic sharing estimates in F34AIL mice agreedon
aver-age, the estimates did not agree in a large proportion of the samples—the scatterplot (Figure 3G) illustrates this point in detail. The larger discrepancies in the sharing estimates may explain the differences observed in the QTL mapping (Figure 1 and Figure 2). Finally, the marker data allowed us to estimate sharing for F2–F34 pairs of mice (Figure 3H), whereas these
calculations are very complex using the pedigree data (and would not have been meaningful in this case because the F2
are not the direct progenitors of the F34).
Cheng and Palmer 2013), as they are here, we have assessed empirically in our AIL that the distribution of the test statistic under the null is similar regardless of whether the permuta-tions account for relatedness (Figure 1 and Figure 2). One possible explanation why the standard permutation test seems to adequately control for type 1 error in our AIL sample is that we have carefully avoided including highly related mice—in partic-ular, no mice share a common grandparent—unlike our previous AIL studies (e.g., Chenget al.2010; Cheng and Palmer 2013).
In summary, the combined analysis identified more QTL than either the F2or the F34samples alone (due in part to
a larger sample size). Importantly, the combined analysis located the QTL within narrower regions compared to those identified from the F2mice alone.
Sequence analysis
We examined our 1.5-LOD support intervals for the pres-ence of “consequential”SNPs that had the potential to di-rectly alter proteins (i.e., nonsynonymous coding, stop-gain, stop-lost, frameshift, and splice sites). The number of genes with consequential SNPs in significant QTL intervals ranged from 1 to 59, with a median of 12 genes (Table S1). Figure 1 Openfield behavior and genome-wide map of openfield behavioral traits in LG/J3SM/J F2, F34, and combined cohorts. A–C summarize open
field (OF) testing. Mice were placed in the center of the openfield arena, and the following measurements were made in thefirst 10 min of testing: (A)
distance traveled (centimeters) in the periphery, (B) distance traveled (centimeters) in the center, and (C) percentage of time spent in the center. Error
bars represent standard error. D–L show genome-wide association signal from F2samples alone (D–F), from F34samples alone (G–I), and from combined
F2+ F34cohort (J–L). In all panels, dark blue lines show LOD scores (log10likelihood ratio) at each genotyped marker. These LOD scores are calculated
using marker-based estimates of pairwise relatedness. In D–F, the light blue line shows LOD scores obtained when ignoring hidden relatedness in F2
mice. In J–L, light red lines give LOD scores obtained using pedigree-based estimates of relatedness. For each genome-wide scan, we define the
significance threshold as the 95th percentile of the test statistic under the null (a= 0.05). We show significance thresholds obtained from null
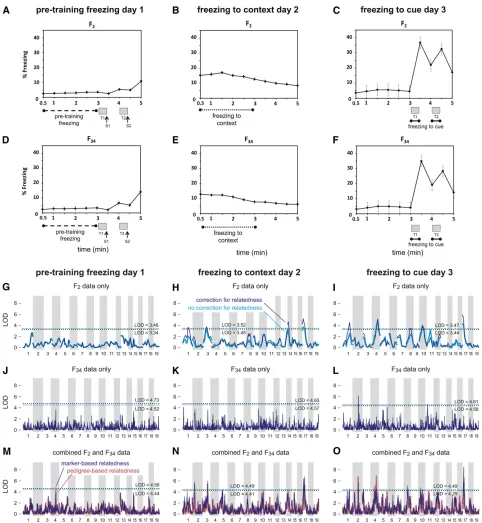
Figure 2 Conditioned fear and QTL genome-wide map of conditioned fear traits in LG/J3SM/J F2, F34, and combined cohorts. A–F summarize
conditioned fear (CF) testing in mice. A 3-day procedure was used to phenotype each subject. On day 1, a baseline indicator of freezing
tendency,“pretraining freezing,”was measured in F2(A) and F34(D) mice from 30 to 180 sec, after which mice were exposed to two 30-sec
tones (indicated by gray bars, labeled T1 and T2) that coterminated with a 2-sec, 0.5-mA foot shock (indicated by arrows, labeled S1 and S2). On
day 2, freezing to context was measured in F2(B) and F34(E) mice from 30 to 180 sec. On day 3, freezing to cue was measured in F2(C) and F34
(F); time spent freezing to each tone was averaged to obtain the freezing to cue variable (180–210 sec + 240–270 sec). Each data point
represents average percentage of freezing calculated across the 30-sec time bin; error bars represent standard error. G–O show the
genome-wide association signal from F2samples alone (G–I), from the F34samples alone (J–L), and from the combined F2+ F34cohort (M–O). See Figure 1
Tab le 1 QTL fo r ope n fi eld and con dition ed fear phen otypes Chr Peak LOD P eak SNP
1.5-LOD interval (Mb)
Discussion
We investigated the genetic basis of anxiety-like behavior, based on openfield and conditioned fear tests, in a combined F2and F34AIL mouse population. To map QTL across the
genome, we analyzed phenotypes using a linear mixed mod-el that accounts for differences in genetic sharing, an impor-tant confounding factor in tests for association. Taking this mixed-model approach, we identified a total of 24 QTL affecting six traits related to fear and anxiety-like behavior. Because our study maintained uniform environmental con-ditions and ensured alleles with high frequency, we expect a limited contribution of gene–environment interactions to variation in these traits.
The integration of the F2 and F34populations provided
good power to detect QTL, presumably because of the F2
cross; and good resolution, presumably because of the F34
advanced intercross. The median size of a QTL region was 4.3 Mb. The QTL were slightly narrower than QTL intervals we identified in this population for other traits, such as red blood cell parameters [median 1.5-LOD support interval = 4.7 Mb (Bartnikas et al.2012)] and body weight [median 1.5-LOD support interval = 5.5 Mb (Parker et al.2011)].
In the 1.5-LOD intervals that contained#15 genes with coding SNPs, we searched for candidate genes that could plausibly explain the variation in the traits we measured. Some of the genes within these regions had coding SNPs known to be involved in anxiety-like behavior and/or con-ditioned fear; examples include the nuclear receptor sub-family 6, group A, member 1 gene [Nr6a1 (Heydendael et al. 2013)], the phospholipase D1 gene [Pld1(Sunet al. 2013)], the cadherin 23 gene [Cdh23 (Terracciano et al.
2010, but see Schwanderet al.2009)], the prosaposin gene [Psap (Hovatta et al. 2005; Donner et al. 2008)], and the SLIT and NTRK-like family, member 5 gene [Slitrk5(Shmelkov et al.2010)]. However, we are cautious about interpreting the functional relevance of nonsynonymous coding SNPs; we do not currently have expression QTL (eQTL) data that could be used to detect heritable regulatory polymorphisms. Thus, the current results are not sufficient to identify specific causal genes.
In two instances, contextual and cued fear mapped to overlapping chromosomal regions on chromosomes 2 and 17 (Figure S2andFigure S3) despite known differences in their neuroanatomical substrates (Fanselow and Ledoux 1999; Jovanovic and Ressler 2010). This may indicate the presence of alleles that influence both traits; alternatively, it could be due to different alleles that are located close to each other in the genome. We (Ponderet al.2007a,b; Sokoloff et al. 2011; Parkeret al.2012b) and others have reported similar results; Talbotet al.(2003) reported that contextual and cued fear were highly correlated (r= 0.63) in hetero-geneous stock mice, and selection for freezing to context has been shown to cause coincident changes in freezing to cue (Radcliffeet al.2000; Ponderet al.2007a). Thus, it is likely that contextual and cued fear are modulated by some of the same alleles, but further studies are needed to definitively identify the alleles that give rise to such correlations.
One of the underlying motivations for this study was the belief that a subset of alleles would pleiotropically influence both conditioned fear and anxiety-like behavior in the open field. Previous studies by our laboratory (Ponderet al.2007a,b; Sokoloff et al.2011) and other groups (Lopez-Aumatell Figure 3Comparison of marker- and
pedigree-based estimates of pairwise relatedness. A–D
and H show the extent to which relatedness, or genetic sharing, varies among the AIL
mice. More precisely, A–D and H give the
ob-served distributions of estimated pairwise
relat-edness coefficients, or two times the kinship
coefficients, for all pairs of mice (i,j) in which
iandjare different individuals (i6¼j) or when
i = j(in which case the coefficients correspond
to inbreeding levels). These are“realized
related-ness”estimates obtained by calculating
aver-age allele sharing over all SNPs genotyped in
the F2and F34crosses. Diagonal entries of the
relatedness matrix,Rii¼2Fii;are shown in A and
C, and off-diagonal entriesRij¼2Fij; i6¼j;
are shown in B, D, G, and H. To compare the marker-based estimates to the estimates of allele sharing obtained from the AIL pedigree data, in E
and F we show the distribution ofdifferences
between the marker-based and pedigree esti-mates of pairwise relatedness. In G we show a scatterplot providing a more detailed compar-ison of the marker- and pedigree-based pairwise
relatedness estimatesRij; i6¼j;in which each
point in the scatterplot corresponds to a pair of F34mice. In the F2cross, all pedigree-based pairwise relatedness estimates areRii¼1:5 andRij¼1:0;as
indicated in A and B. Finally, H shows the distribution of marker-based pairwise relatedness estimates for all F2–F34pairs, using only markers available in the
et al.2009) have indicated a shared genetic control of these two traits. The overlap between the QTL on chromosome 17 for conditioned fear (freezing to context and freezing to cue) and distance traveled in the periphery (Figure S3) provides some additional support for a shared genetic basis. Interest-ingly, we observed QTL on chromosome 2 for freezing to context and freezing to cue that were immediately adjacent to, but did not overlap with, the chromosome 2 QTL for distance traveled in the periphery (Figure S2). And in one case, the QTL on chromosome 4 for pretraining freezing showed modest overlap with the chromosome 4 QTL for dis-tance traveled in the center of the arena (Figure S4). How-ever, pretraining freezing (freezing before administration of any tones or shocks) is more indicative of unlearned anxiety rather than conditioned fear. The absence of regions common to several traits may indicate that in this population the ge-netic origin of fear and anxiety-like behavior is relatively dis-tinct, or it may reflect a lack of power to detect QTL, so we cannot interpret this result as implying that genes in these regions do not jointly affect these traits. An integrated anal-ysis of these traits [e.g., building on multivariate mapping approaches (Stephens 2013)] may yield an improved under-standing of how QTL modulate these anxiety-like behaviors and represents an important research direction.
Traditionally, F2intercrosses are used to identify QTL
un-derlying phenotypic variation, and fine-mapping is carried out as a second step, using congenic strains. This time- and labor-intensive effort to identify specific genes is often derailed by the discovery that a single QTL of large effect is in fact caused by multiple loci of small effect located in the same chromosomal region (Legare et al. 2000; Mott et al. 2000; Cheng et al. 2010; Shao et al. 2010; Parker et al. 2013). An AIL is an improvement over these traditional methods because it merges identification andfine-mapping into a single step, which can often discriminate between loci that are due to singlevs.multiple alleles (Darvasi and Soller 1995). The trade-off is that the power to detect QTL in AILs is often lower than in F2populations. This is because the AIL
mice experience greater numbers of crossover events than the F2mice, so more tests are performed, and a
correspond-ing higher threshold is needed to control for false positives. For example, a QTL was observed on chromosome 1 for freez-ing to context in the F2 intercross, but in the F34 AIL it
appeared to split into two smaller regions, neither of which had a LOD score exceeding significance. On the other hand, we observed a highly significant QTL peak in the F34 AIL
for freezing to cue that was not originally seen in the F2
intercross and was subsequently supported in the integrated analysis. While the advantages of an integrated analysis of an AIL have been shown in previous work, this study pro-vides further support for the benefits of this approach and can serve as a prototype for how to identify QTL in AILs using a mixed-model approach that accounts for related-ness, using marker data. (We have made available the code and data used to implement the steps of our analysis at http://github.com/pcarbo/lgsmfear.)
Our main methodological contribution was to show that we can use marker data in the place of a pedigree to infer familial relationships in an AIL. We found that mixed models using either pedigree- or marker-based estimates of relatedness showed broad agreement in the QTL mapping. While there has been a considerable amount of work demonstrating the benefits of marker-based estimates of“realized relatedness”to control for confounding due to population structure or due to familial relationships (Yuet al.2006; Kanget al.2008; Lippert et al.2011; Listgartenet al.2012; Zhouet al.2013), there has been little work on demonstrating these benefits in AILs. In this article, we did not aim for a systematic comparison of ap-proaches to correct for relatedness (for an empirical compar-ison in simulated data sets, see Chenget al.2013). Our results nonetheless suggest that it is better to use marker data to correct for relatedness, even when the full pedigree is available, provided genetic variation is ascertained at sufficient resolution throughout the genome. The marker-based estimates often yield more precise estimates of genetic sharing and are usually less costly to obtain.
Our study has several limitations. First, because we have used a cross between two inbred strains, we are studying the alleles that segregate between them and not the total number of alleles that segregate among other laboratory strains or wild mice. For example, we observed little overlap of QTL for conditioned fear between an F8AIL derived from
C57BL/6J3DBA/2J mice (Parkeret al.2012b) and the LG/ J 3 SM/J AIL in the present study. Nonetheless, we did observe some overlap in the QTL we identified in our pop-ulation with anxiety and fear-related QTL identified in other populations of mice (Table 1), consistent with the possibility that different two-strain combinations may segregate the same alleles. It is possible that some of the QTL identified in our study are the same as those identified by other re-searchers; one advantage of our study is that we have map-ped QTL with greater resolution than in previous studies.
Our approach has dramatically increased the mapping resolution compared to that in more conventional mapping populations. To further reduce the number of candidate genes within our intervals, we focused on genes with coding polymorphisms. However, it is important to note that the polymorphisms underlying the observed trait variance may be due to differences in gene expression, rather than alterations in gene function. For example, some QTL may be explained by SNPs that modulate the recruitment of proteins involved in regulation of gene transcription; studies of complex human traits have shown that a large fraction of the variants underlying these traits coincide with DNA sequences related to gene regulation (Nicolaeet al.2010; Schaubet al.2012). Availability of genome-wide eQTL data in the LG/J and SM/J strains may help pinpoint the genes underlying these QTL.
Acknowledgments
sequence data in the LG/J and SM/J mice. We also acknowl-edge Michaelanne Munoz, Tanya Cebollero, and Jackie Lim for help with husbandry and behavioral testing; Kaitlin Samocha for pedigree reconstruction; Karl Broman for advice on dealing with QTL mapping on the X chromosome; Xiang Zhou for technical help on the QTL mapping; Pei-Ting Wu for data entry; and Riyan Cheng and Andrew Skol for helping to develop QTLRel and calling of genotypes used in this study. Finally, we thank the reviewers for their helpful feedback. This work was supported by National Institutes of Health grants 5R01MH079103 (to A.A.P.) and R01HG002899 (to M.A.). P.C. was supported by a cross-disciplinary postdoctoral fellowship from the Human Frontiers Science Program.
Literature Cited
Abney, M., M. S. McPeek, and C. Ober, 2000 Estimation of
vari-ance components of quantitative traits in inbred populations.
Am. J. Hum. Genet. 66: 629–650.
Abney, M., C. Ober, and M. S. McPeek, 2002 Quantitative-trait
homozygosity and association mapping and empirical
genome-wide significance in large, complex pedigrees: fasting
serum-insulin level in the Hutterites. Am. J. Hum. Genet. 70: 920–934.
Aulchenko, Y. S., D.-J. de Koning, and C. Haley, 2007 Genomewide
rapid association using mixed model and regression: a fast and simple method for genomewide pedigree-based quantitative trait
loci association analysis. Genetics 177: 577–585.
Bartnikas, T. B., C. C. Parker, R. Cheng, D. R. Campagna, J. E. Limet al.,
2012 QTLs for murine red blood cell parameters in LG/J and SM/
J F2 and advanced intercross lines. Mamm. Genome 23: 356–366.
Broman, K. W., 2012 Haplotype probabilities in advanced
inter-cross populations. G3 2: 199–202.
Broman, K. W., and S. Sen, 2009 A Guide to QTL Mapping with
R-qtl. Springer-Verlag, Berlin/Heidelberg, Germany/New York. Bryant, C. D., C. C. Parker, L. Zhou, C. Olker, R. Y. Chandrasekaran
et al., 2012 Csnk1e is a genetic regulator of sensitivity to
psychos-timulants and opioids. Neuropsychopharmacology 37: 1026–1035.
Caldarone, B., C. Saavedra, K. Tartaglia, J. M. Wehner et al.,
1997 Quantitative trait loci analysis affecting contextual
con-ditioning in mice. Nat. Genet 17: 335–337.
Cheng, R., and A. A. Palmer, 2013 A simulation study of
permu-tation, bootstrap, and gene dropping for assessing statistical
significance in the case of unequal relatedness. Genetics 193:
1015–1018.
Cheng, R., J. E. Lim, K. E. Samocha, G. Sokoloff, M. Abneyet al.,
2010 Genome-wide association studies and the problem of
re-latedness among advanced intercross lines and other highly
recombinant populations. Genetics 185: 1033–1044.
Cheng, R., M. Abney, A. A. Palmer, and A. D. Skol, 2011 QTLRel:
an R package for genome-wide association studies in which re-latedness is a concern. BMC Genet. 12: 66.
Cheng, R., C. C. Parker, M. Abney, and A. A. Palmer, 2013 Practical
considerations regarding the use of genotype and pedigree data to model relatedness in the context of genome-wide association
studies. G3 3: 1861–1867.
Churchill, G. A., and R. W. Doerge, 1994 Empirical threshold
values for quantitative trait mapping. Genetics 138: 963–971.
Cox, A., C. L. Ackert-Bicknell, B. L. Dumont, Y. Ding, J. T. Bellet al.,
2009 A new standard genetic map for the laboratory mouse.
Genetics 182: 1335–1344.
Darvasi, A., and M. Soller, 1995 Advanced intercross lines, an
experimental population for fine genetic mapping. Genetics
141: 1199–1207.
Demyttenaere, K., R. Bruffaerts, J. Posada-Villa, I. Gasquet, V. Kovess et al., 2004 Prevalence, severity, and unmet need for treatment of mental disorders in the World Health Organization World
Mental Health Surveys. JAMA 291: 2581–2590.
Donner, J., S. Pirkola, K. Silander, L. Kananen, J. D. Terwilliger et al., 2008 An association analysis of murine anxiety genes in humans implicates novel candidate genes for anxiety
disor-ders. Biol. Psychiatry 64: 672–680.
Fanselow, M. S., and J. E. LeDoux, 1999 Why we think plasticity
underlying Pavlovian fear conditioning occurs in the basolateral
amygdala. Neuron 23: 229–232.
Flint, J., 2011 Mapping quantitative traits and strategies tofind
quantitative trait genes. Methods 53: 163–174.
Flint, J., and E. Eskin, 2012 Genome-wide association studies in
mice. Nat. Rev. Genet. 13: 807–817.
Flint, J., and S. Shifman, 2008 Animal models of psychiatric
dis-ease. Curr. Opin. Genet. Dev. 18: 235–240.
Hettema, J. M., B. T. Webb, A.-Y. Guo, Z. Zhao, B. S. Maheret al.,
2011 Prioritization and association analysis of murine-derived
candidate genes in anxiety-spectrum disorders. Biol. Psychiatry
70: 888–896.
Heydendael, W., A. Sengupta, S. Beck, and S. Bhatnagar,
2013 Optogenetic examination identifies a context-specific
role for orexins/hypocretins in anxiety-related behavior. Physiol.
Behav. 130: 182–190.
Hovatta, I., and C. Barlow, 2008 Molecular genetics of anxiety in
mice and men. Ann. Med. 40: 92–109.
Hovatta, I., R. S. Tennant, R. Helton, R. A. Marr, O. Singeret al.,
2005 Glyoxalase 1 and glutathione reductase 1 regulate
anx-iety in mice. Nature 438: 662–666.
Jackson, I. J., 1994 Molecular and developmental genetics of
mouse coat color. Annu. Rev. Genet. 28: 189–217.
Jackson, I. J., 1997 Homologous pigmentation mutations in human,
mouse and other model organisms. Hum. Mol. Genet. 6: 1613–1624.
Jones, B. C., L. M. Tarantino, L. A. Rodriguez, C. L. Reed, G. E. McClearn et al., 1999 Quantitative-trait loci analysis of cocaine-related
behaviors and neurochemistry. Pharmacogenetics 9: 607–17.
Jovanovic, T., and K. J. Ressler, 2010 How the neurocircuitry and
genetics of fear inhibition may inform our understanding of
PTSD. Am. J. Psychiatry 167: 648–662.
Kalueff, A. V., M. Wheaton, and D. L. Murphy, 2007 What’s wrong
with my mouse model? Advances and strategies in animal
mod-eling of anxiety and depression. Behav. Brain Res. 179: 1–18.
Kang, H. M., N. A. Zaitlen, C. M. Wade, A. Kirby, D. Heckerman et al., 2008 Efficient control of population structure in model
organism association mapping. Genetics 178: 1709–1723.
Kang, H. M., J. H. Sul, S. K. Service, N. A. Zaitlen, S.-Y. Konget al.,
2010 Variance component model to account for sample structure
in genome-wide association studies. Nat. Genet. 42: 348–354.
Karigl, G., 1981 A recursive algorithm for the calculation of
iden-tity coefficients. Ann. Hum. Genet. 45: 299–305.
Kessler, R. C., P. Berglund, O. Demler, R. Jin, K. R. Merikangas et al., 2005a Lifetime prevalence and age-of-onset distribu-tions of DSM-IV disorders in the National Comorbidity Survey
Replication. Arch. Gen. Psychiatry 62: 593–602.
Kessler, R. C., W. T. Chiu, O. Demler, K. R. Merikangas, and E. E.
Walters, 2005b Prevalence, severity, and comorbidity of
12-month DSM-IV disorders in the National Comorbidity Survey
Replication. Arch. Gen. Psychiatry 62: 617–627.
Lander, E. S., and P. Green, 1987 Construction of multilocus
ge-netic linkage maps in humans. Proc. Natl. Acad. Sci. USA 84:
2363–2367.
Lange, K., 2002 Mathematical and Statistical Methods for Genetic
Analysis. Springer-Verlag, Berlin/Heidelberg, Germany/New York.
Legare, M. E., F. S. Bartlett, and W. N. Frankel, 2000 A major
effect QTL determined by multiple genes in epileptic EL mice.
Lionikas, A., R. Cheng, J. E. Lim, A. A. Palmer, and D. A. Blizard,
2010 Fine-mapping of muscle weight QTL in LG/J and SM/J
intercrosses. Physiol. Genomics 42A: 33–38.
Lippert, C., J. Listgarten, Y. Liu, C. M. Kadie, R. I. Davidsonet al.,
2011 FaST linear mixed models for genome-wide association
studies. Nat. Methods 8: 833–835.
Listgarten, J., C. Lippert, C. M. Kadie, R. I. Davidson, E. Eskinet al.,
2012 Improved linear mixed models for genome-wide
associ-ation studies. Nat. Methods 9: 525–526.
López-Aumatell, R., E. Vicens-Costa, M. Guitart-Masip, E.
Martínez-Membrives, W. Valdaret al., 2009 Unlearned anxiety predicts
learned fear: a comparison among heterogeneous rats and the
Roman rat strains. Behav. Brain Res. 202: 92–101.
Mahan, A. L., and K. J. Ressler, 2012 Fear conditioning, synaptic
plasticity and the amygdala: implications for posttraumatic
stress disorder. Trends Neurosci. 35: 24–35.
Manichaikul, A., J. Dupuis, S. Sen, and K. W. Broman, 2006 Poor
performance of bootstrap confidence intervals for the location of
a quantitative trait locus. Genetics 174: 481–489.
Mott, R., C. J. Talbot, M. G. Turri, A. C. Collins, and J. Flint,
2000 A method forfine mapping quantitative trait loci in
out-bred animal stocks. Proc. Natl. Acad. Sci. USA 97: 12649–12654.
Nakamura, K., Y. Xiu, M. Ohtsuji, G. Sugita, M. Abe et al.,
2003 Genetic dissection of anxiety in autoimmune disease.
Hum. Mol. Genet. 12: 1079–86.
Nicolae, D. L., E. Gamazon, W. Zhang, S. Duan, M. E. Dolanet al.,
2010 Trait-associated SNPs are more likely to be eQTLs:
annota-tion to enhance discovery from GWAS. PLoS Genet. 6: e1000888. Norgard, E. A., H. A. Lawson, L. S. Pletscher, B. Wang, V. R. Brooks et al., 2011 Genetic factors and diet affect long-bone length in the
F34 LG,SM advanced intercross. Mamm. Genome 22: 178–196.
Palmer, A. A., M. Verbitsky, R. Suresh, H. M. Kamens, C. L. Reedet al.,
2005 Gene expression differences in mice divergently selected
for methamphetamine sensitivity. Mamm. Genome 16: 291–305.
Pan, L., C. Ober, and M. Abney, 2007 Heritability estimation of
sex-specific effects on human quantitative traits. Genet.
Epide-miol. 31: 338–347.
Parker, C. C., and A. A. Palmer, 2011 Dark matter: Are mice the
solution to missing heritability? Front. Genet. 2: 32.
Parker, C. C., R. Cheng, G. Sokoloff, J. E. Lim, A. D. Skolet al.,
2011 Fine-mapping alleles for body weight in LG/J3SM/J F2
and F34 advanced intercross lines. Mamm. Genome 22: 563–571.
Parker, C. C., R. Cheng, G. Sokoloff, and A. A. Palmer, 2012a
Genome-wide association for methamphetamine sensitivity in an advanced
intercross mouse line. Genes Brain Behav. 11: 52–61.
Parker, C. C., G. Sokoloff, R. Cheng, and A. A. Palmer, 2012b
Genome-wide association for fear conditioning in an advanced intercross
mouse line. Behav. Genet. 42: 437–448.
Parker, C. C., G. Sokoloff, E. Leung, S. L. Kirkpatrick, and A. A.
Palmer, 2013 A large QTL for fear and anxiety mapped using
an F2 cross can be dissected into multiple smaller QTLs. Genes
Brain Behav. 12: 714–722.
Petkov, P. M., Y. Ding, M. A. Cassell, W. Zhang, G. Wagneret al.,
2004 An efficient SNP system for mouse genome scanning and
elucidating strain relationships. Genome Res. 14: 1806–1811.
Ponder, C. A., C. L. Kliethermes, M. R. Drew, J. Muller, K. Daset al.,
2007a Selection for contextual fear conditioning affects
anxiety-like behaviors and gene expression. Genes Brain Behav. 6: 736–749.
Ponder, C. A., M. Munoz, T. C. Gilliam, and A. A. Palmer,
2007b Genetic architecture of fear conditioning in chromosome
substitution strains: relationship to measures of innate (unlearned)
anxiety-like behavior. Mamm. Genome 18: 221–228.
Radcliffe, R. A., M. V. Lowe, and J. M. Wehner, 2000 Confirmation
of contextual fear conditioning QTLs by short-term selection.
Behav. Genet. 30: 183–191.
Samocha, K. E., J. E. Lim, R. Cheng, G. Sokoloff, and A. A. Palmer,
2010 Fine mapping of QTL for prepulse inhibition in LG/J and
SM/J mice using F2 and advanced intercross lines. Genes Brain
Behav. 9: 759–767.
Schaub, M. A., A. P. Boyle, A. Kundaje, S. Batzoglou, and M.
Snyder, 2012 Linking disease associations with regulatory
in-formation in the human genome. Genome Res. 22: 1748–1759.
Schwander, M., W. Xiong, J. Tokita, A. Lelli, H. M. Elledgeet al.,
2009 A mouse model for nonsyndromic deafness (DFNB12)
links hearing loss to defects in tip links of mechanosensory hair
cells. Proc. Natl. Acad. Sci. USA 106: 5252–5257.
Shao, H., D. S. Sinasac, L. C. Burrage, C. A. Hodges, P. J. Supelak et al., 2010 Analyzing complex traits with congenic strains.
Mamm. Genome 21: 276–286.
Sherry, S. T., M. H. Ward, M. Kholodov, J. Baker, L. Phanet al.,
2001 dbSNP: the NCBI database of genetic variation. Nucleic
Acids Res. 29: 308–311.
Shmelkov, S. V., A. Hormigo, D. Jing, C. C. Proenca, K. G. Bath et al., 2010 Slitrk5 deficiency impairs corticostriatal circuitry and leads to obsessive-compulsive-like behaviors in mice. Nat.
Med. 16: 598–602.
Sokoloff, G., C. C. Parker, J. E. Lim, and A. A. Palmer, 2011 Anxiety
and fear in a cross of C57BL/6J and DBA/2J mice: mapping over-lapping and independent QTL for related traits. Genes Brain
Behav. 10: 604–614.
Stephens, M., 2013 A unified framework for association analysis
with multiple related phenotypes. PLoS ONE 8: e65245.
Sullivan, P. F., M. J. Daly, and M. O’Donovan, 2012 Genetic
ar-chitectures of psychiatric disorders: the emerging picture and its
implications. Nat. Rev. Genet. 13: 537–551.
Sun, L., H. L. Gooding, P. J. Brunton, J. A. Russell, R. Mitchellet al.,
2013 Phospholipase D-mediated hypersensitivity at central
syn-apses is associated with abnormal behaviours and pain sensitivity in
rats exposed to prenatal stress. Int. J. Biochem. Cell Biol. 45: 2706–
2712.
Talbot, C. J., R. A. Radcliffe, J. Fullerton, R. Hitzemann, J. M.
Wehner et al., 2003 Fine scale mapping of a genetic locus
for conditioned fear. Mamm. Genome 14: 223–230.
Terracciano, A., S. Sanna, M. Uda, B. Deiana, G. Usala et al.,
2010 Genome-wide association scan forfive major dimensions
of personality. Mol. Psychiatry 15: 647–656.
Thifault, S., S. Ondrej, Y. Sun, A. Fortin, E. Skamene et al.,
2008 Genetic determinants of emotionality and stress response
in AcB/BcA recombinant congenic mice and in silico evidence of convergence with cardiovascular candidate genes. Hum. Mol.
Genet. 17: 331–44.
Wilson, Y. M., T. C. Brodnicki, A. J. Lawrence, and M. Murphy,
2011 Congenic mouse strains enable discrimination of genetic
determinants contributing to fear and fear memory. Behav.
Genet. 41: 278–287.
Wise, A. L., L. Gyi, and T. A. Manolio, 2013 eXclusion: toward
integrating the X chromosome in genome-wide association
anal-yses. Am. J. Hum. Genet. 92: 643–647.
Yang, J., N. A. Zaitlen, M. E. Goddard, P. M. Visscher, and A. L.
Price, 2014 Advantages and pitfalls in the application of
mixed-model association methods. Nat. Genet. 46: 100–106.
Yu, J., G. Pressoir, W. H. Briggs, I. V. Bi, M. Yamasakiet al., 2006 A
unified mixed-model method for association mapping that accounts
for multiple levels of relatedness. Nat. Genet. 38: 203–208.
Zhou, X., and M. Stephens, 2012 Genome-wide efficient
mixed-model analysis for association studies. Nat. Genet. 44: 821–824.
Zhou, X., P. Carbonetto, and M. Stephens, 2013 Polygenic modeling
with Bayesian sparse linear mixed models. PLoS Genet. 9: e1003264.
Zou, F., J. A. L. Gelfond, D. C. Airey, L. Lu, K. F. Manly et al.,
2005 Quantitative trait locus analysis using recombinant
in-bred intercrosses: theoretical and empirical considerations.
Genetics 170: 1299–1311.
GENETICS
Supporting Information http://www.genetics.org/lookup/suppl/doi:10.1534/genetics.114.167056/-/DC1
High-Resolution Genetic Mapping of Complex Traits
from a Combined Analysis of F
2
and Advanced
Intercross Mice
Clarissa C. Parker, Peter Carbonetto, Greta Sokoloff, Yeonhee J. Park, Mark Abney, and Abraham A. Palmer
Table S1 Candidate non-synonymous coding SNPs for Open Field and Conditioned Fear QTLs.
Table columns
from left to right are: (1) chromosome; (2) base pair position of SNP, and strand; (3) gene; (4) gene symbol; (5)
total number of nonsynonymous SNPs identified in gene.
Available for download at
http://www.genetics.org/lookup/suppl/doi:10.1534/genetics.114.167056/-/DC1
Figure S1
Comparison of reference genetic map and genetic distances estimated from F2 genotype data.
Each
point in scatterplot corresponds to a single SNP on the X chromosome (orange) or an autosomal chromosome
(black). Intermarker distances are shown in centiMorgans (cM).
intermarker distance (cM) from reference panel
0
0
5
10
15
20
25
5
10
15
20
25
in
te
rm
a
rk
e
r
di
s
ta
n
c
e
(
c
M
)
e
s
ti
m
a
te
d
in
F
2
da
Figure S2 Overlapping QTL region on chromosome 2 for freezing to context and freezing to cue, and adjacent
QTL region on chromosome 2 for distance traveled in the periphery.
LOD scores quantify support for
association at SNPs, accounting for differences in genetic sharing using marker-based estimates of pairwise
relatedness. Note that LOD scores for freezing to cue are obtained by conditioning on effect of peak SNP
(rs27453770) on the same chromosome. Horizontal red lines indicate 1.5-LOD support intervals. The dashed
orange line shows the significance threshold at α = 0.05 obtained using the simple permutation test.
position (in Mb) on chromosome 2
LOD
LOD
LOD
0 2 4 6 8
0 2 4 6 8
10 20 30 40 50 60 0
2 4 6 8
freezing to context
freezing to cue
Figure S3 Overlapping QTL region on chromosome 17 for freezing to context, freezing to cue and distance
traveled in the periphery.
LOD scores quantify support for association at SNPs, accounting for differences in
genetic sharing using marker-based estimates of pairwise relatedness. Red lines represent 1.5-LOD support
intervals, and the dashed orange line shows the significance threshold (at α = 0.05) obtained using the simple
permutation test.
LOD
LOD
LOD
0 2 4 6 80 2 4 6 8
20 25 30 35 40
0 2 4 6
8 distance traveled in the periphery
position (in Mb) on chromosome 17 freezing to context