ABSTRACT
NAZARI, MILAD. Infrared Matrix-Assisted Laser Desorption Electrospray Ionization (IR-MALDESI): Development and Applications in Metabolomics, Mass Spectrometry
Imaging, and Direct Analysis (Under the direction of Dr. David C. Muddiman).
Infrared matrix-assisted laser desorption electrospray ionization (IR-MALDESI) is a hybrid ionization method combining resonant laser desorption with electrospray post-ionization at atmospheric pressure. IR-MALDESI combines the benefits of matrix-assisted laser desorption/ionization (MALDI) such as high salt tolerance, high
throughput, and the ability to obtain spatial information, with advantages of electrospray ionization (ESI) such as multiple charging of large analytes as well as ionization at atmospheric pressure. The most common application of the IR-MALDESI source is in the field of mass spectrometry imaging (MSI), where relative abundance and spatial distribution of many analytes can be simultaneously monitored in a label-free fashion.
A new version of the open-source software MSiReader containing a multitude of new features was introduced. Many of the newly-added features such as the ability to generate mass measurement accuracy (MMA) heatmaps and the option to parse the data by polarity were added to the software as a direct result of the works presented in this thesis.
ablation radius of the laser. In the whole-body MSI experiment, distribution of
hundreds of analytes in various organs of a 2-day old neonatal mouse were visualized. A polarity switching MSI method was developed and the ESI solvent composition was optimized. The developed method was utilized to discern the differences in spatial distribution and relative abundance of more than 500 metabolites between healthy and cancerous hen ovarian tissue sections. Glutathione was one of the analytes that
exhibited a significant upregulation in the cancerous tissue. A quantitative IR-MALDESI MSI method was used to obtain absolute concentration of glutathione in healthy and cancerous tissues. Subsequently, glutathione was extracted from adjacent tissue
sections and quantified using LC-MS/MS for comparison with IR-MALDESI MSI results. Using both methods, a ~2-fold increase in absolute concentration of glutathione in the cancerous tissue compared to the healthy tissue was observed.
One of the challenges in untargeted metabolomics analyses is identification of unknown features. This is specially the case in MSI experiments, where it is impractical to perform MS/MS to confirm the identity of each feature. Shotgun lipidomics with gas-phase fractionation (GPF) was used to obtain a comprehensive lipidome profile of the healthy hen ovarian tissue. Employing GPF and data-dependent acquisition (DDA) resulted in a 4-fold increase in the number of lipid IDs compared to DDA alone. Subsequently, the spectral accuracy of the Orbitrap mass spectrometer was
thresholds defined in characterizing the spectral accuracy of Orbitrap will be
incorporated into MSiReader to facilitate on-the-fly identification of unknown analytes in IR-MALDESI analyses.
In addition to MSI experiments, IR-MALDESI displays a remarkable potential for direct analysis of metabolites from buffer systems. The source geometry, solvent compositions, and experimental parameters were optimized in order to analyze small metabolites from well plates in a high throughput manner. It was shown that volatile terpenes can be analyzed using secondary electrospray ionization (SESI), while non-volatile terpenes require laser aerosolization. In addition, activity of isocitrate
dehydrogenase 1 (IDH1) enzyme was screened by directly analyzing reaction mixtures from well plates at different time points and measuring relative abundances of
precursors and products.
Infrared Matrix–Assisted Laser Desorption Electrospray Ionization (IR–MALDESI): Developmentand Applications in Metabolomics, Mass Spectrometry Imaging, and
Direct Analysis
by Milad Nazari
A dissertation submitted to the Graduate Faculty of North Carolina State University
in partial fulfillment of the requirements for the degree of
Doctor of Philosophy
Chemistry
Raleigh, North Carolina
2017
APPROVED BY:
_______________________________ _______________________________ David C. Muddiman Gufeng Wang
Committee Chair
DEDICATION
I would like to dedicate this dissertation to my family, specifically my parents, who have supported me throughout my life. I am extremely thankful to have had your support throughout graduate school, and life in general. Also, my younger sister, Rojan, who always supported me from a long distance away in Toronto, Canada, and my long-time girlfriend, Melika, who has always been there to listen to my concerns and
BIOGRAPHY
Milad Nazari was born in Tehran, Iran on July 31, 1989 to his parents
ACKNOWLEDGMENTS
First, I would like to acknowledge my advisor, Dr. David Muddiman. I am incredibly thankful for his invaluable guidance and advice in our scientific and non-scientific discussions. I first met Dr. Muddiman in 2012 when I was an undergraduate student in his Analytical Chemistry Laboratory course, and by the end of that semester I knew that he was the advisor that I wanted to work with. Over the past four years, he has provided me with the opportunity to work on a project that I am passionate about, and his mentorship has helped me become the scientist and person I am today.
I would also like to acknowledge the Muddiman alumni and students who have supported me throughout my graduate career. I would like to specifically thank my MALDESI co-workers, Dr. Mark Bokhart, Ken Garrard, and Måns Ekelöf, for always being available for discussions and providing valuable insights.
TABLE OF CONTENTS
LIST OF TABLES ... xi
LIST OF FIGURES ... xii
LIST OF PUBLICATIONS ... xvi
CHAPTER 1: An Introduction to Biological Mass Spectrometry ... 1
1.1 Soft Ionization Methods for Analyzing Biomolecules ... 1
1.1.1 Matrix-Assisted Laser Desorption/Ionization (MALDI) ... 2
1.1.2 Electrospray Ionization (ESI) ... 5
1.1.3 Matrix-Assisted Laser Desorption Electrospray Ionization (MALDESI) ... 8
1.2 Fourier Transform Mass Spectrometry (FTMS) ... 11
1.3 Mass Spectrometry Imaging (MSI) ... 14
1.4 Metabolomics and Lipidomics ... 16
1.5 Synopsis of Completed Research ... 20
1.6 References ... 25
CHAPTER 2:MSiReader v1.0: Evolving Open-Source Mass Spectrometry Imaging Software for Targeted and Untargeted Analyses ... 33
2.1 Introduction ... 33
2.2 Experimental ... 35
2.3 Results and Discussions ... 37
2.3.1 Overview of MSiReader Features... 37
2.3.2 Loading and Processing of Imaging Data Sets ... 39
2.3.3 Loading Multiple Data Sets ... 41
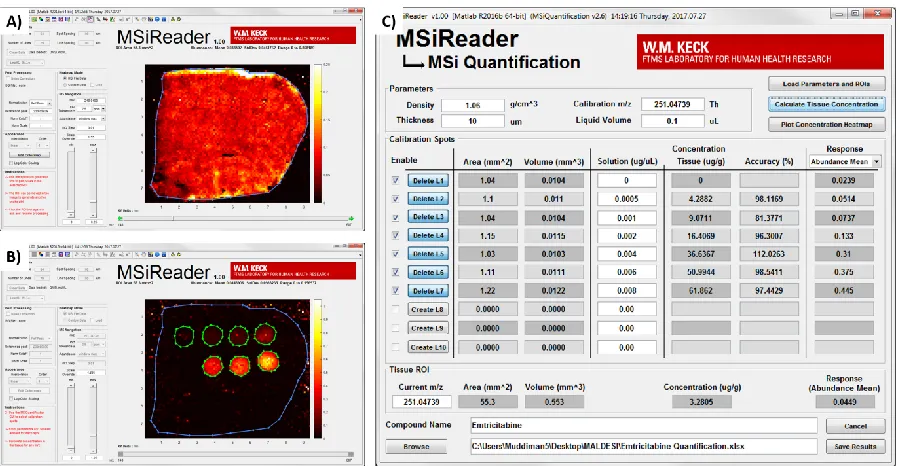
2.3.4 Absolute Quantification in MSiReader for Mass Spectrometry Imaging ... 43
2.3.5 Polarity Switching Mass Spectrometry Imaging Data Processing ... 45
2.3.6 Image Overlay Tool ... 48
2.3.7 Mass Measurement Accuracy (MMA) Heatmap and Histograms ... 49
2.4 Conclusions ... 52
2.5 Acknowledgments... 53
CHAPTER 3: Cellular-Level Mass Spectrometry Imaging using Infrared Matrix-Assisted Laser Desorption Electrospray Ionization (IR-MALDESI) by
Oversampling ... 58
3.1 Introduction ... 58
3.2 Experimental ... 62
3.2.1 Materials ... 62
3.2.2 Samples ... 62
3.2.3 IR-MALDESI Imaging Source and the Q Exactive ... 62
3.2.4 Data Analysis ... 64
3.3 Results and Discussions ... 65
3.3.1 Optimization of Parameters for Cellular Imaging ... 65
3.3.2 Imaging at Cellular Resolution ... 66
3.3.3 Challenges of Imaging at Cellular Level ... 69
3.4 Conclusions ... 72
3.5 Acknowledgments... 73
3.6 References ... 74
CHAPTER 4: Polarity Switching Mass Spectrometry Imaging of Healthy and Cancerous Hen Ovarian Tissue Sections by Infrared Matrix-Assisted Laser Desorption Electrospray Ionization (IR-MALDESI) ... 79
4.1 Introduction ... 79
4.2 Experimental ... 83
4.2.1 Materials ... 83
4.2.2 Samples ... 83
4.2.3 IR-MALDESI Imaging Source Coupled to Q Exactive Plus ... 84
4.2.4 Data Analysis and Metabolite Identification ... 87
4.3 Results and Discussion ... 88
4.3.1 Polarity Switching MSI Method Development ... 88
4.3.2 Polarity Switching MSI Solvent Optimization ... 90
4.3.3 Polarity Switching MSI of Healthy and Cancerous Tissue Sections ... 94
CHAPTER 5: Quantitative Mass Spectrometry Imaging of Glutathione in Healthy and Cancerous Hen Ovarian Tissue Sections by Infrared Matrix-Assisted Laser
Desorption Electrospray Ionization (IR-MALDESI) ... 109
5.1 Introduction ... 109
5.2 Experimental ... 112
5.2.1 Materials ... 112
5.2.2 Hen Ovarian Tissues ... 113
5.2.3 Sample Preparation for IR-MALDESI QMSI ... 113
5.2.4 IR-MALDESI QMSI ... 114
5.2.5 IR-MALDESI QMSI Data Processing ... 116
5.2.6 Sample Preparation for LC-MS/MS Quantification ... 117
5.2.7 LC-MS/MS Analysis ... 118
5.2.8 LC-MS/MS Data Analysis ... 119
5.3 Results and Discussions ... 119
5.3.1 Reducing Voxel-to-Voxel Variability in Quantitative IR-MALDESI MSI ... 119
5.3.2 Absolute Quantification using IR-MALDESI ... 121
5.3.3 Comparison of IR-MALDESI QMSI with LC-MS/MS ... 125
5.4 Conclusions ... 128
5.5 Acknowledgments... 129
5.6 References ... 130
CHAPTER 6: Characterization of the Spectral Accuracy of an Orbitrap Mass Analyzer using Isotope Ratio Mass Spectrometry... 134
6.1 Introduction ... 134
6.2 Experimental ... 137
6.2.1 Materials ... 137
6.2.2 Direct Analysis of Caffeine, MRFA, and Ultramark Using Q Exactive Plus ... 137
6.2.3 Direct Analysis of IRMS Reference Standards Using Q Exactive Plus ... 138
6.2.4 Analysis of CaffeineSigma, MRFA, and Ultramark Using IRMS ... 139
6.2.5 Data Analysis ... 140
6.3.2 Orbitrap’s Sensitivity of Carbon Counting across Eight AGC Targets ... 147
6.4 Conclusions ... 157
6.5 Acknowledgments... 157
6.6 References ... 159
CHAPTER 7: Enhanced Lipidome Coverage in Shotgun Analyses by using Gas-Phase Fractionation ... 163
7.1 Introduction ... 163
7.2 Experimental ... 167
7.2.1 Materials ... 167
7.2.2 Samples ... 168
7.2.3 Lipid Nomenclature ... 168
7.2.4 Lipid Extraction ... 168
7.2.5 Shotgun Lipidomics using Q Exactive Plus ... 169
7.2.6 Lipid Identification and Data Analysis... 170
7.3 Results and Discussion ... 171
7.3.1 Lipid Profiles in Positive- and Negative-Ion Modes ... 171
7.3.2 Extended Dynamic Range and Enhanced Sensitivity using Gas-Phase Fractionation ... 174
7.3.3 Comprehensive Lipid Coverage using Gas-Phase Fractionation ... 179
7.4 Conclusions ... 187
7.5 Acknowledgments... 188
7.6 References ... 189
CHAPTER 8: Direct Analysis of Terpenes from Biological Buffer Systems using SESI and IR-MALDESI ... 193
8.1 Introduction ... 193
8.2 Experimental ... 195
8.2.1 Materials ... 195
8.2.2 Synthesis of Farnesyl-Diphosphate ... 196
8.2.3 Preparation of γ-Humulene Synthase ... 197
8.2.6 Preparation of Stock and Working Solutions for IR-MALDESI and SESI ... 198
8.2.7 IR-MALDESI and SESI Mass Spectrometry ... 199
8.2.8 Data Analysis ... 202
8.3 Results and Discussions ... 202
8.3.1 Electrospray Solvent and Method Optimization ... 202
8.3.2 Utilizing SESI and IR-MALDESI for Detection of Terpenes ... 206
8.3.3 Relationship between Analyte Concentration and Ion Abundance ... 210
8.3.4 Direct SESI Analysis of γ-Humulene from an Enzymatic Reaction Mixture ... 212
8.4 Conclusions ... 215
8.5 Acknowledgments... 215
8.6 References ... 216
CHAPTER 9: Direct Screening of Enzyme Activity using Infrared Matrix-Assisted Laser Desorption Electrospray Ionization (IR-MALDESI) ... 219
9.1 Introduction ... 219
9.2 Experimental ... 222
9.2.1 Materials ... 222
9.2.2 Enzymatic Reactions ... 223
9.2.3 IR-MALDESI Reaction Screening ... 224
9.2.4 IR-MALDESI HTS Proof-of-Concept ... 227
9.2.5 Data Analysis ... 228
9.3 Results and Discussion ... 228
9.3.1 Screening Enzyme Activity using IR-MALDESI ... 228
9.3.2 Suitability of IR-MALDESI for HTS ... 231
9.3.3 IR-MALDESI HTS ... 233
9.4 Conclusions ... 235
9.5 Acknowledgments... 236
9.6 References ... 237
APPENDICES ... 239
A.2 Protocol ... 241
A.2.1 Tissue Preparation ... 242
A.2.2 IR-MALDESI Preparation/Calibration ... 244
A.2.3 Deposition of Ice Matrix ... 246
A.2.4 Mass Spectrometry Imaging Data Acquisition ... 247
A.2.5 Data Analysis ... 251
A.3 Representative Results ... 253
A.4 Discussion ... 254
A.5 Acknowledgements ... 256
A.6 Material ... 257
A.7 References ... 258
Appendix B: Supplemental Information for Chapter 4 ... 261
B.1 Figures ... 261
Appendix C: Supplemental Information for Chapter 5 ... 264
C.1 Figures ... 264
Appendix D: Supplemental Information for Chapter 6 ... 267
D.1 Figures ... 267
Appendix E: Supplemental Information for Chapter 7 ... 271
E.1 Figures ... 271
E.2 Tables ... 271
Appendix F: Supplemental Information for Chapter 8 ... 303
F.1 Figures ... 303
Appendix G: Supplemental Information for Chapter 9 ... 308
LIST OF TABLES
Table 2.1 MSiReader dataset loading time improvement ... 40 Table 2.2 MSiReader operation time improvements ………. 40 Table 5.1 Absolute concentration of glutathione in healthy and cancerous hen
ovarian tissue sections by IR-MALDESI QMSI and LC-MS/MS ……… 124
Table 6.1 Analysis of four IRMS standards using Q Exactive Plus ……….. 146 Table 7.1 Number of unique lipids identified in positive and negative ion modes
with and without gas-phase fractionation ……….. 182
Table 9.1 Results of the pseudo-HTS analysis of 10 samples in the single-blind study ………... 235
Table A.1 Instrument parameters used in whole-body IR-MALDESI MSI ………….. 251 Table A.2 IR-MALDESI Materials ………. 257 Table E.1 List of lipids identified in positive-ion mode using DDA ……… 271 Table E.2 List of lipids identified in negative-ion mode using DDA ………... 274 Table E.3 List of lipids identified in positive-ion mode using gas-phase fractionation
and DDA ……… 278 Table E.4 List of lipids identified in negative-ion mode using gas-phase
LIST OF FIGURES
Figure 1.1 Schematic of MALDI process and proposed ionization mechanisms ……... 3 Figure 1.2 Schematic of electrospray ionization and mechanisms of ionization …….. 6 Figure 1.3 Schematic of the IR-MALDESI source ……… 10 Figure 1.4 Schematic of the Q Exactive Plus mass spectrometer ………. 12 Figure 2.1 Loading multiple imaging data sets ……… 42 Figure 2.2 MSiQuantification tool for absolute quantification MSI experiments.
Showing ROI tool for tissue and calibration spots ……….... 44 Figure 2.3 Polarity switching and polarity filtering are implemented for the mzXML
and imzML file formats as the data is loaded ... 46 Figure 2.4 MSiImage tool for overlaying an optical image with the ion image of
putatively assigned desmosterol obtained from a whole-body
IR-MALDESI analysis ... 49 Figure 2.5 Screenshot of MSiReader interface showing the ion image of glutathione
and its MMA heatmapt in a healthy hen ovarian tissue section ... 51
Figure 3.1 Ion maps of cholesterol ([M−H2O+H+]+) before and after the optimization
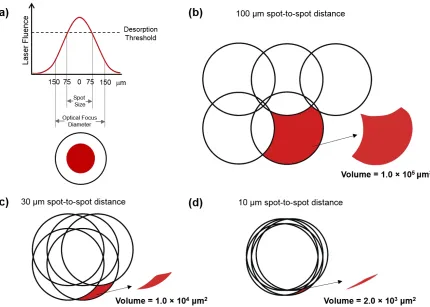
of the electrospray flow rate and spray voltage ... 66 Figure 3.2 The optical focus diameter and the desorption diameter on tissue
illustrates the semi-Gaussian distribution of the laser beam ... 68 Figure 3.3 The optical image of the tissue section and the areas analyzed by
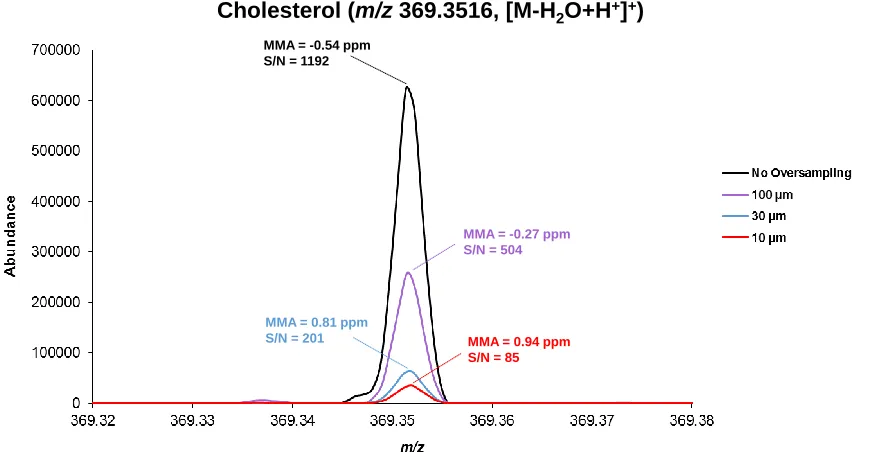
IR-MALDESI ... 69 Figure 3.4 The spectra of cholesterol obtained using no oversampling compared
with oversampling using 100-, 30-, and 10-μm step sizes ... 72
Figure 4.1 Schematic of polarity switching MSI method, where adjacent voxels are analyzed in opposing polarities ... 86 Figure 4.2 Optical image of the tissue showing the modifiers used in each quadrant,
along with representative ion images of lipids in positive- and negative-ion modes ... 93 Figure 4.3 Representative ion images of different lipid classes in healthy and
cancerous ovarian tissue sections ... 97 Figure 4.4 Four candidates that could represent the deprotonated species observed
Figure 4.5 Representative spectra from polarity switching MSI of cancerous (top) and healthy (bottom) tissue sections ... 101
Figure 5.1 The workflow of quantitative IR-MALDESI MSI of ovarian tissues ... 114 Figure 5.2 Ion images of glutathione in healthy and cancerous tissues before and
after normalization to γ-EC ... 120 Figure 5.3 Normalized Ion images of glutathione in healthy and cancerous tissues
along with SIL glutathione and the resulting calibration curves ... 122 Figure 5.4 Representative MS/MS spectra of NAT GSH-NEM and the XIC of z-ions of
NAT and SIL GSH-NEM in a healthy tissue section ... 127
Figure 6.1 Dependence of calculated δOrbitrap13C on absolute ion abundance of A+1
peak for caffeine, MRFA, and ultramark ... 144 Figure 6.2 Orbitrap mass spectra collected in positive ESI mode for caffeine,
glutamic acid 1, glutamic acid 2, and sulfanilamide ... 145 Figure 6.3 Representative mass spectra of caffeine, MRFA, and ultramark collected
on the Q Exactive Plus instrument ... 149 Figure 6.4 Deviations from the known number of carbons across different ion
populations ... 152 Figure 6.5 Pearson’s χ2 distributions for caffeine, MRFA, and ultramark across eight
different AGC targets ... 156
Figure 7.1 Lipid profiles obtained in positive- and negative-ion modes ... 173 Figure 7.2 Extracted ion chromatograms of of PC (16:0/18:1) + Na+ and
PC (16:0/14:0) + Na+ in unfractionated and fractionated analyses ... 177
Figure 7.3 Box plots of ion abundances of lipids that were identified in both
unfractionated and fractionated analyses ... 179 Figure 7.4 Venn diagrams demonstrating the utility of gas-phase fractionation for
obtaining a comprehensive lipid coverage in both ionization modes ... 184 Figure 7.5 Lipid profiles in m/z range 1450–1600 obtained without and with
performing gas-phase fractionation ... 186
Figure 8.1 Chemical structures, formulas, and boiling points of α-humulene,
Figure 8.3 Sum of the ion abundances of both silver adducts obtained using SESI and
IR-MALDESI for α-humulene, squalene, and (R)-(+)-limonene ... 209
Figure 8.4 Bar charts showing the increase in ion abundance as a result of increasing the concentration of each analyte from SESI analysis of α-humulene and (R)-(+)-limonene, as well as IR-MALDESI direct analysis of squalene .. 211
Figure 8.5 Average mass spectra obtained by direct SESI analysis of 6 different reaction mixtures along with their GC-MS chromatograms ... 213
Figure 9.1 Schematic of isocitrate dehydrogenase 1 reaction and the concentrations of precursors and enzyme used in two different experiments ... 224
Figure 9.2 Schematic of IR-MALDESI source adapted for direct analysis of samples from well plates ... 225
Figure 9.3 Representative mass spectra showing the 4 analytes of interest in IR-MALDESI direct analyses at time points 0 and 60 minutes ... 230
Figure 9.4 Screening the activity of IDH1 enzyme by monitoring the percent conversion of precursors to products ... 231
Figure 9.5 The calculated percent conversion of isocitrate to α-KG and NADP+ to NADPH, measured continuously over one minute ... 233
Figure A.1 IR-MALDESI schematic and parameters ... 246
Figure A.2 User interface for IR-MALDESI MSI operation ... 249
Figure A.3 User interface of MSiReader; V1.0 ... 253
Figure A.4 Representative IR-MALDESI MSI images ...254
Figure B.1 High mass measurement accuracy obtained in polarity switching IR-MALDESI MSI for cholesterol (m/z 369.3516 [M-H2O+H+]+) in healthy and cancerous tissue sections ... 261
Figure B.2 High mass measurement accuracy obtained in polarity switching IR- MALDESI MSI for glutathione (m/z 306.0766 [M-H+]-) in healthy and cancerous tissue sections ... 262
Figure B.3 Box plots of tissue-specific ion abundances in mouse liver in positive- and negative-ion modes with acetic acid as the solvent modifier ... 263
Figure C.3 Breakdown curves of 4 different transitions of NAT GSH-NEM and the optimized CE for each transition ... 266
Figure D.1 Mass measurement accuracy of caffeine, MRFA, and ultramark across eight different AGC targets ... 267 Figure D.2 Calculated δOrbitrap values for 13C1, 15N1, and 34S1 in caffeine, ultramark, and
MRFA at eight different AGC targets ... 268 Figure D.3 Relative abundance of 13C in caffeine, MRFA, and ultramark as measured
by IRMS and compared to values reported by IUPAC ... 269 Figure D.4 Orbitrap’s deviations from a true number of nitrogens and sulfurs across
eight distinct AGC targets ... 269 Figure D.5 Deviations from the known number of carbons across different ion
populations for caffeine, MRFA, and ultramark ... 270
Figure E.1 The number of lipids identified using each quality filter (A, B, and C) in fractionated and unfractionated data sets ... 271
Figure F.1 Zoomed-in spectra of regions where the [M+H+]+, [M+Li]+,[ M+Na]+, and
[M+K]+ adducts of α-humulene were detected ... 303
Figure F.2 Extracted ion chromatograms of squalene [M+107Ag]+ obtained using well
plates and microwell slides ... 304 Figure F.3 Optimization of injection time for analysis of squalene using two laser
shots when the IT was varied from 1-250 ms every 30 seconds ... 305 Figure F.4 Scheme illustrating the humulene synthase catalyzed synthesis of
γ-humulene from farnesyl diphosphate ... 306 Figure F.5 Overlay of gas chromatograms obtained using from the reaction mixture
and the reaction mixture spiked with 110 ng/μL α-humulene ... 306 Figure F.6 Electron impact spectra obtained for enzymatically synthesized
γ-humulene and spiked standard of α-γ-humulene in the same mixture .... 307
Figure G.1 Schematic of the 6-step method used to screen the activity of IDH1 in Experiments 1 and 2 ... 308 Figure G.2 UV/VIS spectra of the reaction mixture in Experiment 1 at time points 0
LIST OF PUBLICATIONS
1. Yunlong Zhang, Ran Zhang, Milad Nazari, Michael C. Bagley, Eric S. Miller, David C. Muddiman, Jonathan S. Lindsey. “Rapid Mass Spectrometric Screening
Methods with Filamentous Cyanobacteria: Detection of Chlorophyll a and Tetrapyrrole Secondary Metabolites.” Phytochemical Analysis, 2017, Submitted (10/09/17).
2. Milad Nazari§, Sitora Khodjaniyazova§, Mayara P.V. Matos, Glen P. Jackson, and
David C. Muddiman. “Characterization of the Spectral Accuracy of an Orbitrap Mass Analyzer using Isotope Ratio Mass Spectrometry” Analytical Chemistry, 2017, Submitted (09/29/17).
§These authors contributed equally to this work.
3. Milad Nazari, Mark T. Bokhart, Philip L. Loziuk, and David C. Muddiman. “Quantitative Mass Spectrometry Imaging of Glutathione in Healthy and Cancerous Hen Ovarian Tissue Sections by Infrared Matrix-Assisted Laser Desorption Electrospray Ionization (IR-MALDESI)” Journal of Materials Chemistry B, 2017, Submitted (09/21/17).
4. Milad Nazari§, Mark T. Bokhart§, Kenneth P. Garrard, and David C. Muddiman.
“MSiReader v1.0: Evolving Open-Source Mass Spectrometry Imaging Software for Targeted and Untargeted Analyses” Journal of the American Society for Mass Spectrometry, 2017, In Press.
§These authors contributed equally to this work.
5. Milad Nazari§, Måns Ekelöf§, Sitora Khodjaniyazova, Nathaniel L. Elsen, Jon D.
Williams, David C. Muddiman. “Direct Screening of Enzyme Activity using Infrared Matrix-Assisted Laser Desorption Electrospray Ionization (IR-MALDESI)” Rapid Communications in Mass Spectrometry, 2017, In Press.
§These authors contributed equally to this work.
7. Mark T. Bokhart, Jeffrey G. Manni, Kenneth P. Garrard, Måns Ekelöf, Milad Nazari, David C. Muddiman. “IR-MALDESI Mass Spectrometry Imaging at 50 μm Spatial Resolution” Journal of the American Society for Mass Spectrometry, 2017, 28, 2099-2107.
8. Måns Ekelöf, Erin K. McMurtrie, Milad Nazari, Suzanne D. Johanningsmeier, David C. Muddiman. “Direct Analysis of Triterpenes from High-Salt Fermented Cucumbers Using Infrared Matrix-Assisted Laser Desorption Electrospray Ionization (IR-MALDESI)” Journal of the American Society for Mass Spectrometry, 2017, 28, 370-375.
9. Milad Nazari and David C. Muddiman. “Enhanced Lipidome Coverage in Shotgun Analyses by using Gas-Phase Fractionation” Journal of the American Society for Mass Spectrometry, 2016, 27, 1735-1744.
10. Milad Nazari, Mark T. Bokhart, and David C. Muddiman. “Whole-Body Mass Spectrometry Imaging by Infrared Matrix-Assisted Laser Desorption
Electrospray Ionization (IR-MALDESI)” Journal of Visualized Experiments, 2016, 109, e53942.
11. Milad Nazari and David C. Muddiman. “Polarity Switching Mass Spectrometry Imaging of Healthy and Cancerous Hen Ovarian Tissue Sections by Infrared Matrix-Assisted Laser Desorption Electrospray Ionization (IR-MALDESI)” Analyst, 2016, 141, 595-605.
12. Milad Nazari and David C. Muddiman. “MALDESI: Fundamentals, Direct Analysis, and MS Imaging” in Advances in MALDI and Laser-Induced Soft Ionization Mass Spectrometry (Ed: R. Cramer), 2016, 169-182.
13. Elias Rosen, Mark T. Bokhart, Milad Nazari, and David C. Muddiman. “Influence of C-Trap Ion Accumulation Time on the Detectability of Analytes in IR-MALDESI MSI” Analytical Chemistry, 2015, 87, 10483-10490.
CHAPTER 1
An Introduction to Biological Mass Spectrometry A portion of the following work was reprinted with permission from:
Nazari, M; Muddiman, DC. in Advances in MALDI and laser-induced soft ionization mass spectrometry, ed. R. Cramer, Springer International Publishing, 2016, pp. 169–182. Copyright information: Springer International Publishing Switzerland 2016
The original publication may be accessed directly via the World Wide Web.
1.1 Soft Ionization Methods for Analyzing Biomolecules
Mass spectrometry (MS) has become an irreplaceable analytical tool due to its sensitivity, specificity, and versatility. The fundamental principle of MS revolves around ionization of species, separation of the generated ions according to their mass-to-charge ratio (m/z), and detection of the resulting signal. There have been significant advances and innovations in developing new ionization methods and mass analyzers over the last two decades. The advent of “soft” ionization techniques such as electrospray ionization (ESI)1 and matrix-assisted laser desorption/ionization (MALDI)2,3 revolutionized the
1.1.1 Matrix-Assisted Laser Desorption/Ionization (MALDI)
Matrix-assisted laser desorption/ionization (MALDI) was introduced in late 1980s by Karas and Hillenkamp2 as well as Tanaka et al.3, as an improvement over the
existing laser desorption/ionization (LDI) method.4 In LDI, a laser beam was used to
generate ions directly from surfaces for mass analysis; however, this ionization method would produce fragments of the molecular ion due to the high amounts of energy impartment into the sample.2,4,5 It was then demonstrated that mixing the analyte with
an energy-absorbing matrix (i.e. MALDI) resulted in reduced fragmentation and enhanced the quality of mass spectra for large molecules.2,3,5
In MALDI analyses, analyte molecules are co-crystalized with an excess amount of energy-absorbing matrix, and the resulting mixture is then irradiated by nanosecond laser pulses. Upon irradiation, the matrix absorbs the bulk of the laser energy through electronic or vibrational excitation, which facilitates the desorption of large clusters of neutral and charged molecules.6 Multiple charge transfers occur between matrix and
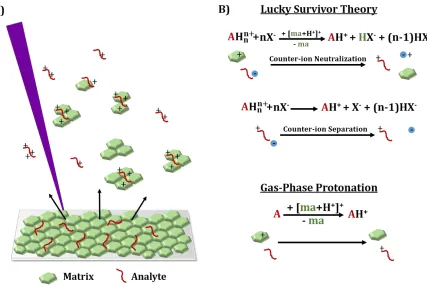
Figure 1.1. (A) Schematic of MALDI depicting the desorption of analytes and matrix upon laser irradiation, (B) Proposed ionization mechanisms in MALDI.
Two models, gas-phase protonation7 and lucky survivor theory8, have been
proposed to describe the ionization mechanism involved in MALDI (Figure 1.1B). The gas-phase protonation model predicts that matrix molecules are photoionized upon irradiation, and analytes are ionized due to proton transfer between protonated or deprotonated matrix molecules and neutral analyte molecules in the gas phase.7 On the
other hand, the lucky survivor model postulates that analytes are incorporated into the matrix crystals with their respective charge states preserved from solution.8 Upon
in solution, and counter-ions are present to allow for crystallization. Once transferred into the gas phase, analyte ions are generated through separation of the counter-ions or neutralization of the counter-ions by matrix ions. More recent investigations have shown that both mechanisms are viable, and the ratio of the two ionization processes depends on the experimental parameters and the nature of analyte and matrix.9 For
instance, when analyzing neutral compounds, gas-phase protonation is the dominant ionization mechanism, whereas, the lucky survivor regime is more dominant when large peptides and proteins are the subject of analysis.
It is evident that the choice of matrix and its application are of paramount
importance for successful MALDI MS analyses. The matrix, typically a small organic acid with absorbance at the wavelength of the laser employed, is often chosen empirically based on the type of analyte and is applied in large excess of analyte. For instance, dihydroxybenzoic acid (DHB) and α-cyano-4-hydroxycinnamic acid (CHCA) are often used for analysis of small molecules such as drugs and lipids, while sinapinic acid (SA) is used to analyze larger molecules such as large peptides, proteins, and polymers.10–12
MALDI has proven its utility in analysis of small and large molecules such as drugs, lipids, peptides, and proteins.13–15 However, this technique suffers from some
drawbacks. The majority of MALDI MS analyses are performed under vacuum, which limits this method to analysis of nonvolatile compounds. Another limitation of MALDI is its poor shot-to-shot reproducibility, which is due to the heterogeneity of the
co-crystallization that leads to large variations in local analyte concentration.16 This poor
reproducibility limits the utility of MALDI for quantitative analyses. Furthermore, matrix-related peaks observed in lower m/z regions can interfere with analyte peaks and cause signal suppression when analyzing small molecules such as lipids and drugs.12,17
1.1.2 Electrospray Ionization (ESI)
Since its introduction in 19891, electrospray ionization (ESI) has evolved to
become arguably the most utilized ionization technique for analysis of large
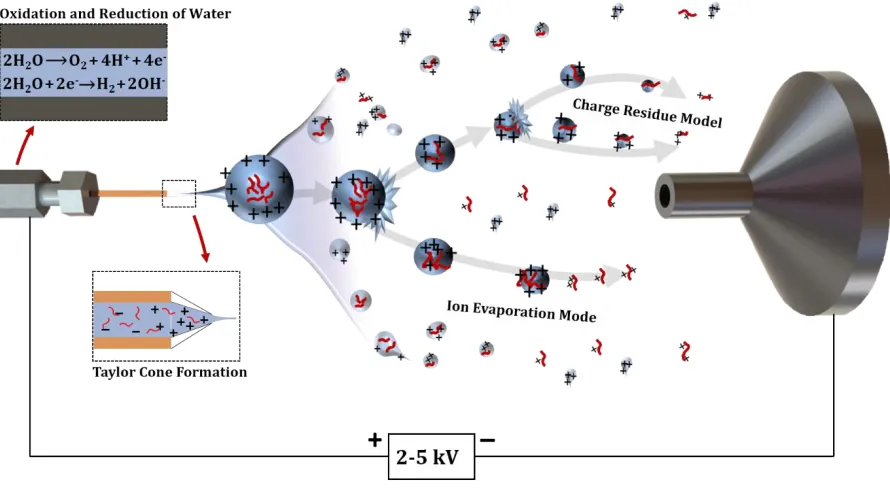
Figure 1.2. Schematic of electrospray ionization (ESI) process and the two proposed mechanisms for ion formation.
point where Coulombic repulsion of the surface charge is equal to the surface tension of the solution, droplets that contain an excess of positive or negative charge are expelled from the Taylor cone. These droplets travel toward the mass spectrometer inlet
through the applied electric field. As the droplets are moving through the air, they undergo solvent evaporation, resulting in their return to the Rayleigh limit due to reduction of their volume. These droplets undergo Coulombic fission and lead to ejection of highly charged progeny droplets of smaller size. These progeny droplets undergo subsequent desolvation and Coulombic fission and result in formation of even smaller droplets.A schematic of ESI process is shown in Figure 1.2.
Similar to MALDI, the exact mechanism of gas phase ion formation in ESI is a subject of some debate. The two widely accepted models describing ion formation in ESI (Figure 1.2) are charge residue model (CRM) proposed by Dole in 196820 and ion
evaporation model (IEM) described by Iribarne and Thomson in 1976.21 The CRM
One of the key features of ESI is its ability to form multiply charged ions. While this feature can increase spectral complexity due to observations of multiple peaks for the same analyte at different m/z values, it provides a means for analyzing large
molecules that would be difficult to analyze with mass analyzers that are limited in the upper m/z dynamic range. Furthermore, multiply charged ions are more amenable to structural characterization through fragmentation, which is advantageous when
analyzing biomolecules such as peptides and proteins.23 As with any ionization method,
ESI also has some drawbacks. One example of such is ion suppression in presence of organic salts that may be present in the matrix of biological samples, since the analyte molecules have to compete with salts for charge.24 Another limitation of ESI is that
while the ionization efficiency is close to 100%, only about <1% of those ions generated in the ambient environment are transmitted to the MS for analysis.25
1.1.3 Matrix-Assisted Laser Desorption Electrospray Ionization (MALDESI)
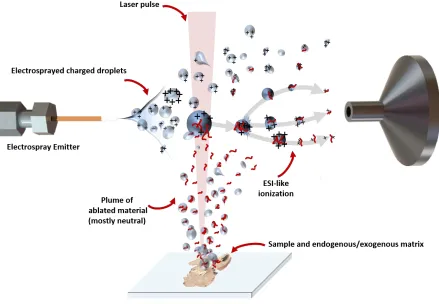
Introduced in 2006, matrix-assisted laser desorption electrospray ionization (MALDESI) was the first technique combining resonant excitation of a matrix with electrospray post-ionization.26 The technique combines attributes of MALDI such as
excess and facilitates the desorption of molecules from the sample by absorbing the energy of the laser. The plume of desorbed material partitions into the charged droplets of an orthogonal electrospray, where ions are generated in an ESI-like process and are sampled by the mass spectrometer. 26–28
The most current generation of the source utilizes a mid-IR laser (λ = 2940 nm) in order to resonantly excite the O-H stretching modes of endogenous or exogenous water, in liquid or solid form, which is used as the energy-absorbing matrix.29,30 Some
Figure 1.3. Schematic of the IR-MALDESI source.
IR-MALDESI is an attractive ionization mode for direct analysis of biomolecules since it is an ambient ionization method, which circumvents the requirement of high vacuum needed in UV-MALDI analyses. The high salt tolerance of IR-MALDESI allows for direct analysis of analytes from biological buffer systems that pose challenges for ESI.31 In addition, due to the aforementioned benefits, many sample preparation steps
The IR-MALDESI source has undergone numerous updates over the past decade and parameters such as solvent composition, ESI-laser spot distance, and sample height have been optimized in statistical design of experiments (DOE)32 for different
applications such as mass spectrometry imaging30 and direct analysis of droplets.33
Applications of the IR-MALDESI source in the fields of mass spectrometry imaging, metabolomics, and direct analysis are discussed in this thesis.
1.2 Fourier Transform Mass Spectrometry (FTMS)
Regardless of the method of ionization used, the generated ions are measured by a mass analyzer, which measures the mass-to-charge ratio (m/z) of the ions. There are a variety of different mass analyzers such as time-of-flight (TOF), ion trap, Fourier
transform ion cyclotron frequency (FTICR), and Orbitrap analyzers. The complexity of biological samples requires the coupling of ionization sources with high resolving power (RP) mass analyzers. The RP is simply the ability of a mass analyzer to
Figure 1.4. Schematic of the Q Exactive Plus hybrid mass spectrometer and some of its components. Figure courtesy of Thermo Fisher Scientific.
In the Q Exactive Plus instrument, ions entering the mass spectrometer first travel through a stacked ring RF ion guide (S-lens) and then through the bent flatapole in order to remove any neutral materials that might have entered the instrument. The ions then pass through a quadrupole mass filter, which consists of four parallel
cylindrical or parabolic rods where opposing pair of rods are connected together
electrically, and radio frequency (RF) voltage with a direct current (DC) offset voltage is applied between one pair of rods and the other pair. Only ions with a stable trajectory based on the Mathieu stability diagram34 for given RF and DC voltages can pass through
the quadrupole. The RF and DC voltages can be manipulated in order to allow a specific ion or a packet of ions within a specific m/z range pass through.35 The ions that
The Orbitrap (Figure 1.4) is a compact and high-speed mass analyzer that operates on the principle of orbital trapping of ions in an electrostatic trap, similar to what was proposed by Kingdon in 1923.37 The Orbitrap consists of a spindle-shaped
central electrode and two electrically isolated outer electrodes to trap ions
electrostatically. The outer electrodes detect the image current induced by the axial oscillation, rather than the radial oscillations, of ions within the trap. The complex waveform is then decomposed into individual sinusoidal wave components that correspond to the motion of ions with specific m/z values using an enhanced Fourier transform (FT) algorithm. The frequency of the axial oscillation of each ion can then be used to calculate its m/z according to Equation 1.1:
𝐄𝐪𝐮𝐚𝐭𝐢𝐨𝐧 𝟏. 𝟏: 𝜔 = √(𝑚 𝑧𝑒⁄ ). 𝑘
where ω is the frequency of axial oscillation, e is the elementary charge of an electron (1.602×10⁻¹⁹ C), and k is a constant.36,38,39 High RP (up to 280,000) and accurate mass
(<1 ppm MMA) can be achieved using the Q Exactive Plus instrument.
When the instrument is operated in MS/MS (MS2) mode, the ions of interest are
high RP of Orbitrap in tandem with the MS/MS spectra can be used for structural elucidation of unknown analytes.
1.3 Mass Spectrometry Imaging (MSI)
Mass spectrometry imaging (MSI) is one of the most recent and rapidly evolving applications of MS. Typical MSI experiments involve generating mass spectra at discreet positions in an array over the surface of a sample, such as a biological tissue section. In the meantime, the exact location from which each mass spectrum was collected is also being recorded. Using the location of each mass spectrum and the abundance of ions in that spectrum, a heat map can be generated to display the distribution of ions of
interest within the sample.
Even though the concept of MSI was initially conceived by introduction of secondary ion mass spectrometry (SIMS)40, pioneering work in this field was
demonstrated using MALDI by Caprioli and coworkers.41 The softness of the ionization
process in MALDI and the capability to generate ions from a specific position make this technique a prime candidate for MSI analysis. Indeed, MALDI is the most common ionization method used for MSI analysis with a variety of applications such as in pharmacokinetics/pharmacodynamics42, proteomics43, metabolomics15, and
lipidomics.44 Vast improvements have been made to lasers and sample preparation
remains as the most crucial step in MALDI imaging experiments.11,12,45 The matrix
should be applied uniformly to the entire surface of the tissue specimen in order to ensure efficient extraction of analytes into matrix crystals, while also maintaining the localization of analyte molecules within the tissue. Furthermore, matrix-related peaks can interfere with analyte(s) of interest and cause ion suppression. This is especially the case in lipidomics, metabolomics, and drug distribution studies where the lower m/z range is scanned.
In order to overcome the limitations mentioned above, much effort has been put toward developing ambient ionization techniques that require little to no sample preparation. The introduction of desorption electrospray ionization (DESI)46 sparked a
new trend toward native sample analysis. Since then, many new ambient ionization methods have been introduced for MSI analyses.47 Matrix-assisted laser desorption
electrospray ionization (MALDESI)26, which was discussed in Section 1.1.3, is an
example of such method.
The sensitivity and specificity of MS coupled with the label-free nature of imaging have helped MSI become an attractive tool in many fields such as
proteomics43,48, lipidomics13,44, drug distribution42,49,50, and cancer research51–54 for
or spatial distribution in different tissues (e.g. diseased vs. healthy), and help with understanding the biological progression of diseases. Once a list of potential candidates has been generated, more in-depth analyses such as targeted MS/MS MSI55 or
quantitative MSI56,57 can be performed to obtain more specific information about the
analyte(s) of interest.
1.4 Metabolomics and Lipidomics
Metabolomics is the study of small molecules as ultimate cellular signaling events resulting from transcriptional and translational changes.58 Most metabolomics
studies consist of differential study of metabolomes generated from “control” and “test” subgroups of observations to distinguish differences in their profiles and responses to external stimuli. Even though quantitative analysis of metabolites by GC-MS dates back to 1970s 59, the recent innovations in analytical instrumentation and informatics in the
past two decades have enabled researchers to acquire comprehensive metabolite profiles of hundreds of metabolites. 58,60 Nuclear magnetic resonance (NMR) and
LC, in order to analyze metabolites in complex mixtures such as biofluids or tissue extracts.60–62
MS-based metabolomics analyses can be categorized in three approaches that roughly correlate to the data quality and number of metabolites studied. The first approach is known as “metabolite fingerprinting.” The objective of fingerprinting studies is to compare patterns of all metabolites accessible to the analysis that exhibit a response to the studied factor. The second approach is metabolite profiling, which involves the analysis of a group of metabolites related to a specific metabolic pathway or a specific class of compounds. The third category of MS-based metabolomics studies is targeted metabolomics, which refers to the detection and absolute quantification of a single or a small group of metabolites. In general, metabolite fingerprinting is
untargeted and is performed to survey the metabolome, whereas, profiling and
quantitative metabolomics are hypothesis-driven and the identity of the metabolite(s) are known prior to analysis and the methods used are optimized for detection of the metabolite(s) of interest.60,61
One of the rapidly growing fields of metabolomics is the lipidomics, which is defined as the comprehensive study and characterization of cellular lipids and their interactions with other moieties through different pathways.63–65 Lipids are ubiquitous
reasons for the rapid growth of lipidomics can be attributed to advances in the field of MS such as development of soft ionization methods and introduction of high resolving power mass spectrometers.63,64
Lipids are classified into eight categories based on their chemical structures and the distinct hydrophobic and hydrophilic elements that constitute the lipid. Each
category is then further divided into main classes, subclasses, and substructures.67,68
Fatty acyls (FA) are a diverse group of molecules synthesized by chain elongation of an acetyl-CoA primer that may contain cyclic functionality and/or be substituted with heteroatoms. FAs are fundamental building blocks of complex lipids and are important sources of energy in the cell.69,70 Glycerolipids (GL) are those lipids composed of mono-,
di-, or tri-substituted glycerol and their derivatives, and are involved in the
transduction of extracellular signals as secondary messengers and play an important role in biosynthesis of more complex lipids. Glycerophospholipids (GP), also referred to as phospholipids, are arguably the most diverse lipid category. GPs are key components of cell membranes, as well as being involved in metabolism and signaling.71,72
Sphingolipids (SP) are complex family of lipids that contain a sphingoid base backbone and a long-chain fatty acyl-CoA. They are bioactive lipids involved in signal transduction and cell recognition.73,74 Sterols (ST) are important components of membranes along
with GPs and mainly act as hormones and signaling molecules.75 Prenols (PR) are
to and from the cell.65 Saccharolipids (SL) are those compounds in which the fatty acyls
are linked directly to a sugar backbone so the resulting structure is compatible with membrane bilayers.65 Polyketides (PK) include a large number of secondary
metabolites and natural products from animal, plant, bacteria, and fungal sources, and have great structural diversity. They are commonly used as antimicrobial, antiparasitic, and anticancer agents.63,65
MS-based lipidomics analyses can be divided into three categories: LC-MS/MS analyses, shotgun analyses, and direct analyses from surfaces (MSI). The details of MSI experiments were discussed in Section 1.3, therefore this section will focus on LC-MS and shotgun modalities. LC-MS lipidomics methods are very similar to those utilized in other “–omics” studies, where a sample of complex mixture of lipids is first separated using LC and then analyzed using MS. The choice of stationary phase and data
acquisition in LC-MS analyses is highly dependent on the lipid categories that are the subject of analysis. For instance, reverse phase LC (RPLC) is often used to separate different phospholipid species.71,76 The other method of lipid analysis is shotgun
lipidomics, where a mixture of lipids is directly infused into the mass spectrometer at very low flow rates without any prior chromatographic separation.77–79 This method
shotgun lipidomics over LC-MS/MS analyses include the simpler experimental setup, high throughput, and lower sample consumption. Shotgun and LC-MS lipidomics along with each technique’s advantages and disadvantages are discussed in more detail in Chapter 7 of this thesis.
1.5 Synopsis of Completed Research
The works presented in this thesis describe the development of the IR-MALDESI source as a powerful ambient ionization source that is well suited for analyzing
biomolecules from complex environments such as tissue sections and biological buffer systems. The IR-MALDESI source is coupled to a Q Exactive Plus mass spectrometer, which is a HRAM instrument, and the most common application of the source is in the field of mass spectrometry imaging. Chapter 2 describes the major update to the MSI software MSiReader, which is an open-source and vendor-neutral software designed for visualization and analyzing high RP MSI data. This new update offers a multitude of newly-added features, many of which stemmed from the research presented in this thesis. Chapter 3 details the utility of IR-MALDESI for obtaining cellular-level ion images of analytes present in tissue sections. By employing the method of oversampling (moving the stage by a distance that is smaller than the laser beam diameter)80, ion
images of cholesterol in human cervical tissue sections at 100-, 30-, and 10-μm
Ovarian cancer is the fifth leading cause of cancer deaths in women in the United States.81 While there are many model available for investigation of onset and
progression of this disease, the domestic egg-laying hen model is the only non-human model for spontaneous development of ovarian cancer with a high prevalence.82,83 Very
few reports of metabolomics fingerprinting for ovarian cancer have been published. Due to the remarkable chemical diversity of metabolites, MS-based metabolomics analyses should be performed in both positive- and negative-ion modes. Chapter 4 details the development of a polarity switching IR-MALDESI MSI method and its application for metabolite fingerprinting of healthy and cancerous hen ovarian tissue sections. In this study, the relative abundance and spatial distribution of more than 500 tissue-specific features were discerned between the healthy and cancerous tissues. In addition, glutathione was chosen as an example to demonstrate an application of using spectral accuracy and sulfur counting for confident identification of analytes.
extracted from the same tissues and its absolute concentration was determined using MS/MS. The results obtained using both IR-MALDESI quantitative MSI and LC-MS/MS demonstrated a ~2-fold increase in absolute concentration of glutathione in the cancerous tissue compared to the healthy tissue.
Most MSI analyses are performed in full MS mode (i.e. without performing MS/MS on the observed metabolites), therefore, it is imperative to establish thresholds for absolute ion abundances of observed metabolites in order to confidently identify them based on their accurate mass and spectral accuracy. In order to establish such thresholds, the spectral accuracy of the Q Exactive Plus mass spectrometer was
characterized in Chapter 6. In this chapter, 3 compounds across a wide m/z range were directly infused into the Q Exactive Plus instrument and the effects of different absolute ion abundances on spectral accuracy were investigated. The same compounds were also analyzed using isotope ratio mass spectrometry (IRMS) in order to obtain the most accurate relative abundance of the heavy isotopes (e.g. 13C, 15N, 34S) present in the
samples. The values obtained using IRMS were used to calculate theoretical isotopic distributions for each compound, which was then compared to the experimental isotopic distribution obtained using the Q Exactive Plus mass spectrometer by calculating χ2 values. These χ2 values were used to establish empirical thresholds for
In Chapter 7 an application of employing gas-phase fractionation for obtaining a comprehensive lipid profile in shotgun analyses was demonstrated. The motive behind this work was to obtain information about the low abundant lipids present in a healthy hen ovarian tissue that are often difficult to analyze, and obtain structural information about as many lipids as possible using their MS/MS fragmentation patterns. Using gas-phase fractionation resulted in a ~4-fold increase in the number of lipid ions observed relative to typical shotgun analyses that do not utilize gas-phase fractionation. The data obtained in study is now used as an in-house database of lipids present in the healthy hen ovarian tissue.
In addition to applications in MSI and metabolomics, IR-MALDESI also displays a remarkable potential for direct analysis of biomolecules from buffer systems without any prior sample workup steps. Such buffer systems are typically not compatible with ESI, and analysis of molecules from these buffers requires extensive sample preparation steps such as extraction, cleanup, or buffer exchange. In Chapter 8 terpenes were analyzed directly from a biological buffer system (20 mM Tris-HCl pH 7.5 containing 10 mM MgCl2) by secondary electrospray ionization (SESI) and IR-MALDESI. Terpenes are
polyunsaturated, therefore the electrospray solvent was doped with silver ions since silver is known to have a high affinity for the π orbitals in olefinic compounds. It was observed that SESI can be used to directly analyze volatile terpenes such as
α-humulene, whereas a non-volatile terpene such as squalene required the laser
directly analyzed using the developed SESI method as well as conventional GC-MS. While the GC-MS analysis required extraction of γ-humulene using hexanes, the SESI analysis was performed directly from the buffer with no sample preparation steps.
To further investigate the utility of IR-MALDESI for direct analysis of
biomolecules, the activity of isocitrate dehydrogenase 1 (IDH1) enzyme was directly screened from a buffer system in Chapter 9. In this chapter, reaction mixtures
containing precursors and enzyme in buffer (20 mM Tris-HCl pH 7.5, with 1 mM MgCl2,
1 mM DTT, and 0.01% BSA by weight) were directly analyzed from well plates at different timepoints to screen the activity of the enzyme. Once the activity was monitored, the utility of the developed method for high-throughput screening (HTS) was investigated by calculating Z-factors for the precursors and products. The Z-factor is simply a measure of “separation band” between positive and negative controls, and values above 0.5 are desired for robust HTS assays. The Z-factor for the developed IR-MALDESI direct analysis method was calculated to be 0.65, which indicates the significant potential of the source for HTS applications.
The Appendices contain an article published in Journal of Visualized Experiments detailing step-by-step instructions for performing IR-MALDESI MSI
1.6 References
1. Fenn, J. B., Mann, M., Meng, C. K., Wong, S. F. & Whitehouse, C. M. Electrospray Ionization for Mass Spectrometry of Large Biomolecules. Science 246, 64–71 (1989).
2. Karas, M. & Hillenkamp, F. Laser Desorption Ionization of Proteins with Molecular Masses Exceeding 10,000 Daltons. Anal. Chem. 60, 2299–2301 (1988).
3. Tanaka, K., Waki, H., Ido, Y., Akita, S. & Yoshida, Y. Protein and Polymer Analyses up to m/z 100 000 by Laser Ionization Time-of-flight Mass Spectrometry. Rapid Commun. Mass Spectrom. 2, 151–153 (1988).
4. Honig, R. E. & Woolston, J. R. Laser-Induced Emission of Electrons, Ions, and Neutral Atoms From Solid Surfaces. Appl. Phys. Lett. 2, 138 (1963).
5. Karas, M., Bachmann, D., Bahr, U. & Hillenkamp, F. Matrix-Assisted Ultraviolet Laser Desorption of Non-Volatile Compounds. Int. J. Mass Spectrom. Ion Process. 78, 53–68 (1987).
6. Ingendoha, A., Karasa, M., Hillenkamp, F. & Giessmannb, U. Factors affecting the resolution in matrix-assisted mass spectrometry. Int. J. Mass Spectrom. Ion Process. 131, 345–354 (1994).
7. Ehring, H., Karas, M. & Hillenkamp, F. Role of photoionization and photochemistry in ionization processes of organic molecules and relevance for matrix-assisted laser desorption ionization mass spectrometry. Org. Mass Spectrom. 27, 472–480 (1992).
8. Karas, M., Gluckmann, M., Schafer, J., Glückmann, M. & Schäfer, J. Ionization in matrix-assisted laser desorption/ionization: singly charged molecular ions are the lucky survivors. J. Mass Spectrom. 35, 1–12 (2000).
9. Jaskolla, T. W. & Karas, M. Compelling Evidence for Lucky Survivor and Gas Phase Protonation: The Unified MALDI Analyte Protonation Mechanism. J. Am. Soc. Mass Spectrom. 22, 976–988 (2011).
10. Mann, M., Hendrickson, R. C. & Pandey, A. Analysis of proteins and proteomes by mass spectrometry. Annu. Rev. Biochem. 70, 437–473 (2001).
sample preparation. J. mass Spectrom. 38, 699–708 (2003).
12. Goodwin, R. J. A. Sample preparation for mass spectrometry imaging: small mistakes can lead to big consequences. J. Proteomics 75, 4893–911 (2012).
13. Murphy, R. C., Hankin, J. a & Barkley, R. M. Imaging of lipid species by MALDI mass spectrometry. J. Lipid Res. 50, S317-22 (2009).
14. Reyzer, M. L., Hsieh, Y., Ng, K., Korfmacher, W. a & Caprioli, R. M. Direct analysis of drug candidates in tissue by matrix-assisted laser desorption/ionization mass spectrometry. J. Mass Spectrom. 38, 1081–92 (2003).
15. Reyzer, M. L. & Caprioli, R. M. MALDI-MS-based imaging of small molecules and proteins in tissues. Curr. Opin. Chem. Biol. 11, 29–35 (2007).
16. Garden, R. W. & Sweedler, J. V. Heterogeneity within MALDI samples as revealed by mass spectrometric imaging. Anal. Chem. 72, 30–6 (2000).
17. Knochenmuss, R. et al. The Matrix Suppression Effect and Ionization Mechanisms in Matrix-assisted Laser Desorption/Ionization. Rapid Commun. Mass Spectrom. 10, 871–877 (1996).
18. Taylor, G. I. & McEwan, a. D. The stability of a horizontal fluid interface in a vertical electric field. J. Fluid Mech. 22, 1 (1965).
19. Taflin, D. C., Ward, T. L. & Davis, E. J. Electrified droplet fission and the Rayleigh limit. Langmuir 5, 376–384 (1989).
20. Dole, M. et al. Molecular Beams of Macroions. J. Chem. Phys. 49, 2240–2249 (1968).
21. Iribarne, J. V. & Thomson, B. A. On the evaporation of small ions from charged droplets. J. Chem. Phys. 64, 2287–2294 (1976).
22. Cole, R. B. Some tenets pertaining to electrospray ionization mass spectrometry. J. Mass Spectrom. 35, 763–772 (2000).
23. Cech, N. B. & Enke, C. G. Practical implications of some recent studies in
electrospray ionization fundamentals. Mass Spectrom. Rev. 20, 362–87 (2002). 24. Annesley, T. M. Ion suppression in mass spectrometry. Clin. Chem. 49, 1041–1044
25. Page, J. S., Kelly, R. T., Tang, K. & Smith, R. D. Ionization and transmission
efficiency in an electrospray ionization—mass spectrometry interface. J. Am. Soc. Mass Spectrom. 18, 1582–1590 (2007).
26. Sampson, J. S., Hawkridge, A. M. & Muddiman, D. C. Generation and detection of multiply-charged peptides and proteins by matrix-assisted laser desorption electrospray ionization (MALDESI) Fourier transform ion cyclotron resonance mass spectrometry. J. Am. Soc. Mass Spectrom. 17, 1712–1716 (2006).
27. Sampson, J. S., Hawkridge, A. M. & Muddiman, D. C. Direct characterization of intact polypeptides by matrix-assisted laser desorption electrospray ionization quadrupole Fourier transform ion cyclotron resonance mass spectrometry. Rapid Commun. Mass Spectrom. 21, 1150–1154 (2007).
28. Dixon, R. B. & Muddiman, D. C. Study of the ionization mechanism in hybrid laser based desorption techniques. Analyst 135, 880–882 (2010).
29. Robichaud, G., Barry, J. A., Garrard, K. P. & Muddiman, D. C. Infrared matrix-assisted laser desorption electrospray ionization (IR-MALDESI) imaging source coupled to a FT-ICR mass spectrometer. J. Am. Soc. Mass Spectrom. 24, 92–100 (2013).
30. Robichaud, G., Barry, J. A. & Muddiman, D. C. IR-MALDESI Mass Spectrometry Imaging of Biological Tissue Sections Using Ice as a Matrix. J. Am. Soc. Mass Spectrom. 25, 319–328 (2014).
31. Nazari, M. et al. Direct analysis of terpenes from biological buffer systems using SESI and IR-MALDESI. Anal. Bioanal. Chem. (2017). doi:10.1007/s00216-017-0570-9
32. Hecht, E. S., Oberg, A. L. & Muddiman, D. C. Optimizing Mass Spectrometry Analyses : A Tailored Review on the Utility of Design of Experiments. J. Am. Soc. Mass Spectrom. 27, 767–785 (2016).
33. Barry, J. A. & Muddiman, D. C. Global optimization of the infrared matrix-assisted laser desorption electrospray ionization (IR MALDESI) source for mass
spectrometry using statistical design of experiments. Rapid Commun. mass Spectrom. 25, 3527–3536 (2011).
35. Michalski, A. et al. Mass spectrometry-based proteomics using Q Exactive, a high-performance benchtop quadrupole Orbitrap mass spectrometer. Mol. Cell.
Proteomics 10, M111.011015 (2011).
36. Scigelova, M. & Makarov, A. Fundamentals and Advances of Orbitrap Mass Spectrometry. Encycl. Anal. Chem. 27 (2013).
doi:10.1002/9780470027318.a9309
37. Kingdon, K. H. A method for the neutralization of electron space charge by positive ionization at very low gas pressures. Phys. Rev. 21, 408–418 (1923). 38. Makarov, A. Electrostatic axially harmonic orbital trapping: A high-performance
technique of mass analysis. Anal. Chem. 72, 1156–1162 (2000).
39. Zubarev, R. a & Makarov, A. Orbitrap mass spectrometry. Anal. Chem. 85, 5288– 96 (2013).
40. Castaing, R. & Slodzian, G. Microanalysis by Secondary Ionic Emission. Journal of Microscopie 1, 395–410 (1962).
41. Caprioli, R. M., Farmer, T. B. & Gile, J. Molecular imaging of biological samples: localization of peptides and proteins using MALDI-TOF MS. Anal. Chem. 69, 4751– 60 (1997).
42. Castellino, S., Groseclose, M. R. & Wagner, D. MALDI imaging mass spectrometry: bridging biology and chemistry in drug development. Bioanalysis 3, 2427–41 (2011).
43. Burnum, K. E., Frappier, S. L. & Caprioli, R. M. Matrix-assisted laser
desorption/ionization imaging mass spectrometry for the investigation of proteins and peptides. Annu. Rev. Anal. Chem. 1, 689–705 (2008).
44. Berry, K. a Z. et al. MALDI imaging of lipid biochemistry in tissues by mass spectrometry. Chem. Rev. 111, 6491–512 (2011).
45. Laiko, V. V, Baldwin, M. A. & Burlingame, A. L. Atmospheric pressure matrix-assisted laser desorption/ionization mass spectrometry. Anal. Chem. 72, 652–7 (2000).
47. Robichaud, G., Barry, J. A. & Muddiman, D. C. Atmospheric Pressure Mass Spectrometry Imaging. Encycl. Anal. Chem. (2014).
doi:10.1002/9780470027318.a9399
48. Gustafsson, J. O. R., Oehler, M. K., Ruszkiewicz, A., McColl, S. R. & Hoffmann, P. MALDI Imaging Mass Spectrometry (MALDI-IMS)-application of spatial proteomics for ovarian cancer classification and diagnosis. Int. J. Mol. Sci. 12, 773–94 (2011).
49. Castellino, S. et al. Central Nervous System Disposition and Metabolism of Fosdevirine (GSK2248761), a Non-Nucleoside Reverse Transcriptase Inhibitor: An LC-MS and Matrix-Assisted Laser Desorption/Ionization Imaging MS
Investigation into Central Nervous System Toxicity. Chem. Res. Toxicol. 26, 241– 251 (2013).
50. Barry, J. a et al. Mapping Antiretroviral Drugs in Tissue by IR-MALDESI MSI Coupled to the Q Exactive and Comparison with LC-MS/MS SRM Assay. J. Am. Soc. Mass Spectrom. (2014). doi:10.1007/s13361-014-0884-1
51. McDonnell, L. A. et al. Peptide and protein imaging mass spectrometry in cancer research. J. Proteomics 73, 1921–1944 (2010).
52. Eberlin, L. S. et al. Cholesterol Sulfate Imaging in Human Prostate Cancer Tissue by Desorption Electrospray Ionization Mass Spectrometry. Anal. Chem. 82, 3430– 3434 (2010).
53. Eberlin, L. S. et al. Classifying human brain tumors by lipid imaging with mass spectrometry. Cancer Res. 72, 645–654 (2012).
54. Schöne, C., Höfler, H. & Walch, A. MALDI imaging mass spectrometry in cancer research: Combining proteomic profiling and histological evaluation. Clin. Biochem. 46, 539–545 (2013).
55. Barry, J. A. et al. Mapping Antiretroviral Drugs in Tissue by IR-MALDESI MSI Coupled to the Q Exactive and Comparison with LC-MS/MS SRM Assay. J. Am. Soc. Mass Spectrom. 25, 2038–2047 (2014).
56. Bokhart, M. T. et al. Quantitative mass spectrometry imaging of emtricitabine in cervical tissue model using infrared matrix-assisted laser desorption electrospray ionization. Anal. Bioanal. Chem. (2014). doi:10.1007/s00216-014-8220-y
state-of-the-art in quantitative imaging mass spectrometry. Anal. Bioanal. Chem. 406, 1275–89 (2014).
58. Gowda Nagana, G. A. et al. Metabolomics-Based Methods for Early Disease Diagnostics: A Review. Expert Rev. Mol. Diagnostics 8, 617–633 (2008). 59. Thompson, J. A. & Markey, S. P. Quantitative Metabolic Profiling of Urinary
Organic Acids by Gas Chromatography-Mass Spectrometry : Comparison of Isolation Methods. Anal. Chem. 47, 1313–1321 (1975).
60. Courant, F., Antignac, J. P., Dervilly-Pinel, G. & Le Bizec, B. Basics of mass spectrometry based metabolomics. Proteomics 14, 2369–88 (2014).
61. Johnson, C. H., Ivanisevic, J. & Siuzdak, G. Metabolomics: beyond biomarkers and towards mechanisms. Nat. Rev. Mol. Cell Biol. 17, 451–459 (2016).
62. Moco, S. et al. Metabolomics technologies and metabolite identification. Trends Anal. Chem. 26, 855–866 (2007).
63. Wenk, M. R. The emerging field of lipidomics. Nat. Rev. Drug Discov. 4, 594–610 (2005).
64. Blanksby, S. J. & Mitchell, T. W. Advances in mass spectrometry for lipidomics. Annu. Rev. Anal. Chem. 3, 433–465 (2010).
65. Khalil, M. B. et al. Lipidomics Era: Accomplishments and Challeneges. Mass Spectrom. Rev. 29, 877–929 (2010).
66. Brügger, B. Lipidomics: Analysis of the Lipid Composition of Cells and Subcellular Organelles by Electrospray Ionization Mass Spectrometry. Annu. Rev. Biochem. 83, 79–98 (2014).
67. Fahy, E. et al. A comprehensive classification system for lipids. J. Lipid Res. 46, 839–61 (2005).
68. Fahy, E. et al. Update of the LIPID MAPS comprehensive classification system for lipids. J. Lipid Res. 50 Suppl, S9–S14 (2009).
69. Currie, E., Schulze, A., Zechner, R., Walther, T. C. & Farese, R. V. Cellular fatty acid metabolism and cancer. Cell Metab. 18, 153–161 (2013).
![Figure 2.1. Loading multiple imaging data sets. The images presented are for cholesterol [M+H+-H2O]+ in 12 sagittal mouse brain tissue sections](https://thumb-us.123doks.com/thumbv2/123dok_us/1516622.1185821/63.612.92.540.323.603/figure-loading-multiple-imaging-presented-cholesterol-sagittal-sections.webp)

![Figure 2.4. MSiImage tool for overlaying an optical image with the ion image of putatively assigned desmosterol (m/z 367.3363, [M+H+-H2O]+) obtained in a whole-body IR-MALDESI analysis 2-day old neonatal mouse](https://thumb-us.123doks.com/thumbv2/123dok_us/1516622.1185821/70.612.91.543.71.487/msiimage-overlaying-putatively-desmosterol-obtained-maldesi-analysis-neonatal.webp)
![Figure 2.5. Top: Screenshot of MSiReader interface showing the ion image of glutathione (m/z 306.0766, [M-H+]-) in a healthy hen ovary tissue section analyzed with negative mode IR-MALDESI](https://thumb-us.123doks.com/thumbv2/123dok_us/1516622.1185821/72.612.91.447.74.515/screenshot-msireader-interface-glutathione-section-analyzed-negative-maldesi.webp)