Proceedings of Recent Advances in Natural Language Processing, pages 878–887, 878
Term Based Semantic Clusters for Very Short Text Classification
Jasper Paalman
Jheronimus Academy of Data Science [email protected]
Shantanu Mullick
School of Industrial Engineering Eindhoven University of Technology
Kalliopi Zervanou
School of Industrial Engineering Eindhoven University of Technology
Yingqian Zhang
School of Industrial Engineering Eindhoven University of Technology
Abstract
Very short texts, such as tweets and in-voices, present challenges in classification. Although term occurrences are strong in-dicators of content, in very short texts, the sparsity of these texts makes it difficult to capture important semantic relationships. A solution calls for a method that not only considers term occurrence, but also han-dles sparseness well. In this work, we in-troduce such an approach, theTermBased
SemanticClusters (TBSeC) that employs terms to create distinctive semantic con-cept clusters. These clusters are ranked using a semantic similarity function which in turn defines a semantic feature space that can be used for text classification. Our method is evaluated in an invoice classifi-cation task. Compared to well-known con-tent representation methods the proposed method performs competitively.
1 Introduction
Bag-of-words approaches (Harris, 1954) to text classification rely on measures of term occurrence, or co-occurrence, such astf·idf(Salton and Buck-ley, 1988), log-likelihood (Dunning, 1993), and mutual information (Church and Hanks, 1990). Such methods, despite their enduring popularity, are well known for their shortcomings in deal-ing with numerous natural language issues, such as morphological, semantic, and other types of variation and ambiguity (Augenstein et al.,2017). These issues become more critical in very short texts, such as microblogs, chat logs, reviews and invoices, because of the lack of data and context that could provide more reliable measures and a source for semantic disambiguation.
Distributional semantic models (Baroni and
Lenci,2010) such as pre-trained word embeddings (Pennington et al.,2014;Grave et al.,2018) encode words as fixed sized real-valued vectors. Embed-dings may address the issues of data sparseness and lack of extensive context, by providing a semantic representation model that is not as sensitive to lit-eral word occurrence in the data, thus providing se-mantic information coverage of out-of-vocabulary words (Bojanowski et al.,2017). This is because embeddings may allow for any given word to be mapped to a real-valued vector (e.g. by using char-acter n-grams), even if it hasn’t been observed dur-ing traindur-ing. Additionally, embedddur-ings implicitly capture semantic, syntactic and lexical properties, thereby representing implicit relationships. In this way, embeddings provide a rich representation that is otherwise difficult to attain. In a short text sce-nario, despite early findings that a small corpus size may not be sufficient for representing the re-lationships between words and documents (Song et al.,2014), availability of pre-trained embeddings makes this issue less of a concern. Despite these advantages and growing popularity, embeddings trained on general language data usually do not perform well in (i) specialised domains (Liu et al., 2018; Kameswara Sarma, 2018) and in (ii) lan-guages with richer morphological variation than English (Zervanou et al.,2014). In this work, we attempt to address these issues while exploiting the advantages of pre-trained word embeddings in a text classification task for very short, domain spe-cific texts in a morphologically rich language, i.e., invoices in Dutch.
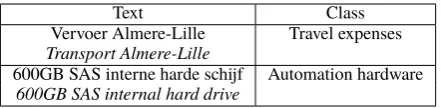
Text Class Vervoer Almere-Lille Travel expenses
Transport Almere-Lille
600GB SAS interne harde schijf Automation hardware
600GB SAS internal hard drive
Table 1: Example documents and classes
semantic variation. The inherent advantage of em-beddings in dealing with out-of-vocabulary words presents, at the same time, the disadvantage of providing a text representation that does not fo-cus on the importance of individual terms for the classification. Conversely, measures of term oc-currence focus heavily on individual term impor-tance but are very sensitive to variation. In very short text and domain-specific applications, where occurring terms are both strong indicators of the respective text class, as well as abound in vari-ation, the preferred solution would combine em-beddings to extracted terms. For example, for in-voices, each occurring term in an invoice descrip-tion is highly informative of the respective invoice text class. Hence a method is required that not only focuses on such terms, but also leverages the flexibility of embeddings. Our proposed method
TermBasedSemanticClusters (TBSeC) attempts to provide such a solution. The contribution of this paper lies in (i) combining the advantages of word embeddings with conventional term extrac-tion techniques (ii) apply our method in an appli-cation domain not previously investigated, namely invoice text, which is characterised by specialised terminology and very short, elliptical and/or un-grammatical text, in a language that is morpholog-ically richer than English and therefore posing an additional challenge in statistical approaches.
TBSeC proposes a two-stage methodology. In the first stage we use class-specific textual informa-tion to build semantic concept clusters. Concept clusters are vector representations of strongly re-lated terms that are distinctive for a certain class. In the second stage, we compute cluster similarity scores on generated concept clusters for a given description. This serves as a ranking function that can be used in both unsupervised and supervised learning tasks.
The remainder of this paper is organized as fol-lows: section 2 discusses related work; section 3elaborates on the TBSeC method; section4 out-lines the experimental setup and section5discusses the results. We conclude with our main
observa-tions and suggesobserva-tions for further work.
2 Related work
Text or document classification is defined as the as-signment of text sections or entire documents to a predefined set of categories (Feldman and Sanger, 2007). For this purpose, algorithms process vari-ous types of text representations which are used as features for describing content. To our knowledge, invoice text classification has not been investigated previously1. Work related to text classification of short texts has been applied for microblogs (Singh et al.,2016;Ren et al.,2016;Missier et al.,2016), email subject classification (Alsmadi and Alhami, 2015) and spam detection (Bahgat et al.,2016).
Initial approaches to document content repre-sentation used counts of term frequency and in-verse document frequency, tf · idf (Salton and Buckley, 1988), whereby frequently occurring terms are assumed to represent document content and inverse document term frequency scores se-lect the most distinctive terms for a given doc-ument within a collection. Various subsequent approaches use variants of term occurrence mea-sures with probabilities, such as χ2-test, log likelihood (Dunning, 1993) and mutual informa-tion (Church and Hanks,1990), or attempt to com-bine statistical measures with various types of lin-guistic and stop-word filters, so as to refine the keyword results. Considerations regarding term ambiguity and variation also led to rule-based ap-proaches (Jacquemin, 2001) and resource-based approaches exploiting existing thesauri and lexica, such as UMLS (Hliaoutakis et al.,2009), or Word-Net (Aggarwal et al.,2018). Knowledge poor sta-tistical approaches, such as Latent Semantic Anal-ysis (Deerwester et al.,1990) and Latent Dirichlet Allocation (Blei et al.,2003) attempt to detect doc-ument content in an unsupervised manner while reducing the dimensionality of the feature space of other bag-of-word approaches, but are also sensi-tive to sparse data and variation in short texts.
The advent of large semantic resources in the form of pre-trained word embeddings (Penning-ton et al., 2014; Grave et al., 2018) gave rise to a new line of approaches employing word embed-dings for document content representation, such as Word2Vec (Mikolov et al., 2013), FastText (Bo-janowski et al., 2017), GloVe (Pennington et al.,
2014), and ELMo (Peters et al.,2018). Within this line of approaches, methods have also been devel-oped using word embeddings specifically for docu-ment classification, such as task-oriented word em-beddings (Liu et al.,2018) and word-sense based embeddings (Jin et al.,2016). Embedding models encoding words in documents or document sec-tions have also been developed, such as Doc2vec (Le and Mikolov,2014), Infersent (Conneau et al., 2017), Skip-thought (Kiros et al.,2015) and Fast-Sent (Hill et al.,2016). Such type of embeddings can be employed to calculate the semantic similar-ity between texts, but the risk is that intricate word-specific semantic relationships are lost. Meth-ods originating from text similarity research using word rather than document embeddings, such as Kusner et al.(2015);Kenter and De Rijke(2015); De Boom et al.(2016) attempt to address this issue. Embeddings have been also used for keyphrase ex-traction via supervised (Mahata et al., 2018) and unsupervised (Bennani-Smires et al., 2018) ap-proaches.
Finally, the problem of variation and data spar-sity with very short texts has been addressed in the past with query expansion approaches (Vech-tomova,2009). For text similarity purposes query expansion techniques have been used for document term augmentation, exploiting relevant search re-sults and a matrix representation (Sahami and Heil-man, 2006;Abhishek and Hosanagar,2007) or a combination of search results page count differ-ence and lexico-syntactic patterns derived from text snippets (Bollegala et al.,2007).
3 The TBSeC methodology
Our proposed method, TBSeC, consists of two stages: In the first stage we use class-specific tex-tual information to build semantic concept clus-ters. Concept clusters are vector representations of strongly related terms that are distinctive for a cer-tain class. In the second stage, we compute cluster similarity scores on generated concept clusters for a given description, thereby forming a semantic feature space. This serves as a ranking function that can be used in both unsupervised and super-vised learning tasks.
3.1 Concept clustering
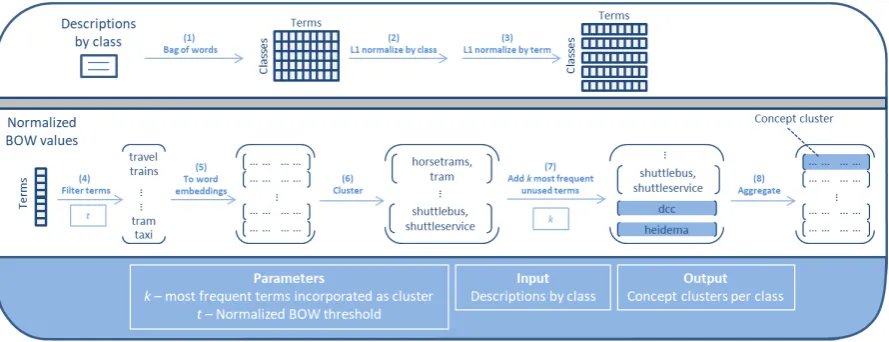
Concept clustering starts by extracting distinctive terms, particular to a class2. Distinctive terms are extracted based on normalized term frequency. For a given class, word embeddings belonging to found terms are used to form numerous clusters. Hence, for each class multiple clusters are created and each cluster can be seen as a group of terms that are closely related. Each cluster is transformed into a concept cluster vector by taking the respec-tive word embeddings of terms and computing the mean over each dimension. This process is illus-trated in Figure1, with actual examples included and word embeddings indicated as vectors with dots.
Specifically, the method works as shown in Al-gorithm 1 for ndistinct classes, k most frequent terms to be incorporated as cluster and normalized term frequency (i.e., Bag-of-words,Bij) threshold t. A more detailed description is given underneath the algorithm. Algorithm line numbers refer to steps as denoted in Figure1.
Terms that provide a clear distinctive value to a class are retrieved using term frequency and L1 normalization over rows and columns. Terms not appearing in the vocabulary of the embedding model, or having a score below the normalized thresholdtare filtered out. Word embeddings for these selected terms are employed to create concept clusters for each class using the DBSCAN cluster-ing model (Ester et al., 1996). Terms can either be included in a multi-term cluster through DB-SCAN clustering or can be added as a single-term cluster when occurring frequently enough based onk. Ultimately, for each classi, concept clusters are created as a single vector equal to the averaged embedding of included terms.
3.2 Semantic cluster similarity
We adapt the similarity measure by Kenter and De Rijke (2015), which is based on the BM25 framework (Robertson et al.,2009), to propose our semantic cluster similarity measure. We combine idf scoring with word by word cosine similarity to calculate a weighted similarity score.
The Kenter and De Rijke (2015) function for calculating semantic text similarity between two sentencesslandssis as defined as follows:
Figure 1: Concept clustering process diagram. Upper panel: Preparing normalized bag of words using descriptions by class. Lower panel: Employing found values to create concept clusters for a given class
fsts(sl, ss) = (1)
X
w∈sl
IDF(w)· sem(w, ss)·(k1+ 1)
sem(w, ss) +k1·(1−b+b·
|ss|
avgsl)
Parametersk1 andbare inherited from the BM25 framework and serve as smoothing parameters. Pa-rameterk1influences what semantic text similarity value is approached asymptotically, thereby limit-ing the influence that semantic term similarity can have. Parameterbprovides a degree of importance
to sentence length ratio avgsl|ss| , comparing sentence length to the average sentence lengthavgsl of sen-tences being ranked. The functionsemreturns the semantic term similarity of termwwith respect to texts, as follows:
sem(w, s) = max
w0∈sfsem(w, w
0
) (2)
where fsem is a vector similarity function that is typically computed as cosine similarity.
In TBSeC, theKenter and De Rijke(2015) func-tion is adapted to compare each sentence to all composed concept clusters. In our implementa-tion, parameterbis redundant, because each con-cept cluster is represented as a single embedding and the measure is computed by a single cosine similarity score. Moreover, we normalize our sim-ilarity score with the number of terms appearing in the sentence to allow for use in a supervised learning task. Finally, we remove term-specific weighting, for four reasons: First, idf scoring im-poses a hefty constraint on the terms that can be
used because of the predefined vocabulary. Sec-ond, we argue that the limited amount of terms appearing in a description justifies the exclusion of term-specific weighting. Each term in the descrip-tion holds an important piece of informadescrip-tion and differentiating is not essential. Third, terms that don’t hold considerable semantic importance are not likely to steer the score towards an incorrect class. Each concept cluster is created to serve as a distinctive concept, thus making it unrealistic that unimportant terms will relate to it well. Fourth, terms in descriptions are subject to frequent mis-spellings and personal abbreviations, making idf scores inherently unreliable in this setting.
Based on the changes to Equation 1 discussed above, our function for calculating semantic cluster similarityfscs between textsand concept cluster cis defined as follows:
fscs(s, c) =
1
|s|·
X
w∈s
(sem(w, c)·t(w))·(k1+ 1)
(sem(w, c)·t(w)) +k1 (3)
wheret(w)is the term frequency of termwin the text. The score is normalized by the number of terms|s| in text s. In addition to smoothing pa-rameterk1, two other hyper parameterssemthand semsqare added to influence scoring. These hyper parameters affect the result ofsemas follows.
sem(w, c) =
fsem(w, c) iffsem(w, c)≥semth
andsemsq=false
fsem(w, c)2 iffsem(w, c)≥semth
andsemsq=true 0 iffsem(w, c)< semth
Algorithm 1Concept Clustering Parameters:
k- No. of most frequent terms to be incorporated as cluster
t- Normalized bag of words threshold Input:
Di, i∈ {1, . . . , n}- Merged descriptions for each class
Output:
Ci, i∈ {1, . . . , n}- Concept clusters for each class
1 Bij←Calculate bag of words usingDi, with found vocabulary setV,
i∈ {1, . . . , n}, j∈ {1, . . .|V|}
Ci←Instantiate empty concept cluster array, withi∈ {1, . . . , n}
fori∈ {1, . . . , n}do
2 Bi∗←L1 normalizeBi∗ .Normalize by class
end for
forj∈ {1, . . .|V|}do
3 B∗j←L1 normalizeB∗j .Normalize by term
end for
fori∈ {1, . . . , n}do .For each class
4 Retrieve terms in vocabulary with a score> t and occur more than once
terms←Array of found terms that appear in word embedding vocabulary
5 emb←Respective word embeddings ofterms
Ci←Create Clusters(emb, k, terms)
end for returnC
functionCreate Clusters(emb, k, terms) InstantiateDBSCANclustering model with
eps,min_samplesand
metric=cosine similarity
FitembonDBSCANmodel
6 clusters←formed clusters as collections of word embeddings
forterminkmost frequenttermsdo
iftermnot used inclustersthen e←word embedding ofterm 7 cluster.append([e])
end if end for
conceptsc←empty concept cluster array with c∈ {1, . . . ,|clusters|}
forc∈ {1, . . . ,|clusters|}do
8 conceptsc←coordinate mean over each dimension
end for
returnconcepts end function
The semantic thresholdsemth serves as a way to add a semantic similarity bound above which it will be presumed to hold importance. Param-etersemth achieves that when fsem(w, c) is un-der the set threshold value, thatsem(w, c)equals 0. Squaring fsem(w, c) through semsq increases term importance of terms that are a near match and lowers importance of terms that match to a lesser extend. Squaring fsem(w, c) therefore promotes the divergence of semantic similarity scores.
Semantic cluster similarity fscs produces fea-tures for use in supervised learning applications, but the initial performance of TBSeC is measured without a predictive model. For this reason, a sim-ilarity score for each class is required in order to rank the classes. This is calculated asscsfor each classi, by extracting the maximum score over all concept clustersc∈Ci(seeCiin Algorithm1):
scs(s, Ci) = max c∈Ci
fscs(s, c) (5)
4 Experimental setup
This section covers data description, data process-ing and the experimental set-up for our method.
4.1 Data
Our invoice data originate from an auditing com-pany. In the data, as illustrated in the examples in Table1, each class refers to a particular type of expenses. Available data is accessed from a data directory, where each file is specific to a client. For our purposes, only theinvoice descriptionand class assignmentare relevant. The volume of the entire data directory amounts to approximately 1.5 million instances. There is a total of 111 unique classes to which assignments are made. The five classes that are least represented have 24, 106, 178, 418 and 452 entries respectively. Invoice descrip-tions on average contain 2.80 terms, with a standard deviation of 1.55.
4.2 Word embeddings
Pre-trained Dutch FastText word embeddings3are used for sentence embedding construction and for use in semantic similarity computations (Bo-janowski et al., 2017). The FastText embedding model was trained on Dutch Wikipedia.
4.3 Data processing
Descriptions are processed using a procedure sim-ilar to the one used in training the FastText model. Special characters are replaced with a whitespace, stopwords in both the English and Dutch language are dropped, digits are removed and finally terms are retrieved by splitting on any sequence of uni-code whitespace characters. When creating valida-tion sets special care is taken to remove duplicates and to include data from all individual clients and all classes in a randomized manner. As a result, largely balanced validation sets are formed with data from various sources.
4.4 Learning algorithm
During supervised learning a Support Vector Ma-chine4is used with regularization parameterC =
0.1and a linear kernel. This classifier performed best when compared to other feasible classifiers (e.g. random forest), given a local working mem-ory bounded set-up, and allows for the use of sparse matrices. Regularization parameter C regulates the importance of focusing on correctly classifying training samples in favor of realizing a hyperplane with a large minimum margin. A highCcan lead to overfitting, a lowC can lead to the inability to learn meaningful decision boundaries. We setCto
0.1since it appears to offer a good balance on the basis of the main validation set in terms of limited running time and general performance.
4.5 Parameter tuning
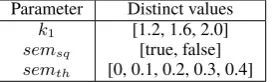
Prior to including our framework in a supervised learning task, we optimize the parameters (see sec-tion5.1for results). We construct an initial set of concept clusters using preset values k = 5 and t = 0.8. Parameters are set such that the model offers a well-performing baseline with low chances of overfitting. Initial concept clusters are used to tune semantic cluster similarity parameters. This order of parameter tuning is chosen, because it is relatively straightforward to pick sensible values for k andt, as opposed to fscs hyperparameters. Table2lists the attempted combinations of param-eter settings forfscs.
After parameter tuning for semantic cluster simi-larity, employed concept clusters are reconsidered. Values in the range from 5 to 50 with a step size of 5 are attempted for the kmost frequent terms
4https://scikit-learn.org/stable/modules/ generated/sklearn.svm.LinearSVC.html
Parameter Distinct values
k1 [1.2, 1.6, 2.0]
semsq [true, false]
semth [0, 0.1, 0.2, 0.3, 0.4]
Table 2: fscsparameter settings
incorporated as cluster.
Validation is performed on a dataset with ap-proximately 5,000 entries. Performance differ-ences for fscs are evaluated using three perfor-mance measures: (1) accuracy, (2) ranking loss and (3) standardized score. Accuracy is calcu-lated by picking the class with the highest semantic similarity score as predicted class and finding the percentage of correctly classified instances. Rank-ing loss is calculated by obtainRank-ing the rank of the true class. The standardized score is calculated by standardizing all scores for a given instance and retrieving the score of the true class. By standard-izing it can be observed how the score for the true class is positioned against all other scores. Ulti-mately, the objective is to maximize the accuracy and standardized score and to minimize ranking loss. Afterwards, we investigate the influence of parameterkfor concept cluster construction on the basis of accuracy and dimension size. Accuracy is calculated as an unsupervised score as well as a 5-fold cross validated supervised score. Both scoring methods use best values fork1,semthandsemsq which are found in the previous step. Results are compared to determine an appropriate value for pa-rameterkfor use of features in a predictive model.
4.6 Invoice classification
We use the proposed semantic cluster similarity matching method, to measure performance in a classification task. We compare the performance to existing methods and we test whether combining methods leads to an increase in performance.
The parameters for generation of semantic clus-ter similarity scores are set in accordance with val-ues obtained during parameter tuning.
Method Parameters Dimension size
tf ·idf - 117,766
tf - 117,766
LSA # components: 100 100 LDA # topics: 200 200
FastText - 300
P-mean P-values:{−∞,1,2,3,∞} 1500
Table 3: Benchmark methods
k1 semsq semth acc loss std score
2.0 true 0.0 21.46 28.08 1.5773
2.0 true 0.1 21.46 28.09 1.5759
1.6 true 0.0 21.26 28.12 1.5412 1.6 true 0.1 21.24 28.13 1.5397 2.0 true 0.2 21.24 28.35 1.5127 1.6 true 0.2 21.26 28.40 1.4739
Table 4: Bestfscsconfigurations
as macro-averaged recall or F1-score is used. Our benchmarks consist of other state-of-the-art content feature generation methods: term fre-quency (tf), tf ·idf, Latent Semantic Analysis (LSA,Deerwester et al.(1990)), Latent Dirichtlet Allocation (LDA,Blei et al.(2003)), concatenated power mean word embeddings (P-mean, Rücklé et al. (2018)), and FastText sentence embeddings (Bojanowski et al., 2017). All benchmark meth-ods, parameter settings and dimension sizes are shown in Table3.
Feature transformation models (tf, tf·idf, LSA, LDA) are trained on the entire training direc-tory. Additionally, when using such transformation models, words are stemmed to reduce inflectional word forms to their word stem.
5 Results
This section discusses our results from parameter tuning and the subsequent supervised classification task.
5.1 Parameter tuning
5.1.1 Semantic cluster similarity
Parameter combinations have been attempted and results have been retrieved for the used dataset. For each quality measure, the 3 best scores have been retrieved, returning all instances that conform to that score. The results are shown in Table4.
Table4tells us that squaring the semantic simi-larity score works well. High accuracy scores are retrieved, accounting for the fact that evaluations are made based on maximum similarity scoring instead of a predictive model. As we are able to retrieve six configurations, we note that quality
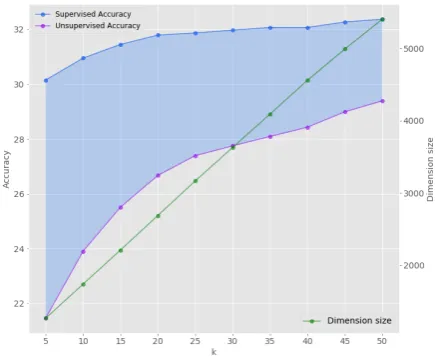
Figure 2: Concept clustering parameter tuning
measures tend to score parameter settings similarly. The configuration with k1 = 2.0, semsq = true andsemth = 0.0 across quality measures is the best performing.
5.1.2 Concept clustering
Next, we study the influence of parameter k on concept cluster construction. For each setting, we present the accuracy scores and dimension sizes in Figure2.
With increasingk, more concept clusters of un-used single terms are added. As a result, the di-mension size steadily increases. We can see that accuracy also shows an increasing trend with the value of k. When more unused single terms are added, we run the risk of overfitting. The ratio of single terms to broader concept clusters increases with k, thereby relatively shifting the focus from broader concepts to frequently occurring distinc-tive individual terms. This behaviour is also re-flected in the graph, in the relative performance difference between unsupervised and supervised scoring. Although supervised accuracy is un-doubtedly higher with lower number of concept clusters, both accuracy scores converge with in-creasing k. By adding unused single terms, the unsupervised ranking method is able to capture an increasing number of edge cases, leading to a convergence in performance. This behaviour is an indication of overfitting.
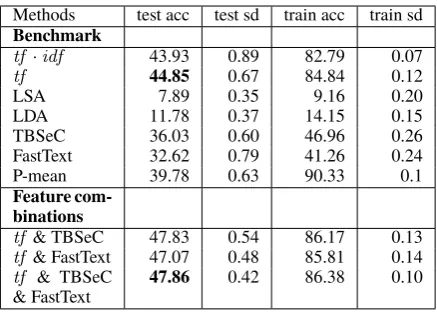
Methods test acc test sd train acc train sd
Benchmark
tf·idf 43.93 0.89 82.79 0.07
tf 44.85 0.67 84.84 0.12
LSA 7.89 0.35 9.16 0.20 LDA 11.78 0.37 14.15 0.15 TBSeC 36.03 0.60 46.96 0.26 FastText 32.62 0.79 41.26 0.24 P-mean 39.78 0.63 90.33 0.1
Feature com-binations
tf & TBSeC 47.83 0.54 86.17 0.13
tf & FastText 47.07 0.48 85.81 0.14
tf & TBSeC & FastText
47.86 0.42 86.38 0.10
Table 5: Invoice classification results
goal of TBSeC is relating input to broader con-cepts, which is why a relatively moderate value for kis preferred.
5.2 Invoice classification
In this section, we discuss the results of our method against state-of-the art benchmark methods in a su-pervised invoice classification task. The results, consisting of cross validated accuracy scores with standard deviation (sd), are shown in Table5under header ‘Benchmark’. The fact that term frequency has comparable performance totf ·idf reinforces the notion that all terms within an invoice descrip-tion are important to take into account and that term-specific weighting has limited value. More-over, techniques that are concerned with dimen-sionality reduction (LSA, LDA) perform worse, arguably because they truncate a large amount of information, most of which should have been re-tained. Sentence embeddings and our method TB-SeC perform relatively well, with accuracy scores nearing performance levels of tf ·idf and term frequency. Furthermore, a large feature space (1500D) that is achieved with P-mean embeddings appears to have a positive influence on the amount of information that is contained. It is also found that methodstf ·idf, term frequency and P-mean have a tendency to overfit on the data, having cross-validation training accuracy scores of over 80%. In comparison, TBSeC and FastText have training ac-curacy scores closer to test acac-curacy scores.
Combinations of techniques are attempted next to improve performance. The feature combinations are formed by concatenating the feature spaces of each method. The most successful combina-tions are highlighted in Table5under header ‘Fea-ture combinations’. Combining fea‘Fea-ture generation
techniques leads to surprising results. P-mean per-forms well as sole feature, but doesn’t yield better results when combined with other techniques. In contrast, FastText does pair well with other tech-niques and improves performance levels. More-over, when TBSeC is used performance is even bet-ter. Term frequency in combination with both TB-SeC and FastText does also improve performance, although slightly. TBSeC and FastText are more likely to be complementary as soon as TBSeC en-compasses lower number of concept clusters, but this doesn’t guarantee better overall performance. In the current configuration it manages to perform better, but the difference is not major. The tendency to overfit fortf ·idf, term frequency and P-mean is a likely cause for some of the other unsuccessful feature combinations.
6 Conclusion
A new feature generation framework TBSeC was presented that is suited to the prediction of well defined classes on the basis of very short texts (2.8 words on average). Generated features were proven to be able to function well independently and jointly with traditional feature generation tech-niques. Performance and reliability was improved by pairing multiple disjoint feature generation tech-niques, including TBSeC. A combination of highly specific features with more flexible ones was found to lead to the best results. Combinations of fea-tures were found to reach a bound in effectiveness, highlighting that methods ultimately start imped-ing each other. Businesses can use our method to derive actionable insights from online user gener-ated content such as firm-specific tweets, online re-views and customer chats logs. Future work could test TBSeC on larger texts, since it offers more room to differentiate from sentence embeddings.
References
Vibhanshu Abhishek and Kartik Hosanagar. 2007. Key-word generation for search engine advertising using semantic similarity between terms. InProceedings
of the ninth international conference on Electronic
commerce. ACM, pages 89–94.
Ayush Aggarwal, Chhavi Sharma, Minni Jain, and Amita Jain. 2018. Semi supervised graph based key-word extraction using lexical chains and centrality measures. Computación y Sistemas22(4).
Izzat Alsmadi and Ikdam Alhami. 2015. Clustering
Matt Kusner, Yu Sun, Nicholas Kolkin, and Kilian Weinberger. 2015. From word embeddings to docu-ment distances. InInternational Conference on
Ma-chine Learning. pages 957–966.
Quoc Le and Tomas Mikolov. 2014. Distributed repre-sentations of sentences and documents. In
Inter-national Conference on Machine Learning. pages
1188–1196.
Qian Liu, Heyan Huang, Yang Gao, Xiaochi Wei, Yuxin
Tian, and Luyang Liu. 2018. Task-oriented word
embedding for text classification. InProceedings of
the 27th International Conference on Computational Linguistics. pages 2023–2032.
Debanjan Mahata, John Kuriakose, Rajiv Ratn Shah,
and Roger Zimmermann. 2018. Key2vec:
Auto-matic ranked keyphrase extraction from scientific ar-ticles using phrase embeddings. InProceedings of
the 2018 Conference of the North American Chap-ter of the Association for Computational Linguistics: Human Language Technologies, Volume 2 (Short Pa-pers). pages 634–639.
Tomas Mikolov, Kai Chen, Greg Corrado, and
Jef-frey Dean. 2013. Efficient estimation of word
representations in vector space. arXiv preprint
arXiv:1301.3781.
Paolo Missier, Alexander Romanovsky, Tudor Miu, Atinder Pal, Michael Daniilakis, Alessandro Gar-cia, Diego Cedrim, and Leonardo da Silva Sousa. 2016. Tracking dengue epidemics using twitter con-tent classification and topic modelling. In
Inter-national Conference on Web Engineering. Springer,
pages 80–92.
Jeffrey Pennington, Richard Socher, and Christopher Manning. 2014. Glove: Global vectors for word rep-resentation. InProceedings of the 2014 conference
on empirical methods in natural language processing
(EMNLP). pages 1532–1543.
Matthew E Peters, Mark Neumann, Mohit Iyyer, Matt Gardner, Christopher Clark, Kenton Lee, and Luke Zettlemoyer. 2018. Deep contextualized word repre-sentations.arXiv preprint arXiv:1802.05365.
Yafeng Ren, Ruimin Wang, and Donghong Ji. 2016. A topic-enhanced word embedding for twitter senti-ment classification. Information Sciences369:188– 198.
Stephen Robertson, Hugo Zaragoza, et al. 2009. The probabilistic relevance framework: Bm25 and be-yond. Foundations and Trends® in Information
Re-trieval3(4):333–389.
Andreas Rücklé, Steffen Eger, Maxime Peyrard, and Iryna Gurevych. 2018. Concatenated p-mean word embeddings as universal cross-lingual sentence rep-resentations. arXiv preprint arXiv:1803.01400.
Mehran Sahami and Timothy D Heilman. 2006. A web-based kernel function for measuring the similarity of short text snippets. In Proceedings of the 15th
international conference on World Wide Web. AcM,
pages 377–386.
Gerard Salton and Christopher Buckley. 1988. Term-weighting approaches in automatic text retrieval.
Information processing & management 24(5):513–
523.
Monika Singh, Divya Bansal, and Sanjeev Sofat. 2016. Behavioral analysis and classification of spammers distributing pornographic content in social media.
Social Network Analysis and Mining6(1):41.
Ge Song, Yunming Ye, Xiaolin Du, Xiaohui Huang, and Shifu Bie. 2014. Short text classification: A survey.Journal of multimedia9(5):635–644.
Olga Vechtomova. 2009. Query Expansion for
Infor-mation Retrieval, Springer US, Boston, MA, pages
2254–2257.
Kalliopi Zervanou, Elias Iosif, and Alexandros Potami-anos. 2014. Word semantic similarity for morpho-logically rich languages. InProceedings of the Ninth
International Conference on Language Resources and Evaluation, LREC 2014, Reykjavik, Iceland,