ABSTRACT
GEGICK, MICHAEL CHARLES. Predicting Attack-prone Components with Source Code Static Analyzers. (Under the direction of Laurie Williams).
No single vulnerability detection technique can identify all vulnerabilities in a software system. However, the vulnerabilities that are identified from a detection technique may be predictive of the residuals. We focus on creating and evaluating statistical models that predict the components that contain the highest risk residual vulnerabilities.
The cost to find and fix faults grows with time in the software life cycle (SLC). A challenge with our statistical models is to make the predictions available early in the SLC to afford for cost-effective fortifications. Source code static analyzers (SCSA) are available during coding phase and are also capable of detecting code-level vulnerabilities. We use the code-level vulnerabilities identified by these tools to predict the presence of additional coding vulnerabilities and vulnerabilities associated with the design and operation of the software. The goal of this research is to reduce vulnerabilities from escaping into the field by incorporating source code static analysis warnings into statistical models that predict which components are most susceptible to attack.
We evaluated our model on three commercial telecommunications software systems. Two case studies were performed at an anonymous vendor and the third case study was performed at Cisco Systems. Each system is a different technology and consists of over one million source lines of C/C++ code. The results show positive and statistically significant correlations between the metrics and vulnerability counts. Additionally, the predictive models produce accurate probability rankings that indicate which components are most susceptible to attack. The models are evaluated with receiver operating characteristic curves where each case study showed over 92% of the area was under the curve. We also performed five-fold cross-validation to further demonstrate statistical confidence in the models. Based on these results we contribute the following theory:
Theory: Above a statistically determined threshold, SCSA vulnerability warnings are in the same components as vulnerabilities that are likely to be exploited.
Predicting Attack-prone Components with Source Code Static Analyzers
by
Michael Charles Gegick
A dissertation submitted to the Graduate Faculty of North Carolina State University
in partial fulfillment of the requirements for the degree of
Doctor of Philosophy
Computer Science
Raleigh, North Carolina 1 May 2009
APPROVED BY:
_______________________________ ______________________________ Jason Osborne Mladen Vouk
BIOGRAPHY
ACKNOWLEDGEMENTS
TABLE OF CONTENTS
List of Tables ... vi
List of Figures ... vii
Glossary ...1
Introduction...8
Background ...13
Defining Vulnerability ...13
Calculating Security Risk ...15
Source Code Static Analyzers...16
Statistical Overview ... 17
Correlations and Collinearity... 17
Cross-validation and ROC Curves... 18
Classification and Regression Trees (CART)... 19
The Common Weakness Enumeration... 19
Related Work ... 21
Fault-prone Components... 23
Failure-prone Components... 24
Predicting Fault- and Failure-prone Components with SCSA... 25
Vulnerability Prediction Models... 27
The Effect of Complexity on SCSA ... 28
Vulnerability and Attack-prone Components ... 30
The Coupling Effect... 33
Background ... 33
The Static-dynamic Coupling Effect ... 35
The Goal, Question, Metric Approach... 38
Research Goals, Questions, Metrics, Models, and Responses... 41
Three Industrial Case Studies ... 49
Case Study 1 ... 49
Classification of SCSA Warnings According to the CWE... 51
Failure Report Classification ... 53
Classification of Vulnerabilities According to the CWE... 55
Case Study 2 ... 56
Case Study 3 ... 58
Candidate Metrics ... 58
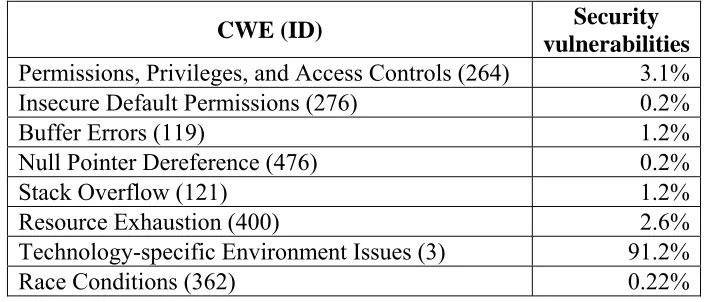
Security Vulnerabilities ... 60
Research Methodology ... 62
Correlations to Vulnerabilities ... 63
Discriminatory Techniques ... 63
Model Validation... 64
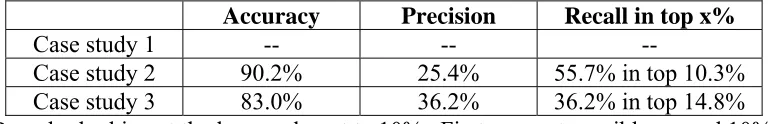
Model Efficacy ... 65
Limitations of the Approach and Threats to Validity of the Case Studies ... 66
Limitations... 66
Threats to Validity... 67
Results for Three Case Studies ... 69
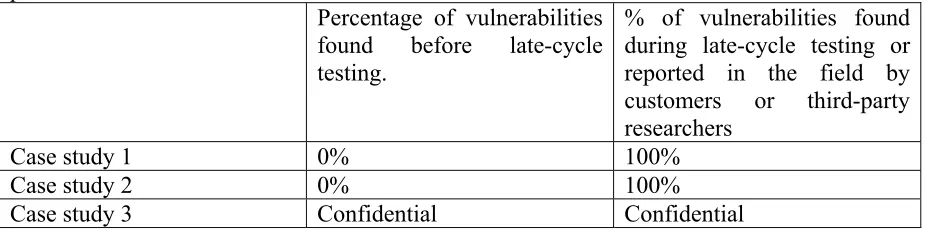
An Analysis of When Vulnerabilities are Identified ... 69
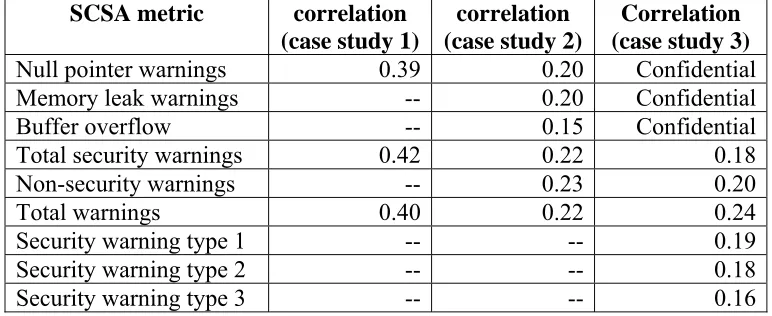
Correlations Between SCSA Warnings and Vulnerability Counts for Three Case Studies.. 70
CART with SCSA only for Three Case Studies... 71
Results for Three Case Studies with Multiple Metrics ... 75
Correlation Between Candidate Metrics and Vulnerability Counts for Three Case Studies ... 75
Collinearity between Candidate Metrics for Three Case Studies... 76
CART Models with Multiple Metrics for Three Case Studies... 77
Discussion of CART Results... 79
Model Validation for Three Case Studies... 82
ROC Curves and Cross-Validation ... 82
Cost Analysis of Models... 86
Contribution of SCSA Warnings in the CART Models with Multiple Metrics ... 87
Discussion ... 89
Summary of Research Contributions, Observations, and Theories ... 91
Future Work ... 93
References... 95
Appendix... 105
Appendix A... 106
Appendix B ... 107
Appendix C ... 108
Appendix D... 109
Appendix E ... 110
Appendix F... 111
LIST OF TABLES
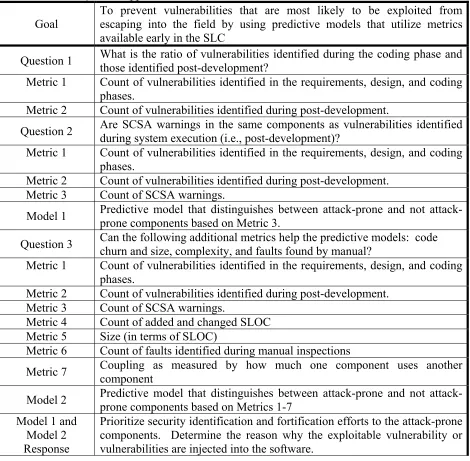
Table 1. The GQM-MR Approach...48
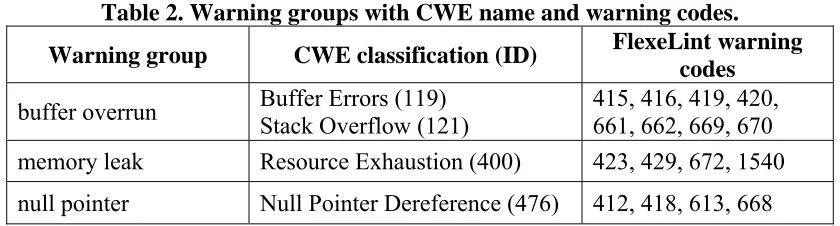
Table 2. Warning groups with CWE name and warning codes...52
Table 3. Audited and un-audited SCSA warnings from FlexeLint...52
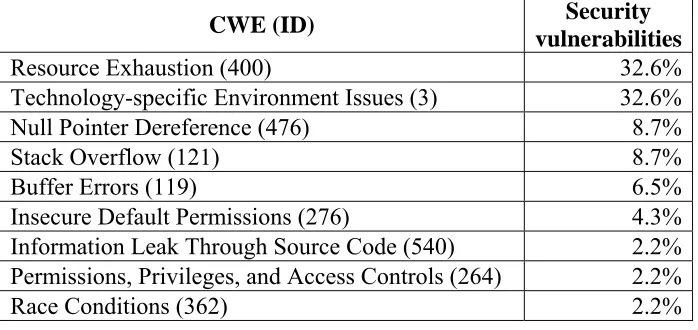
Table 4. Vulnerabilities present in Case Study 1...56
Table 5. Vulnerabilities present in the Case Study 2 ...58
Table 6. Percentage of vulnerabilities identified ...69
Table 7. Correlations between SCSA warnings and vulnerabilities ...70
Table 8. Model efficacy for SCSA warnings alone – top 10%...72
Table 9. Model efficacy for SCSA warnings alone – top 20%...72
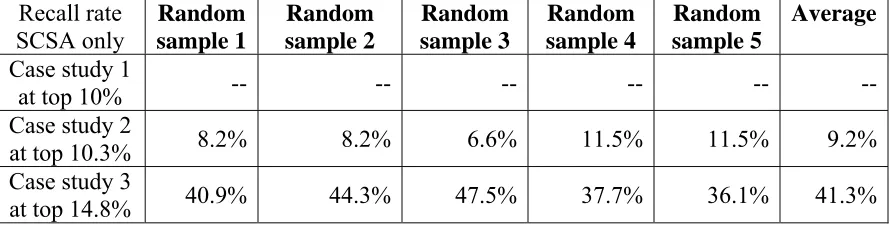
Table 10. Efficacy of finding attack-prone components via random sampling – 10%...73
Table 11. Efficacy of finding attack-prone components via random sampling – 20%...73
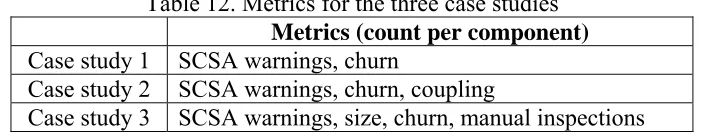
Table 12. Metrics the the three case studies. ...75
Table 13. Spearman rank correlation coefficients ...76
Table 14. Correlation matrix for candidate metrics for Case Study 2. ...77
Table 15. Correaltion matrix for candidate metrics for Case Study 3. ...77
Table 16. Model effiacy for multiple metrics – 10% ...78
Table 17. Model effiacy for multiple metrics – 20%...78
Table 18. Efficacy of finding attack-prone components via random sampling – 10%...78
Table 19. Efficacy of finding attack-prone components via random sampling – 20%...79
Table 20. CART restuls for Case Study 3...80
Table 21. Area under the curve with SCSA warnings. ...83
Table 22.Area under the curve with multiple metrics...83
LIST OF FIGURES
Figure 1 The difference between reliability and security ...22
Figure 2 Visualization of model results for Case Study 3 ...81
Figure 3 Case Study 1 ROC Curve SCSA only...85
Figure 4 Case Study 1 ROC Curve multiple metrics...85
Figure 5 Case Study 2 ROC Curve SCSA only...85
Figure 6 Case Study 2 ROC Curve multiple metrics...85
Figure 7 Case Study 3 ROC Curve SCSA only...85
Glossary
Architectural design - (1) The process of defining a collection of hardware and software
components and their interfaces to establish the framework for the development of a
computer system. (2) The result of the process in (1) [47].
Component – “an entity with discrete structure, such as an assembly or software module,
within a system considered at a particular level of analysis” [49].
Error - (1) The difference between a computed, observed, or measured value or condition
and the true, specified, or theoretically correct value or condition. For example, a difference
of 30 meters between a computed result and the correct result. (2) An incorrect step, process,
or data definition. For example, an incorrect instruction in a computer program. (3) An
incorrect result. For example, a computed result of 12 when the correct result is 10. (4) A
human action that produces an incorrect result. For example, an incorrect action on the part
of a programmer or operator [47]. Note: While all four definitions are commonly used,
definitions 2, 3, and four can be synonymous with other terms. The second definition of
error is synonymous with definition 2 of fault. Definition 3 is synonymous with failure.
Definition 4 is synonymous with mistake. See also fault.
Execute - to carry out an instruction, process, or computer program. [47]
Execution time - The amount of elapsed time or processor time used in executing a
computer program. Note: Processor time is usually less than elapsed time because the
other tasks during the execution of a program. Syn: run time (3); running time. See also:
overhead time. [47]
External metric - External metrics ISO/IEC 9126-2 describes those metrics that represent
the external perspective of software quality when the software is in use. The external
measures are taken over some predefined period while the software is in use. Values for
quantities like time and effort are used as the basis for these measures. These measures apply
in both the testing and operation phases. When used during test they are meant to be early
predictors of the levels of quality that can be expected once the software is used and
operated. These measures generally represent the quality in terms that people use to
communicate it [48].
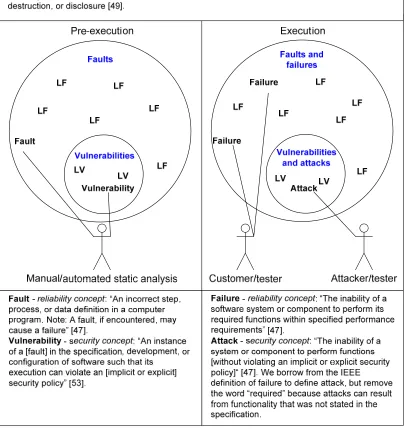
Failure - reliability concept: “The inability of a software system or component to perform
its required functions within specified performance requirements” [49].
Failure-prone component - reliability concept: A component that will likely fail due to the
execution of faults [85].
We illustrate the difference between faults, failures, vulnerabilities, and attacks in Figure 1.
Fault - “An incorrect step, process, or data definition in a computer program. Note: A fault,
if encountered, may cause a failure” [49].
Fault-prone component - “A component that will likely contain faults” [20].
Fault tolerance - (1) The ability of a system or component to continue normal operation
despite the presence of hardware or software faults. (2) The number of faults a system or
errors, faults, and failures, and of methods for enabling systems to continue normal operation
in the presence of faults.
Internal metric - ISO/IEC 9126 describes those metrics that measure internal attributes of
the software related to design and code. These “early” measures are used as indicators to
predict what can be expected once the system is in test and operation. Therefore the internal
measures are most important to development managers since they are a valuable device for
forestalling downstream problems. Internal measures are used to predict the values of
corresponding external measures. The internal metrics standard (ISO/IEC 9126-3) shows the
relationship between external and internal metrics [48].
Measure - The number or category assigned to an attribute of an entity by
making a measurement. See also metric. [48].
Measurement scale - A scale that constrains the type of data analysis that can be
performed on it. See also measure.
NOTE - Examples of scales are: a nominal scale which corresponds to a set of
categories; an ordinal scale which corresponds to an ordered set of scale points; an
interval scale which corresponds to an ordered scale with equidistant scale points; and
a ratio scale which not only has equidistant scale point but also possess an absolute
zero [48].
Metric - A measurement scale and the method used for measurement. The word "measure"
is used to refer to the result of a measurement. See also measure.
NOTES
2. Metrics include methods for categorizing qualitative data. [48].
Mistake - A human action that produces an incorrect result. Note: The fault tolerance
discipline distinguishes between the human action (a mistake), its manifestation (a hardware
or software fault), the result of the fault (a failure), and the amount by which the result is
incorrect (the error) [47].
Natural unit – A unit other than time that is related to the amount of processing preformed
by software-based product, such as runs, pages of output, transactions, telephone calls, jobs,
semiconductor wafers, queries, or API calls [63].
Operational vulnerability - A vulnerability in the configuration, environment, or general
use of the software [23]. For example, an unsafe open()on a file where read/write locks on
the same file are possible by other users in the system. System administrators must configure
their system so users do not have write permissions to these files. See also vulnerability.
Reliability - “The ability of a system or component to perform its required functions under
stated conditions for a specified period of time” [49].
Risk - “the potential for realization of unwanted, negative consequences of an event” [81]. Risk analysis -”produces assessments of the loss-probability and loss-magnitude associated
with each of the identified risk items, and assessments of compound risks involved in
risk-item interactions. Typical techniques include network analysis, decision trees, cost models,
and performance models” [12].
Risk assessment –“involves risk identification, risk analysis, and risk prioritization” [12] Risk management – an emerging discipline whose objectives are to identify, address, and
operation or major sources of software rework” [12]. “The practice of risk management
involves two primary steps, risk assessment and risk control, each with three subsidiary
steps” [12].
Risk identification - “produces lists of the project-specific risk items likely to compromise a
project’s satisfactory outcome. Typical risk identification techniques include checklists,
decomposition, comparison with experience, and examination of decision drivers” [12]
Risk prioritization - ”produces a prioritized ordering of the risk items identified and
analyzed. Typical techniques include risk exposure analysis, RRL analysis, and Delphi or
group-consensus techniques” [12].
Run - (1) In software engineering, a single, usually continuous, execution of a computer
program. See also: run time. (2) To execute a computer program. [47]
Run time - (1) The instant at which a computer program begins to execute. (2) The period
of time during which a computer program is executing. (3) See: execution time. [47]
Security - “The protection of system items from accidental or malicious access, use,
modification, destruction, or disclosure” [49].
Security design flaw – A vulnerability that occurs from a mistake in the design and
precludes the program from operating securely, no matter how perfectly it is implemented by
the coders [95]. Examples of design flaws include a lack of or incorrect auditing/logging,
ordering and timing faults, and improper authentication [56]. See also vulnerability.
Security design flaw is shortened to “design flaw” in security jargon.
Security implementation bug – A vulnerability at the code-level of a software system [56].
vulnerability. Security implementation bug is shortened to “implementation” in security
jargon.
Software engineering is “the application of science and mathematics by which the
capabilities of computer equipment are made useful to man via computer programs,
procedures, and associated documentation” [11].
Software life cycle - The period of time that begins when a software product is conceived
and ends when the software is no longer available for use. The software life cycle typically
includes a concept phase, requirements phase, design phase, implementation phase, test
phase, installation and checkout phase, operation and maintenance phase, and, sometimes,
retirement phase. Note: These phases may overlap or be performed iteratively [47].
Software project – “an organizational effort over a limited period of time, staffed with
people and equipped with the other required resources to produce a certain result” [26] .
Software process – “the set of principles, methods, and tools used by a project. A
development process defines which activities receive what emphasis, and how and in what
sequence they are performed. Accordingly, different process models are used” [26].
Security assurance (or simply assurance) – “confidence that an entity meets its security
requirements, based on specific evidence provided by the application of assurance
techniques” [8].
Static - Pertaining to an event or process that occurs without computer program execution
[47].
Static analysis - The process of evaluating a system or component based on its form,
Trustworthy – “An entity is trustworthy if there is sufficient credible evidence leading one
to believe that the system will meet a set of given requirements. Trust is a measure of
trustworthiness, relying on evidence provided” [8].
Vulnerability - An instance of a [fault] in the specification, development, or configuration of
1.
Introduction
Security vulnerabilities can occur because of subtleties and false assumptions in the
design or code of a software system [56]. Security engineers often need more time to
uncover and fix these problems than their release schedule permits, and so vulnerabilities are
inevitably released with the software. Additionally, there are usually fewer security
engineers assigned to projects than general reliability engineers, but the security engineers
are responsible for testing the security posture of the entire system. Attackers have the
advantage of time; they can spend months or years building an exploit for just one area of a
software system. Collectively, these conditions necessitate security risk management where
security efforts are prioritized to the highest security risk software components to minimize
damage to the end user.
Security should be designed and built into the software to prevent attackers from
exploiting the software [2]. McGraw [56] uses the term “software security” to refer to the
idea of building security into the software. The idea of buildingsecure software implies that
good software engineering practices are necessary to properly incorporate security into the
software life cycle (SLC) [90]. Techniques that improve software security efforts can
alleviate the dependence on protection mechanisms such as firewalls, anti-virus software, and
intrusion detection systems as the first and only line of defense. For example, the Morris
worm exploited a buffer overflow in the finger service on Unix systems [80]. Software tools
such as source code static analyzers by Fortify Software1, Klocwork2, and Gimpel3 analyze
1 http://www.fortify.com
the source code for buffer overflows, among other vulnerabilities, and can be used during the
coding phase of the SLC. If a source code analyzer was available to a software engineers
that implemented the finger service, they may have identified the buffer overflow and
prevented the Morris worm from propagating on the Internet. As Ranum [57] states, security
should be built into the software and closely monitored for attacks and thus externally
applied protection mechanisms should be used in addition to software security. In this
dissertation, we focus on software security. Specifically, we address the
previously-mentioned limitations using predictive models to prioritize security efforts to the software
components most susceptible to attack.
The cost to find and fix faults grows with time in the SLC [11]. For example, the cost to
find and fix vulnerabilities is twice as expensive in late-cycle testing phases (where
penetration, system, and function testing is performed) than in the coding phase [11].
Further, the cost to find and fix vulnerabilities is 15 times more expensive in operation than
during the coding phase [11]. Early knowledge of which components should receive the
most security effort can reduce the number of end-user-installed security patches. The cost
for technical support, development of the patch, testing, and deploying a patch is much
higher than if security is built into the software at the onset of the software process.
Additionally, some users may be unable to deploy a patch to their software systems. For
example, a service provider that owns hundreds or thousands of vulnerable software units
cannot simply deploy a patch to all of the vulnerable units. The so-called
patch” technique where end-users and attackers are performing the penetration tests is not an
economically viable means to securing software.
No single vulnerability detection technique can identify all vulnerabilities in a software
system [96]. For example, performing architectural risk analyses in the design phase of the
SLC may not identify insecure permissions for an asset or vulnerable states in protocol
implementation code during penetration testing. However, the vulnerabilities that are
identified from a detection technique may be predictive of the residuals. We focus on
creating and evaluating statistical models that predict the components that contain the highest
risk residual vulnerabilities.
A challenge with our statistical models is to make the predictions available early in the
SLC to afford for cost-effective fortifications. Source code static analyzers (SCSA) are
available during coding phase and are also capable of detecting code-level vulnerabilities.
We use the code-level vulnerabilities identified by these tools to predict the presence of
additional coding vulnerabilities and vulnerabilities associated with the design and operation
of the software. The goal of this research is to reduce vulnerabilities from escaping into the
field by incorporating source code static analysis warnings into statistical models that predict which components are most susceptible to attack.
The independent variable for our statistical model is the count of security-related SCSA
warnings. We also include the following metrics as independent variables in our models to
determine if additional metrics are required to increase the accuracy of the model:
non-security SCSA warnings, code churn and size, the count of faults found manually during
the count of vulnerabilities reported by testing and those found in the field. To meet our
research goal, we make the following hypothesis:
Hypothesis: Above a statistically determined threshold, SCSA vulnerability warnings are
in the same components as vulnerabilities that are likely to be exploited.
We evaluated our model on three commercial telecommunications software systems.
Two case studies were performed at an anonymous vendor and the third case study was
performed at Cisco Systems. Each system is a different technology and consists of over one
million source lines of C/C++ code. The results show positive and statistically significant
correlations between the metrics and vulnerability counts. Additionally, the predictive
models produce probability rankings that indicate which components are most susceptible to
attack. The models are evaluated with receiver operating characteristic curves where each
case study showed over 92% of the area was under the curve. We also performed five-fold
cross-validation to further demonstrate statistical confidence in the models. Based on these
results we contribute the following theory:
Theory: Components that contain security-related warnings identified by SCSA are also
likely to contain other exploitable vulnerabilities. Software engineers should systematically
inspect and test code for other vulnerabilities when a security-related warning is present.
In Chapters 2 and 3, we provide background and related work. In Chapter 4 we define
vulnerability- and attack-prone components. In Chapter 5 we introduce the static-dynamic
coupling effect. In Chapter 6, we provide the Goals, Questions, Metrics, Models, and
and Responses. In Chapter 8, we review our three empirical case studies. In Chapter 9, we
provide our research methodology. In Chapter 10, we present our limitations and threats to
validity. In Chapter 11, we report the results for three case studies with SCSA metrics. In
Chapter 12, we report the results with multiple metrics. In Chapter 13, we show the steps we
performed to evaluate our models. In Chapter 14 we provide some discussions about our
results. In Chapter 15, we summarize our research contributions, observations, and theory.
2.
Background
2.1
Defining Vulnerability
Vulnerability - An instance of a [fault] in the specification, development, or configuration of
software such that its execution can violate an [implicit or explicit] security policy [53].
Krsul [23] states that a vulnerability is an instance of an error in the specification,
development, or configuration of software such that its execution can violate a security
policy. Our research is performed in the context of the fault tolerance discipline and thus
error is replaced by fault. The usage of fault in the definition of vulnerability simplifies the
parallelism of this research to the reliability context. In the IEEE Standard Glossary of
Software Engineering Terminology [53], the second definition of error is essentially identical
to the second definition of fault (see Chapter 2.1).
Many terms in the security realm are not formally defined by standards bodies such as
IEEE. For example, vulnerability, exploit, attack and threat are not defined by the IEEE
Standard Glossary of Software Engineering Terminology [53] because it was published in
1990 before the prominence of security in software engineering. This research acknowledges
the terms “implementation bugs,” “design flaws,” and “operational vulnerabilities” which are
used in practice to describe different categories of vulnerabilities, but are not recognized by
international or standards organizations. An objective and repeatable method or taxonomy
Implementation bugs (implementation vulnerabilities) are security faults that occur in the
source code of a software system [95]. Examples of implementation vulnerabilities include
buffer overflows, not checking return codes, and not handling unexpected input properly.
Source code static analysis tools are created to identify these code-level faults.
A design flaw (design vulnerability) is an instance of a mistake in the design of a
software system [42]. Examples of design vulnerabilities include error-handling and recover
systems that fail in an insecure fashion, object-sharing systems that mistakenly include
transitive trust issues, object-sharing, unprotected data channels, incorrect or missing access
control mechanisms, lack of auditing/logging or incorrect logging, and ordering and timing
errors. Wysopal et al. further state that design vulnerabilities can occur regardless of how
perfectly the code is implemented [95]. Additionally, Dowd et al. [23] state that a design
vulnerability occurs when the software is implemented to perform an insecure function.
Operational vulnerabilities are another class of vulnerabilities is suggested by Dowd et al.
[23]. Operational vulnerabilities are problems that occur through the operational procedures
and general use of software in given environment. For example, an insecure configuration
change to a software system in an environment that affords an attacker to exploit the system
is an operational vulnerability. Other examples include social engineering attacks, theft,
problems with supporting software and computers, and problems caused by automated and
manual processes that surround the system.
Security experts view vulnerabilities at different levels of abstraction in vulnerabilities.
For example, a buffer overflow could be considered an implementation vulnerability because
code. The same vulnerability could be considered a design flaw because variables, program
state, and function arguments are adjacent on the stack in the architecture of the C
programming language and thus apt to be overwritten. The classification of bugs, flaws, and
operational vulnerabilities may be helpful in distinguishing which types of vulnerabilities an
SCSA can detect.
According to McGraw [56], up to 60% of security vulnerabilities are design flaws. At
Microsoft, the infestation of vulnerabilities is a 50/50 split between implementation bugs and
design flaws [43]. SCSA analyze code and are therefore more apt at revealing
implementation bugs than design flaws and operational vulnerabilities. In security, design
and operation problems may require testing or architectural risk analyses for precise
identification. The predictive part of this research will attempt to indicate the existence of
the more complex and abstract design vulnerabilities and operational vulnerabilities in a
component based on the presence of SCSA warnings under the premise that where there are
code-level problems there are likely to be other coding, design, and operational
vulnerabilities present.
2.2
Calculating Security Risk
The traditional formula for calculating risk in the general reliability realm is probability
that the failure will occur multiplied by the impact to the system [11]. In the context of
security, the value of risk is similarly calculated by multiplying the threat likelihood by the
threat impact [87]. In this research we use a more intuitive definition of risk as proposed in
[93]. The risk is calculated as the product of ease of attack multiplied by the value of the
We will investigate if statistical models can predict which components have the most
security risk. The models will rank the vulnerability- and/or attack-prone components by the
estimated probability of being vulnerable based on the values that the metrics uses to
measure the characteristics of that component. The metrics may indicate that some
components are inherently more insecure due to their exposure to un-trusted input. The
exposure of a component is best defined by the term attack-surface. According to Howard
and Lipner, the attack surface of an application is the union of code, interfaces, services, and
protocols available to all users, especially what is accessible by unauthenticated or remote
users [44].
2.3
Source Code Static Analyzers (SCSA)
We use source code analysis tool output as one of our candidate metrics for the case
study in this paper. A source code analysis tool statically analyzes the content of a software
system to detect faults without executing the code [16]. Fault-based testing is the idea of
testing for pre-specified faults [60]. Although source code analyzers do not execute software
as performed by testing, they do identify specific faults.
We use the term “source code static analyzer” (SCSA) to refer to the use of static analysis
tools that analyze source code. Examples of the types of problems identified by SCSA tools
include the detection of calls to potentially insecure library functions, bounds-checking errors
and scalar type confusion. SCSA tools perform analyses such as semantic, structural,
configuration, control- and data-flow analyses. The output of an SCSA tool is a warning.
The warnings describe a fault in the software that could lead to a failure. A true positive is a
misclassifies code as faulty. Increasingly, SCSA tools are used to identify security
vulnerabilities [17].
2.4
Statistical Overview
The input variables and assumptions about the distribution (e.g., Poisson) constitute a
statistical model [54]. We also include the data set in which the model is applied to in the
definition of a statistical model. Statistical models have been used in many applications. For
example, logistic regression can be used to measure thermal distress on the Space Shuttle
Challenger O-Rings [54], the Poisson distribution has been used to measure insect counts in
insect control experiments [54], discriminant analysis was used by Fisher to classify which
species an Iris flower belonged to [83]. These same models have been applied to the
software reliability realm (e.g. [52, 77]). The models proposed in this dissertation are
fundamentally different than the reliability realm because the dependent variable, security
failures, is a distinct subset of the reliability failures that provide deviant operational profiles
that afford an attacker to exploit a software system. This size of the data sets for case studies
1 and 2 is 4.2% and 4.7%, respectively, of the entire failure report population. If the
populations of vulnerabilities were a large percentage of the non-security faults, then we
would then suggest that security prediction models that utilize the same metrics and
techniques as those in the reliability realm are too similar for a novel contribution to the field
of computer science.
2.4.1
Correlations and Collinearity
A correlation coefficient, r, measures how strongly two variables are linearly related [21].
value between 0 and 0.5 and a strong correlation is greater than or equal to 0.8, otherwise the
correlation is moderate [21]. Collinearity is defined as a high degree of correlation between
the independent variables of a statistical model [27]. Collinearity occurs when an excessive
number of input variables are used to determine an outcome, and the input variables measure
the same outcome [27].
2.4.2
Cross-validation and ROC Curves
To evaluate our models, we perform five-fold cross-validation. Five has been shown to
be a good value for performing cross-validation [41]. The cross-validation technique
validates the R2 (the fraction of variance explained by the model) by testing the model on
data the model has not used before to determine if the model is still effective [94]. The R2 is
called the coefficient of determination in the case of single independent variables –
coefficient of multiple determination when multiple independent variables are used. It is rare
to have high R2 values when the dependent variable is categorical [84].
The five-fold cross-validation divides (“folds”) the total system components into five
groups consisting of approximately equal numbers of randomly-chosen components. One
group is used as the test set, and the training set consists of the remaining four groups of
components. The model is trained on the training set, and the training analysis is compared to
the outcomes of the test set to validate how well the model performs on data that have not
been “seen” before. Each of the five groups of components takes one turn as the test set.
After the five analyses are performed, the average error is calculated over the five trials.
Additionally, we will use receiver operating characteristic (ROC) curves to quantify the
rate of the predictive model and the x-axis is the false positive rate. An area under the ROC
curve equal to 50% indicates that the model has no effective utility to a software engineer.
The area should approach 100% to be effective for software engineers.
2.4.3
Classification and Regression Trees (CART)
CART is a statistical technique that recursively partitions data according to X and Y
values. The result of partitioning is a tree of groups where the X values of each group best
predicts a Y value. The leaves of the tree are determined by the largest likelihood-ratio
chi-square statistic. The threshold, or split, between leaves is chosen by maximizing the
difference in the responses between any two leaves [83]. For the case study reported in this
paper, the X values are the candidate metrics and the Y value is a binary value describing a
component as attack-prone (value of one) or not attack-prone (value of zero). Due to the
binary dependent variable, the trees we construct are classification trees (as opposed to
regression trees). The CART technique has been shown to be useful for distinguishing
failure-prone from not failure-prone components in the reliability realm [91].
2.5
The Common Weakness Enumeration
We use Common Weakness Enumeration (CWE) names to identify the vulnerabilities so
our analysis can be repeated on other systems with the same vulnerability naming scheme.
The CWE [59] is a publicly-available aggregation of security-based vulnerability
taxonomies/sources. Examples of the taxonomies the CWE includes are including Seven
(PLOVER)4, ten from Open Web Application Security Project (OWASP)5, and the Web
Security Threat Classification6. The CWE describes software vulnerabilities in a consistently
named fashion. For this paper, we use the term “vulnerability” instead of the CWE term
“weakness.” Each classification of vulnerability contains the classification name and
classification ID. For example, with Null Pointer Dereference (476), Null Pointer
Dereference is the classification name and (476) is the unique ID given to the classification.
The appropriate method of citing a CWE vulnerability is to include both the name and ID.
4 http://cve.mitre.org/docs/plover
5 http://www.owasp.org/index.php/Main_Page
3.
Related Work
Extensive research, including [5, 14, 24, 40, 45, 46, 50, 58, 62, 64-68, 71, 72, 77, 88, 97]
has shown that software metrics can be used to identify fault- and failure-prone components
and to predict the overall reliability of a system early in the SLC. Recently, a parallel effort
has been applied at determining what metrics can predict vulnerable components [30, 74, 78,
86]. Figure 1 shows the difference between faults, failures, vulnerabilities, and attacks.
Faults and vulnerabilities refer to problems that are identified statically. Failures and attacks
are identified during program execution. Execution occurs during testing and when the
3.1
Fault-prone components
Fault-proneness refers the probability that software contains faults [47]. Limited
resources preclude software engineers from thoroughly testing a software system and
necessitates prioritization of verification and validation (V&V) efforts. To better manage a
software system, the system is broken down into smaller parts called components [97].
Software engineers can prioritize efforts at the component level so that quality efforts are
focused on the fault-prone components.
Various researchers have different thresholds for the binary classification of components
as fault-prone and not fault-prone. Their classification method may be due, in part, to the
available metrics and available data set. Nagappan et al. [69] use a conservative normal
statistical upper cut-off limit to determine the difference between a fault-prone and a
non-fault-prone component. Munson and Khoshgftaar [62] determined the number of faults
based on the grouping size for fault-prone and non-fault-prone components. In their
research, a fault-prone component has “relatively” more faults than a non-fault-prone
component.
One metric used to predict fault-prone components is code churn. Code churn is the
count of SLOC that has been added or changed in a component since the previous revision of
the software. Nagappan et al. [69] experimented with churn to determine if there was a
positive association between churn and defect density. In an analysis with Windows Server
2003, they discovered that there is a correlation and that churn can discriminate between
fault-prone and non fault-prone binaries with an accuracy of 89%. They also show that
predictor than the raw value of churn. Elbaum et al. [25] reported that code churn was a
more effective indicator or faults than other measures such as the number of people working
on the code and the number of change requests to that code.
The size (i.e. the count of source lines of code) of components has also been investigated
as a factor associated with the count of faults in seventeen releases of a software system.
Ostrand et al. [77] found that the size of a file had the most contribution to a negative
binomial model that predicted the count of faults in a software component. When ranking
the files in descending order of fault count with size alone, the top 20% of the files on
average accounted for 73% of the faults. They also used other metrics to determine if the
addition of those metrics increased the accuracy of the model. The other metrics investigated
are the file’s age, whether or not the file is new during the prior release, number of changes
made to the file, and the number of faults in the previous release of the software. The model
with the additional metrics identified 83% of the faults over the seventeen releases.
Crawford et al. [18] found that size was also the best predictor of all of their complexity
metrics for predicting the number of faults in a software system implemented in the C
programming language.
3.2
Failure-prone components
Some latent faults require several years to surface and thus information about which
components require more testing are revealed after software release [73]. Some research has
shown that post-release data can afford software engineers to predict failures. Nagappan et
al. [73] have shown that complexity metrics including coupling, McCabe’s cyclomatic
field can successfully predict faults that have surfaced in the field. However, the same
combination of metrics they used would not accurately predict failures for all software
projects. Binkley et al. [7] studied the number of failures that occurred for four software
systems. For each system they correlated the count of failures to a coupling design metric.
The coupling metric measures the following three coupling dimensions between modules:
referential dependency, structural dependency, and data integrity dependency. They
compared the coupling metric to other complexity metrics including cyclomatic complexity,
lines of code, count of modules that use a resource, and fan-in, and fan-out. They found that
for each system under analysis, the coupling metric had the strongest correlation to the count
of failures.
Another metric used to predict failure-prone components is the count of faults identified
before the release of the software. Biyani et al. [9] studied the correlation between the
number of faults found after release in four releases of an application for high end systems.
Their data indicate that modules that were associated with many faults before release are also
likely to contain more failures in the field.
3.3
Predicting Fault- and Failure-prone Components with SCSA
Naggappan et al. [97] and Zheng et al. [70] have demonstrated that SCSA warnings can
predict fault-prone components. Their work is based on the idea that one technique (e.g.,
SCSA) alone is insufficient for finding all faults in software [96], but that coding problems
reside in the same component as failures identified by testing. Nagappan et al. [97] used the
PREfix and PREfast SCSA on Windows Server 2003 code. The dataset consisted of 22
which came from testing teams, integration teams, build results, external teams, and third
party testers. Customer-reported failures were not included in the analysis. Their results
showed they were able to correctly classify 82.91 percent of the components as either fault or
non-fault-prone based upon ASA alerts. Type I and Type II errors were not released in the
study.
Zheng et al. [97] analyzed three large scale Nortel Network software products. Together
the products consisted of more than three million lines of code. They compared warning
density to results from over 200 inspectors and testers and from customer-reported failures.
The primary SCSA used in their study was FlexeLint7.
Zheng et al. [97] analyzed their work in the context of the Orthogonal Defect
Classification [97]. Faults can be categorized based on when they are introduced in the SLC.
IBM’s Orthogonal Defect Classification (ODC) [97] has eight different types of faults. They
are: Algorithm, Documentation, Checking, Assignment, Function, Interface,
Build/Package/Merge, and Timing/Serialization. Zheng et al. correctly classify 83.3 percent
of the components as either fault-prone or non-fault-prone. They furthered their study to for
their model to include SCSA warnings and the number of test failures to correctly identify
87.5 percent of the components. Thirty-three percent of the fault-prone components were
incorrectly classified as non-fault-prone components. Additionally, they used ASA alerts
and normalized test failure density to correctly classify 91.7% of the modules, but there were
22 percent false negatives among the fault-prone components. Zheng et al. [97] conclude
that SCSA are good for predicting Assignment and Checking errors, but for their data the
other six ODC types were not identified by SCSA. Their data indicated that SCSA warnings
are good indicators of fault-prone components in the general case (beyond simply
Assignment and Checking errors).
3.4
Vulnerability Prediction Models
Neuhaus et al. [74] have investigated statistical models that predict vulnerable
components. They created a software tool, Vulture, that mines a bug database for data
including libraries and APIs to identify vulnerable components. They performed an analysis
with Vulture on Bugzilla, the bug database for the Mozilla browser, using imports and
function calls as predictors. In their research, they predict the presence of a vulnerability
based on the specific domain of the component. In their setting, the most vulnerable domain
was domain in which Mozilla performed or was capable of scripting-related operations.
They identified 45% of the vulnerable components in Mozilla with a 30% false positive rate.
Ozment and Schechter [78] investigate if most of the vulnerabilities in OpenBSD reside
in legacy code or in the new code. Approximately 62% of the vulnerabilities are in the
legacy code of OpenBSD. Ozment and Schechter [78] also consider code churn as a
predictor of which files are most likely to be vulnerable. Their results indicate that there is
no significant correlation between code churn and vulnerability count. Their correlations are
performed at the version level of OpenBSD, while our studies and those of Neuhaus et al.
[74] are performed at the component-level. The version-level of a software system may too
high-level to make statistical correlations; analyses at the component-level may offer more
3.5
The Effect of Complexity on SCSA
Walden et al. [92] analyzed the effect of code complexity on the Fortify Software’s
SCSA, Source Code Analyzer (SCA) 4.5.0, to detect format string vulnerabilities. The
complexity metrics they analyzed are the count of source lines of code (SLOC) and
McCabe’s cyclomatic complexity [55]. SCA identified 22 of 35 (63%) format string
vulnerabilities in the open source Linux software systems tested. They noted that the
detection of format string vulnerabilities decreases as the complexity of the source code
increases, but found that complexity was not the cause of the vulnerabilities not detected by
SCA.
Walden et al. identified two causes for the 37% false negative rate. First, four of the
thirteen (31%) format string vulnerabilities that were not detected were not implemented in
SCA’s rule set. However, Walden et al. claim that developers could implement their own
rule and add it to SCA’s rule set to identify the format string vulnerabilities. Nine of the
thirteen (69%) of the format string vulnerabilities were not detected by SCA because of a
fault that existed in the SCA. The fault was reported to Fortify Software.
If developers can implement good rules for format string vulnerabilities and they use the
fixed version of SCA, then the format string vulnerabilities may not have escaped into the
field. The limitation of this work is that the vulnerabilities studied are only format string
vulnerabilities and not to all vulnerabilities in the SCA rule set. One of the metrics in our
research is coupling. Coupling is used to predict if vulnerabilities not identified by SCSA are
correlated to field failures and although SCSA may detect the coding vulnerabilities their
4.
Vulnerability- and Attack-prone Components
While Krsul [53] defined vulnerability in accordance to the fault tolerance discipline, we
define attack for this dissertation. We define attack as a subset of failures in the same way
Krsul [53] defined vulnerability as a subset of faults. The term attack is therefore represents
a security failure. Likewise a vulnerability can be referred to as a security fault.
Additionally, we define the terms vulnerability- and attack-prone components in this
dissertation as first proposed in [30]. The definitions are now stated:
Attack - The inability of a system or component to perform functions without violating an
implicit or explicit security policy [36]. We borrow from the ISO/IEC 24765 [49] definition
of failure to define attack, but remove the word “required” because attacks can result from
functionality that was not stated in the specification.
Attack-prone component - A component that will likely be exploited [30].
Vulnerability-prone component - A component that is likely to contain one or more
vulnerabilities that may or may not be exploitable [30].
Fault-prone prediction models can estimate which components are fault-prone, but if the
faulty code is never executed it will not be prone to failure. The inspection of all fault-prone
components may cause the development team to expend valuable and limited verification
resources on low risk areas of the code that may be of high quality and/or may rarely or never
be used by a customer. Failure-prone prediction models, based on a customer’s operational
profile, and historical failures from the field, can further guide fault-finding efforts toward
Security can be viewed as a subset of reliability [90] and thus the reliability-type models
may be applicable in the security context. One contribution of this dissertation is definitions
of vulnerability- and attack-prone components. A vulnerability-prone component is
analogous to a fault-prone component in that vulnerabilities may remain latent (similar to
faults) until encountered by an attacker (or tester/customer) in an executing system. The
vulnerabilities in a vulnerability-prone component can include a wide range of severity and
likelihood of exploitation. An example of a vulnerability-prone component is a component
that contains many vulnerabilities identified by static inspections. The static inspections
include peer reviews and analyses from source code and binary analyzers that analyze the
software without executing the software. While these vulnerabilities can have any severity
and likelihood of being exploited, we reserve the term attack-prone component for when a
vulnerability is actually exploited during execution. Execution occurs during testing and
when the software is running in the field.
A similar relationship between vulnerability-prone and attack-prone components exists as
with fault- and failure-prone components. An attack-prone component is a
vulnerability-prone component if an attacker will likely exploit one or more vulnerabilities in that
component. Vulnerability-finding techniques can cause security experts to expend valuable
and limited security resources on low risk areas of the code that may be adequately fortified,
may be uninteresting to an attacker, or contain difficult-to-exploit vulnerabilities.
Attack-prone prediction models based on test failure data and attacks in the field can make
vulnerability-finding efforts more efficient and effective by identifying those components
during runtime, we say they have attacked the system. Although the tester may not have
exploited the buffer overflow to cause a denial-of-service or to inject code that escalates their
privileges, the failure is a proof of concept that the system can be attacked. While failures in
the reliability realm are dependent on the operational profile, attacks can occur anywhere in a
5.
The Coupling Effect
5.1
Background
The coupling effect states that “test data that distinguishes all programs differing from a
correct one by only simple errors is so sensitive that it also implicitly distinguishes more
complex errors.” [19]. Evidence of the coupling effect was first shown in the context of
mutation testing where simple test sets could identify both simple and complex faults [19].
The coupling effect indicates that when a software engineer identifies a simple fault, then
they should also perform a systematic search for a more complex fault or failure [19].
Therefore, DeMillo et al. [19] conclude that simple errors compound in more massive error
conditions [19].
Offutt [75] observed a derivative of the coupling effect called the mutation coupling
effect with a mutation testing experiment on three programs: MID, TRITYP, and FIND. In
mutation testing, a simple fault can be created by a mutant operator changing a normal
program. A complex fault is mutant program with two or more mutations. A mutant with
two mutations is a 2-order mutant. The experimental hypothesis was that a test-data set that
is mutant-adequate for all 1-order mutants is also mutant-adequate for 2-rorder mutants.
Offutt found that the test data developed to kill 1-order mutants was also successful at killing
2-order mutants. For the MID program, 19,110 2-order mutants were created; 18,961 of
them were killed. Of the remaining mutants, 145 of them were equivalent to the original
program and four were alive. The 2-order mutants that remained alive were not dissimilar to
test data developed for 1-order mutant actually killed a higher percentage of mutants when
applied to 2-order mutants.
Offutt [76] contributed the idea of the mutation coupling effect to provide evidence of the
coupling effect in the context of mutation testing as opposed to stating that the coupling
effect applies to all faults, all programs, and all test data sets. The mutation coupling effect
states that complex mutants are coupled to simple mutants in such a way that a test data set
that detects all simple mutants will detect a large percentage of complex mutants [76]. Offutt
[76] defines a simple mutant as a program that expresses only one mutation and a complex
mutant is a mutant program that consists of multiple mutations. The use of “detect” in the
mutation coupling effect definition indicates that a test case that “kills” a simple mutant will
also cause the complex fault to be realized. Offutt describes the coupling of simple and
complex faults as being in the same path of execution in the following idea:
Of course, the fact that two mutants are executed on the same path does not necessarily mean that they interact in any meaningful way, but such interactions are difficult to determine analytically [76].
The relationship between the simple and complex faults does not include the proximity of
the faults in terms of their physical location in a software component. In our research, we
investigate the component dimension between simple and more complex faults as described
5.2
The Static-dynamic Coupling Effect
Young and Taylor [96] state the idea that “no single technique is capable of addressing
all fault-detection concerns.” More recently this idea has been applied to the security realm.
According to McGraw [56] “No individual touchpoint or tool can solve all of your software
security problems. [56]”. A touchpoint, in this context, is a software security best practice
applied to a software artifact [56]. McGraw [56] also adds that “static analysis tools can find
bugs in the nitty-gritty details, but they can’t even begin to critique design”. McGraw
exemplifies his claim in a scenario where a software engineer is developing a funds transfer
application. Although the SCSAs can find some faults in the software, he claims the tool
cannot abstract the design of the system based on the code to warn the user to strengthen user
password requirements [56]. While SCSA can measure coupling between components which
represent the low-level design, they currently do not interpret high-level design issues.
Furthermore, Chess and West state that “for a static analysis tool to catch a defect, the defect
must be visible in the code. This might seem like an obvious point, but it is important to
understand that architectural risk analysis is a necessary complement to static analysis.”
Although SCSA analysis are useful, software engineers cannot exclusively rely on their
ability to identify all types of software vulnerabilities.
Static analysis is the process of evaluating a system or component based on its form,
structure, content, or documentation [47] Static analyses include binary code analyses and
peer review code inspections. As mentioned, we investigate if SCSA faults and more
complex vulnerabilities identified during execution are in the same component and so we
Our research investigates if there is an association, in the context of components, between
the count of SCSA warnings, a static (internal) metric, and the count of failures identified
during execution, a dynamic (external) metric. This research leads us to the following
hypothesis:
Hypothesis: Above a statistically determined threshold, SCSA vulnerability warnings are
in the same components as vulnerabilities that are likely to be exploited. We call this the
static-dynamic coupling effect.
We avoid calling the association between faults identified during static and dynamic
analyses as simply the coupling effect because the coupling effect is defined in the context of
program execution. However, DeMillo et al. [19] clarify their definition of the coupling
effect in the idea that “In other words, complex errors are coupled to simple errors. [19]”
The coupling effect does not indicate that simple and complex faults are located in the
same component. As mentioned, the simple and complex problems are identified on the
same path of execution during mutation testing which does not necessarily require that the
component in which they reside is a factor incorporated into the idea of coupling. However,
if we assume that the location of faults is a factor in the coupling effect, then the
static-dynamic coupling effect provides some support for the more general coupling effect. In this
dissertation we investigate evidence of the SCSA fault-dynamic coupling effect which
provides evidence of the more general static-dynamic coupling effect where faults found by
manual or binary static analyses are in the same component as failures identified by testing.
The hypothesis is more of a statistical indication than an absolute truth. However, if the
system by systematically looking for other types of faults that are not identifiable by SCSA
in the same component as the SCSA-identified faults. In this dissertation we do not
distinguish between simple and complex faults as done in research efforts for the coupling
effect (e.g. [19, 75, 76]). Instead, we distinguish faults by the method in which the faults are
6.
The Goal, Question, Metric Approach
When you can measure what you are speaking about, and express it in numbers, you know something about it; but when you cannot measure it, when you cannot express it in numbers, your knowledge is of a meager and unsatisfactory kind: it may be the beginning of knowledge, but you have scarcely, in your thoughts, advanced to the stage of science.
― Lord Kelvin
Measurement can indicate progress toward a goal, provide a means to substantiate
corrective action based on an assessment, and evaluate the impacts of actions [4]. Purposeful
measurements require that a goal set out by a software organization be traced to the
organization’s data and then be interpretable by the stakeholders of that organization [4].
The goal of the software organization should be clear as to determine what information is
needed to achieve the goal. The information should be quantifiable and when analyzed
should indicate if the goal has been achieved. The Goal Question Metric (GQM) approach
[4] defines a top-down framework for defining a goal, stating questions about the goal, and
then declaring what metrics are used for measuring the goal. The result of the application of
the GQM approach is a specification that outlines how measurement should be performed
and how to interpret the measurements in such a way that the measurements can be traced
back to the goal.
The goal is proposed at a conceptual level of a software organization. Goals can be made
the object that will be measured, a viewpoint, and an issue that is of interest (e.g., a security
issue). An example is “Improve the timeliness of vulnerability identification from the
security team’s viewpoint.” In this example, the purpose is to improve, the issue is the
timeliness, the object to be measured is vulnerability identification, and the viewpoint is from
the security team.
The goal is refined by multiple questions that are defined at the operational level of a
software organization. The questions should characterize how the achievement of the goal
will be performed. Questions should also characterize the object set forth by the goal to
indicate a potential problematic issue with the object. From the example of the goal
previously stated, a question could be “How many vulnerabilities are identified before
release?” Multiple questions can be associated with a single goal. Lastly, the answers the
questions indicate if the goal has been achieved.
The questions are answered with metrics. Metrics are associated with a data set that
allow for a quantitative answer to the question. Basili et al. [4] do not indicate that a
qualitative analysis is possible, but we do not limit the usage of GQM to quantitative
analyses. Multiple metrics can be associated one question. Also, one metric can be used to
answer multiple questions. A possible metric in our example is the count of vulnerabilities
identified before and after the release of the software. Another metric could be the count of
high risk vulnerabilities that are identified in the field.
Basili et al. [6] have since refined the GQM approach to include the concept of a model
and a Response. The model is used to interpret the values of the measurements performed
attacked if there are more than five vulnerabilities in it, then the component should receive
more security attention. If there are less than five vulnerabilities, then security efforts should
not be prioritized to those components. In this case five was arbitrarily chosen, but could be
calculated by risk management decisions.
The Response is a suggestion on what action should be carried out by software engineers
based on the result of the model. For example, the response could include an initial analysis
of why vulnerabilities are injected into the software. A check to determine if software
engineers are following corporate security requirements and policies could be initiated by
management if components are many vulnerabilities. An investigation of how much cost
will be associated with the corrective actions could be applied in the response.
The GQM approach prevents software engineers from a bottom-up approach where the
metrics drive the goals. A bottom-up approach may be cumbersome in that there are many
metrics to observe and knowing which metrics are the most important is challenging without
first having a conceptual goal that provides a linkage between the metrics and the goal. We
refer to the Goal, Question, Metric, Model, Response framework as GQM-MR in this
7.
Research Goals, Questions, Metrics, Models, and Responses
The research approach for this dissertation is now discussed in accordance to the
GQM-MR-C framework. By referring to post-development in this dissertation, we refer to all
phases in the SLC that occur after the coding phase. These phases are referred to as
“Development test”, “Acceptance test”, and “Operation” according to Boehm [11]. These
phases include penetration, system, and function testing practices. Also included in
post-development are failures that occur in the field reported by customers and third-party
researchers. All metrics discussed in our research are on a per component basis. The metrics
are numbered for each question. A metric that is used for multiple questions has the same
number.
The phase in the SLC at which software engineers assess the security risks is a critical
factor for improving the security assurance of a software system. The cost to find and fix
vulnerabilities grows with time during the SLC [11]. If a software organization finds and
fixes all vulnerabilities late in the SLC, they may not be able to afford the high costs to fix a
vulnerability. Further, finding a requirements or design vulnerability post-development may
require that substantial and difficult modifications be required to fix the vulnerability. If the
vulnerability necessitates a large modification of the system, then software engineers may not
find an effective security solution or the solution may require so many changes that all
changes are not secured. In such a scenario, a software organization may elect to release the
vulnerable software and address the vulnerabilities before the next release of that software