LIFE Project Number
LIFE12 ENV/FIN/000409
First Data Document
Action B.3 – Summary report of LAI data
Reporting Date
25/09/2014
LIFE+ PROJECT NAME or Acronym
Climate change indicators and vulnerability of boreal zone
applying innovative observation and modelling techniques
Data Project
Project location
Helsinki
Project start date:02/09/2013
Project end date:01/09/2017
Total budget:2755288 €
EC contribution:1366952 €
(%) of eligible costs49.61
Data Beneficiary
Name BeneficiaryIlmatieteen laitos
Contact personDr. Terhikki Manninen
Postal addressErik Palménin aukio 1, FI-00101, Helsinki, Finland
Telephone+358-29 539 4159
Fax: E-mail[email protected]
Project Websitemonimet.fmi.fi
List of abbreviations
FMI-ARC
Arctic Research Station of Finnish Meteorological Institute in
Sodankylä
LAI
Leaf
Area
Index
NorSEN Nordkalotten
Satellite Evaluation co-operation Network
SAF
Satellite Application Facility, project type of EUMETSAT
SNORTEX
Snow Reflectance Transition Experiment
Summary
This report describes the leaf area index (LAI) data sets gathered in the region around the
surroundings of the Arcitc Research Centre of FMI at Sodankylä in 2007 - 2010.
The ground based results are listed in tables of the Appendix. Every LAI value is provided the
latitude and longitude co-ordinates. The dates and UTC times of the measurements are given
as well. Some of the measurements include information about the dominant species.
The airborne data constitutes a vast data set, so that it is not possible to include the individual
LAI values in this report. Therefore a table and a set of figures are presented to give the basic
characteristics of the airborne LAI data sets.
Introduction
The leaf area index (LAI) data sets reported in this document were measured in Sodankylä
region during the NorSEN (Nordkalotten Satellite Evaluation co-operation Network)
campaign in 2007 and during the SNORTEX (Snow Reflectance Transition Experiment)
campaign in 2008-2010 (Manninen and Roujean, 2014). During the SNORTEX campaign the
ground based LAI values were measured both in summer and winter conditions, during the
NorSEN campaign only in summer conditions. Airborne measurements were carried out in
winter/spring conditions during the SNORTEX campaign 2008 – 2010. Use of the data
described in this document is free on the condition that reference is made to the following
publications:
Manninen, Terhikki, Lauri Korhonen, Pekka Voipio, Panu Lahtinen and Pauline Stenberg, 2009,” Leaf Area Index (LAI) Estimation of Boreal Forest Using Wide Optics Airborne Winter Photos”, Remote Sensing, 2009, 1(4), 1380-1394.
Manninen, Terhikki, Lauri Korhonen, Pekka Voipio, Panu Lahtinen and Pauline Stenberg, 2011, “Airborne estimation of boreal forest LAI in winter conditions: A test using summer and winter ground truth”, IEEE Transactions on Geoscience and Remote Sensing, Vol. 50, No.1, pp- 68-74, 10.1109/TGRS.2011.2173939.
Manninen, T., and J.-L. Roujean (Eds.) (2014), SNORTEX field campaigns 2008–2010, Finnish Meteorological Institute Reports 2014(7), in press.
1
Description of LAI measurements
1.1
Ground based measurements
During the NorSEN field campaign in July- September 2007 LAI measurements were carried
out using LAI2000 instrument or hemispherical photos. The images were analysed in
University of Eastern Finland by Lauri Korhonen. During the SNORTEX campaign LAI
measurements were based solely on hemispherical photos. In 2008 a larger set of LAI data
was gathered in August - September and in winter during the campaign 8 test sites matching
airborne vertical profiling sites were measured. In 2009 hemispherical photos were taken in
individual locations, mostly at the meteorological mast of FMI-ARC. In 2010 hemispherical
photos were taken in 40 points and marked with black crosses, so that the airborne and ground
based LAI measurements could be co-located with high accuracy. Results are described in
Manninen et al. 2009 and Manninen et al. 2011.
1.2
Airborne measurements
A normal Canon pocket camera with wide optics was attached to the helicopter looking
orthogonally downwards (Manninen et al., 2009; Manninen et al., 2011, Manninen and
Roujean 2014). The images were taken every 3 seconds and the GPS coordinates (latitude,
longitude and height from sea level) and time were registered for each image frame. In 2009
and 2010 there was an additional pressure gauge for altitude registration, as the vertical
coordinate of GPS is not so accurate. The images were stored directly to a laptop used for
operating the camera. The camera was on during most flights, but specific vertical LAI
profiles were measured in March 13, 2009 and in March 19, 2010. The main facts concerning
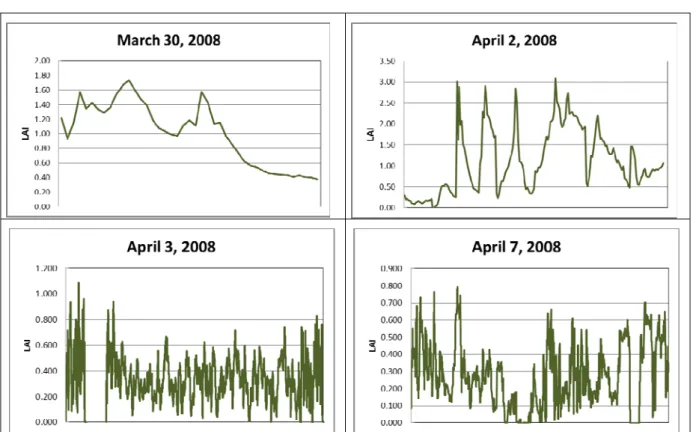
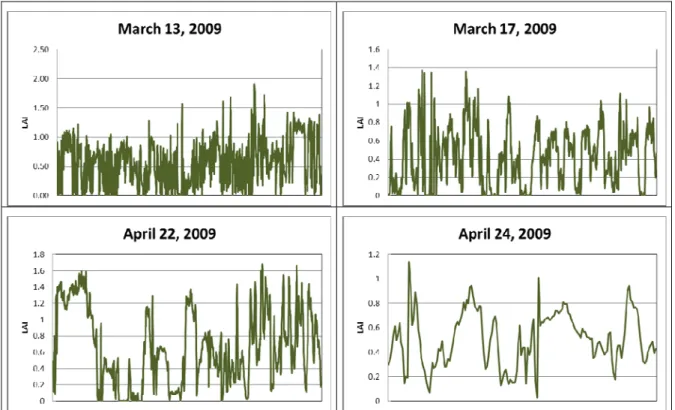
the airborne LAI data are listed in Table 1. The number of individual LAI values is so large,
that it is not possible to list them in the Appendix like the ground based measurements. To
give and idea about the LAI variation its value is plotted for each flight as a continuous curve
(
Figure 1,
Figure 3,
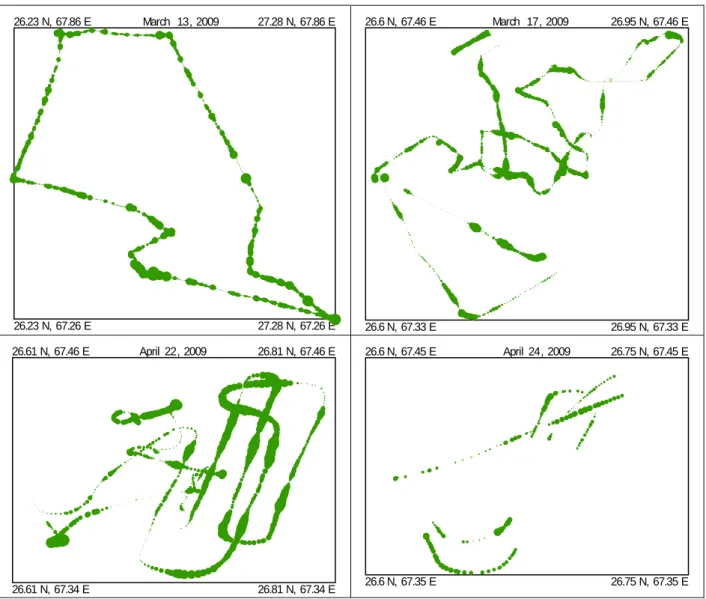
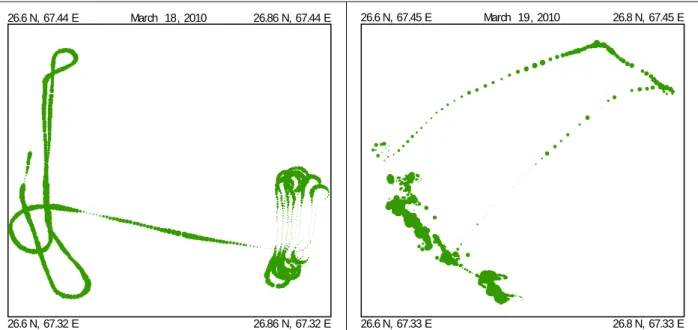
Figure5). In addition, the spatial LAI variation is demonstrated by plotting
the LAI values as points in the co-ordinates so, that the size of the point is related to the LAI
value (
Figure 2,
Figure 4,
Figure 6).
Table 1. The airborne LAI data gathered is stored in the following files.
File name Date Latitude range Longitude range Altitude range (m) Number of points SNORTEX_20080330_20080402 March 30, 2008 April 2, 2008 67.27 – 67.93 24.91 – 26.72 160 - 400 43 + 203 SNORTEX_20080403_20080407 April 3, 2008 April 7, 2008 67.36 – 67.93 26.58 27.11 130 - 1200 5058 + 3088 SNORTEX_20090313 March 13, 2009 67.26 – 67.86 26.23 – 27.28 200 - 500 2471 SNORTEX_20090317 March 17, 2009 67.33 – 67.46 26.61 – 26.94 180 - 540 1222 SNORTEX_20090422 April 22, 2009 67.34 – 67.45 26.62 – 26.80 260 - 1100 1306 SNORTEX_20090424 April 24, 2009 67.35 – 67.44 26.61 – 26.72 190 - 1090 469 SNORTEX_10200318 March 18, 2010 67.33 – 67.43 26.60 – 26.86 280 - 820 884 SNORTEX_10200319 March 19, 2010 67.34 – 67.44 26.61 – 26.79 140 - 810 1084
Figure 1. LAI value variation in various flights during the SNORTEX campaign in 2008. The horizontal axes are not to scale.
March 18, 2010 24.91 N, 67.924 E 24.913 N, 67.924 E 24.913 N, 67.929 E 24.91 N, 67.9329 April 2, 2010 26.62 N, 67.27 E 26.73 N, 67.27 E 26.73 N, 67.385 E 26.62 N, 67.385 April 3, 2010 26.5 N, 67.38 E 27.1 N, 67.38 E 27.1 N, 67.93 E 26.5 N, 67.93 April 7, 2010 26.6 N, 67.38 E 27.11 N, 67.35 E 27.11 N, 67.81 E 26.6 N, 67.81
Figure 2. LAI value variation along the flight routes during the SNORTEX campaign in 2008. The coordinates of the corners are given. The diameters of the points are related to the LAI values, but the scale varies from image to image.
Figure 3. LAI value variation in various flights during the SNORTEX campaign in 2009. The horizontal axes are not to scale.
March 13, 2009 26.23 N, 67.26 E 27.28 N, 67.26 E 27.28 N, 67.86 E 26.23 N, 67.86 E March 17, 2009 26.6 N, 67.33 E 26.95 N, 67.33 E 26.95 N, 67.46 E 26.6 N, 67.46 E April 22, 2009 26.61 N, 67.34 E 26.81 N, 67.34 E 26.81 N, 67.46 E 26.61 N, 67.46 E April 24, 2009 26.6 N, 67.35 E 26.75 N, 67.35 E 26.75 N, 67.45 E 26.6 N, 67.45 E
Figure 4. LAI value variation along the flight routes during the SNORTEX campaign in 2009. The coordinates of the corners are given. The diameters of the points are related to the LAI values, but the scale varies from image to image.
F
Fiigguurree55..LLAAIIvvaalluueevvaarriiaattiioonniinnvvaarriioouussfflliigghhttssdduurriinnggtthheeSSNNOORRTTEEXXccaammppaaiiggnniinn22001100..TThheehhoorriizzoonnttaallaaxxeessaarree n
March 18, 2010 26.6 N, 67.32 E 26.86 N, 67.32 E 26.86 N, 67.44 E 26.6 N, 67.44 E March 19, 2010 26.6 N, 67.33 E 26.8 N, 67.33 E 26.8 N, 67.45 E 26.6 N, 67.45 E
Figure 6. LAI value variation along the flight routes during the SNORTEX campaign in 2010. The coordinates of the corners are given. The diameters of the points are related to the LAI values.
2
References
Manninen, Terhikki, Lauri Korhonen, Pekka Voipio, Panu Lahtinen and Pauline Stenberg,
2009,” Leaf Area Index (LAI) Estimation of Boreal Forest Using Wide Optics Airborne
Winter Photos”, Remote Sensing, 2009,
1
(4), 1380-1394.
Manninen, Terhikki, Lauri Korhonen, Pekka Voipio, Panu Lahtinen and Pauline Stenberg,
2011, “Airborne estimation of boreal forest LAI in winter conditions: A test using summer
and winter ground truth”, IEEE Transactions on Geoscience and Remote Sensing, Vol. 50,
No.1, pp- 68-74, 10.1109/TGRS.2011.2173939.
Manninen, Terhikki, Lauri Korhonen, Aku Riihelä, Panu Lahtinen, Pauline Stenberg,
Jean-Louis Roujean and Olivier Hautecoeur, 2012, Boreal forest albedo and LAI in SNORTEX
2008-2010, Proc. of IGARSS’12, 978-1-4673-1159-5/12, pp. 3335 – 3338.
Manninen, T., and J.-L. Roujean (Eds.) (2014), SNORTEX field campaigns 2008–2010,
Finnish Meteorological Institute Reports 2014(7), in press.
Appendix: Ground based LAI measurements in Sodankylä region
July 23 – September 13, 2007
Plot Date LAI_method Dominant species kkjN kkjE LAI
153 23.7. LAI-2000 Scots pine 7476079.459 3483992.1 0.21 154 23.7. LAI-2000 Scots pine 7475876.253 3484225.8 1.13 155 23.7. LAI-2000 Scots pine 7475788.451 3484254.3 1.78 156 23.7. LAI-2000 Scots pine 7475623.511 3484269.9 1.62 157 23.7. LAI-2000 Scots pine 7475466.596 3484385.6 0.95 158 23.7. LAI-2000 Scots pine 7475508.0 3484441.9 1.49 159 23.7. LAI-2000 Scots pine 7476207.496 3484028.7 1.26 160 31.7. LAI-2000 Scots pine 7476675.588 3484397.6 1.08 161 31.7. Hemi-images Scots pine 7476685.851 3484463.2 0.00 162 23.7. LAI-2000 Scots pine 7475632.0 3484039.1 1.13 163 31.7. LAI-2000 Scots pine 7476813.0 3484356.2 1.24 164 31.7. LAI-2000 Scots pine 7477135.737 3484266.2 1.00 165 31.7. Hemi-images Scots pine 7477209.459 3484165.2 0.05 166 31.7. LAI-2000 Scots pine 7477710.86 3484397.0 0.37 167 31.7. LAI-2000 Scots pine 7477719.637 3484324.6 1.31 168 31.7. LAI-2000 Scots pine 7477225.059 3484276.2 0.30 169 23.7. LAI-2000 Scots pine 7476254.32 3483915.8 1.13 170 31.7. LAI-2000 Scots pine 7477886.215 3483419.8 0.35 171 23.7. LAI-2000 Scots pine 7475002.693 3484588.3 1.43 172 23.7. LAI-2000 Scots pine 7475064.921 3484544.7 0.37 173 9.9. Hemi-images Scots pine 7473810.794 3485406.4 0.74 174 9.9. Hemi-images Scots pine 7473958.423 3485537.4 0.32 175 9.9. Hemi-images Scots pine 7474491.716 3484740.5 1.12 176 4.8. LAI-2000 Scots pine 7474845.0 3484443.6 0.78 177 4.8. LAI-2000 Scots pine 7474873.9 3484463.6 1.43 178 6.9. Hemi-images Scots pine 7467720.941 3488732.0 1.63 179 6.9. Hemi-images Scots pine 7467394.787 3488720.1 1.91 180 6.9. Hemi-images Scots pine 7466340.286 3489167.7 0.00 181 6.8. Hemi-images Scots pine 7468157.355 3488082.7 0.79 182 3.9. Hemi-images Scots pine 7486493.119 3473350.7 0.37 183 3.9. Hemi-images Scots pine 7486878.231 3472335.3 0.91 184 3.9. Hemi-images Norway spruce 7487403.817 3463928.2 1.81 185 3.9. Hemi-images Scots pine 7487369.771 3463888.3 1.25 186 11.9. Hemi-images Scots pine 7465101.299 3488159.3 0.84 187 11.9. Hemi-images Norway spruce 7455434.911 3492000.3 0.94 188 11.9. Hemi-images Norway spruce 7456791.027 3489776.6 1.78 189 7.9. Hemi-images Scots pine 7474877.61 3484498.1 1.32 190 9.8. Hemi-images Deciduous 7475435.633 3484874.9 0.00
192 9.8. Hemi-images Scots pine 7476563.34 3484290.0 0.05 193 5.9. Hemi-images Norway spruce 7476499.152 3483897.4 2.53 194 5.9. Hemi-images Deciduous 7476640.8 3484130.8 0.84 195 5.9. Hemi-images Scots pine 7476576.3 3484113.5 1.82 196 5.9. Hemi-images Deciduous 7476385.115 3483863.8 2.47 197 3.9. Hemi-images Deciduous 7475242.06 3484894.4 1.99 198 5.9. Hemi-images Norway spruce 7476420.335 3484001.2 2.78 199 5.9. Hemi-images Scots pine 7476629.624 3484100.7 0.91 200 3.9. Hemi-images Norway spruce 7475980.765 3484689.9 1.90 201 3.9. Hemi-images Norway spruce 7474020.055 3485291.6 2.36 202 3.9. Hemi-images Scots pine 7474022.172 3485235.8 1.70 203 3.9. Hemi-images Norway spruce 7473065.21 3486374.0 1.82 204 3.9. Hemi-images Norway spruce 7473865.999 3486658.1 2.36 205 3.9. Hemi-images Norway spruce 7474303.323 3486640.1 2.43 206 3.9. Hemi-images Norway spruce 7474404.354 3486629.8 2.74 207 3.9. Hemi-images Norway spruce 7474628.365 3486595.2 2.23 208 3.9. Hemi-images Deciduous 7474698.001 3486633.3 1.39 209 4.9. Hemi-images Norway spruce 7463120.106 3491362.4 1.43 210 4.9. Hemi-images Norway spruce 7463278.767 3491426.4 1.42 211 3.9. Hemi-images Scots pine 7473146.657 3486260.4 1.85 212 6.9. Hemi-images Norway spruce 7461452.943 3500145.3 1.33 213 6.9. Hemi-images Norway spruce 7463239.488 3500031.6 0.46 214 9.9. Hemi-images Scots pine 7473644.944 3485648.3 0.67 215 10.9. Hemi-images Norway spruce 7463516.418 3501850.4 0.72 216 10.9. Hemi-images Norway spruce 7462096.994 3500380.6 0.65 217 11.9. Hemi-images Norway spruce 7449838.753 3498182.8 2.12 218 12.9. Hemi-images Scots pine 7474907.762 3484322.8 1.17 219 12.9. Hemi-images Scots pine 7476357.397 3483958.5 1.76 220 13.9. Hemi-images Norway spruce 7462556.085 3492631.4 2.41
August 26–September 5, 2008
LAI2000
Point Place and description Dominant species Latitude Longitude LAI
AA01 Ruonivaaran tyvi Scots pine 67.35353953 27.00292733 1.47 AA02 Rahkavaaran tyvi Scots pine/Birch 67.328228 27.13242344 1.20 AA03 Tulkkila Scots pine 67.2589861 27.2794767 2.11 AD01 Sattanen Scots pine 67.49003005 26.60910345 1.25 AD03A Peurapalontie Scots pine 67.84530167 26.733335 0.70 AD03B Peurapalontie Scots pine 67.84505407 26.73482113 0.90 MA04 Kommattivaaran tyvi Scots pine 67.4410036 26.74537525 0.96 MC03 Kiimalaen tyvi Scots pine 67.54652319 26.22889713 0.89 MD08 Pahtavaarankuusikon laita Norway spruce 67.85525218 26.48333476 1.10 MD09 Makkaratievat Norway spruce 67.85197318 26.38458436 1.12 MD15 Kaita-aavankuusikko Norway spruce 67.84992275 26.5351725 1.37 MD16 Tenniövaara Scots pine 67.84642656 26.41205078 1.05 MF10 Sammakkoaapa Birch 67.48855671 27.03580314 0.08 P12 Tähtelä Scots pine 67.37685768 26.62636468 1.72 P13A Kursala Norway spruce 67.34567413 26.67895688 1.37 P13B Kursala Scots pine 67.346189 26.67952008 0.82 P24 Tähtelä pikatie Scots pine 67.37767417 26.63285367 1.02 P33 Tähtelä Scots pine 67.35117429 26.66154229 0.70 P36 Tähtelä Scots pine 67.37237117 26.62383239 0.40 P6A Tähtelä Norway spruce 67.35390008 26.653467 1.91 P6B Tähtelä Scots pine 67.35420767 26.65217533 1.87 P8 Tähtelä Birch 67.3651414 26.6443878 1.95 UP1A Kaikkonen Scots pine 67.35386 26.684673 1.45 UP1B Kaikkonen Norway spruce 67.35313589 26.68580011 2.06
April 6 – 13, 2008
Point Place Date Time Latitude Longitude LAI
P12 Tähtelä pohjoinen, plot 195 6.4.2008 67:22.6176 26:37.563 0.88 P12 Tähtelä pohjoinen, plot 195 6.4.2008 67:22.6176 26:37.563 1.02 P24 Tähtelä pohjoinen, pikatie, plot 160 6.4.2008 67:22.6722 26:37.959 1.01 P8 Halssiaavan reuna, plot 197 6.4.2008 67:21.9024 26:38.6646 0.67 P8 Halssiaavan reuna, plot 197 6.4.2008 67:21.9024 26:38.6646 0.65 Plot176 NorSEN-masto 6.4.2008 67:21.6876 26:38.0382 0.54 P29 Käyräsjokisuumaa, plot 186 13.4.2008 11:34 67:16.456 26:43.287 0.48 P13 Kursala, plot 203 13.4.2008 12:51 67:20.736 26:40.747 0.74 P33 Halssinkankaannokka, plot 214 13.4.2008 13:41 67:21.046 26:39.729 0.17 P6 Halssikangas, plot 201 13.4.2008 14:27 67:21.246 26:39.229 0.93
March 19 – May 7, 2009
Place Date Time Latitude Longitude LAI
Forest at the meteorological mast, left side 19.3.2009 n. 11 6721.71 2638.21 1.21 Clearing at the meteorological mast 19.3.2009 n. 11 6721.71 2638.21 0.41 Forest at the meteorological mast, left side 19.3.2009 10:19 6721.71 2638.21 1.05 Forest at the meteorological mast, left side 19.3.2009 10:42 6721.71 2638.21 1.15 Forest at the meteorological mast, left side 19.3.2009 11:05 6721.71 2638.21 1.19 Melalampi, road to the snowpit points 21.4.2009 11:28 6723.67 2643.851 0.43 Melalampi, road to the snowpit points 21.4.2009 11:28 6723.66 2643.85 0.83 Melalampi, road to the snowpit points 21.4.2009 11:28 6723.65 2643.84 1.04 Melalampi, road to the snowpit points 21.4.2009 11:28 6723.62 2643.82 0.69 Melalampi, road to the snowpit points 21.4.2009 11:28 6723.6 2643.82 0.81 Melalampi, clearing at spectrometer measurements 21.4.2009 11:32 6723.56 2643.66 0.02 Melalampi, clearing at spectrometer measurements 21.4.2009 11:32 6723.56 2643.66 0.02 Melalampi, clearing at spectrometer measurements 21.4.2009 11:33 6723.56 2643.66 0.04 Melalampi, clearing at spectrometer measurements 21.4.2009 11:33 6723.56 2643.66 0.07 Melalampi, clearing at spectrometer measurements 21.4.2009 11:34 6723.56 2643.66 0.05 Melalampi, spectrometer point 1. 21.4.2009 11:42 6721.72 2638.03 0.43 Melalampi, spectrometer point 2. 21.4.2009 11:44 6721.72 2638.03 1.06 Melalampi, spectrometer point 3. 21.4.2009 11:45 6721.72 2638.03 0.82 Melalampi, spectrometer point 4. 21.4.2009 11:46 6721.72 2638.03 0.96 Melalampi, spectrometer point 5. 21.4.2009 11:54 6721.72 2638.03 0.96 Melalampi, spectrometer point 6. 21.4.2009 11:56 6721.72 2638.03 0.49 Melalampi, spectrometer point 7. 21.4.2009 11:57 6721.72 2638.03 0.93 Melalampi, spectrometer point 8. 21.4.2009 12:00 6721.72 2638.03 0.92 Forest at the meteorological mast, left side 26.4.2009 12:34 6721.71 2638.21 0.90 Forest at the meteorological mast, left side 26.4.2009 12:36 6721.71 2638.21 0.74 Forest at the meteorological mast, left side 26.4.2009 12:44 6721.71 2638.21 0.88 Forest at the meteorological mast,right side 28.4.2009 12:45 6721.71 2638.21 1.11 Forest at the meteorological mast,right side 28.4.2009 12:46 6721.71 2638.21 1.12 Clearing at the meteorological mast 28.4.2009 12:56 6721.71 2638.21 0.33 Forest at the meteorological mast,right side 7.5.2009 15:32 6721.71 2638.21 1.17 Forest at the meteorological mast,right side 7.5.2009 15:33 6721.71 2638.21 1.13
March 16-19, 2010
Point Place Dominant species Latitude Longitude LAI
P12M_195 Tähtelä forest Scots pine 67.376993 26.626081 0.64 P6G_202 Halssinkankaannokka Scots pine 67.354159 26.652697 1.08 P33O_214 Halssinkankaannokka Scots pine 67.351206 26.661885 0.26 P13A_203 Kursala Norway spruce 67.345595 26.679090 0.82 P13O_203 Kursala Scots pine 67.346254 26.679292 0.50 UP1_H Kaikkonen Norway spruce 67.353188 26.686367 1.73 UP1_K Kaikkonen Scots pine 67.353841 26.685168 1.05 MA04_C Punamultajänkä Scots pine 67.441093 26.745143 0.60 AD01_G Heikinpalo Scots pine 67.490006 26.609191 0.87 153 Tähtelä forest Scots pine 67.372503 26.623291 0.25 154 Tähtelä forest Scots pine 67.370694 26.628759 0.98 155 Tähtelä forest Scots pine 67.369908 26.629434 1.52 156 Tähtelä forest Scots pine 67.368430 26.629821 1.51 158 Tähtelä forest Scots pine 67.367404 26.633841 1.49 160 Kehtomaa Scots pine 67.377870 26.632649 1.20 163 Kehtomaa Scots pine 67.379100 26.631667 0.45 164 Kehtomaa Scots pine 67.381989 26.629524 0.35 167 Kehtomaa Scots pine 67.387227 26.630804 1.27 168 Kehtomaa Scots pine 67.382790 26.629745 0.20 171 Halssikangas Scots pine 67.362881 26.637318 0.35 172 Halssikangas Scots pine 67.363436 26.636295 0.42 174 Halssinkankaannokka Scots pine 67.353566 26.659538 0.77 175 Ollinlampi Scots pine 67.358307 26.640927 0.11 178 Kurkiaapa Scots pine 67.297778 26.734475 0.05 179 Ala-Aavanmaa Scots pine 67.294853 26.734232 1.64 181 Yli-Aavanmaa Scots pine 67.301665 26.719360 0.80 186 Käyräsjokisuumaa Scots pine 67.274267 26.721457 1.86 187 Pyhä-Luosto Norway spruce 67.187723 26.811198 0.25 188 Kiiskimännikkö Norway spruce 67.199813 26.759702 0.98 191 Tähtelä forest Scots pine 67.377408 26.628907 1.52 192 Tähtelä forest Scots pine 67.376858 26.630158 1.51 193 Tähtelä shore Norway spruce 67.376261 26.621026 1.49 196 Tähtelä shore Deciduous 67.375237 26.620260 1.20 198 Tähtelä shore Norway spruce 67.375560 26.623453 0.45 205 Kaikkonen Norway spruce 67.356710 26.685149 0.96 206 Kaikkonen Norway spruce 67.357616 26.684899 1.83