Article
Dual-Wavelength (UV and Blue) Controlled
Photopolymerization Confinement for 3D-Printing:
Modeling and Analysis of Measurements
Jui-Teng Lin 1, Da-Chuan Cheng 2, Kuo-Ti Chen 3 and Hsia-Wei Liu 4, *
1 New Vision, Inc. New Taipei City, Taiwan, ROC, [email protected]
2 Department of Biomedical Imaging and Radiological Science, China Medical University, Taiwan, ROC,
3 Graduate Institute of Applied Science and Engineering, Fu Jen Catholic University, New Taipei City,
Taiwan, ROC, [email protected]
4 Department of Life Science, Fu Jen Catholic University, New Taipei City, Taiwan, ROC, [email protected]
* Correspondences: JT Lin, [email protected]; HW Liu, [email protected];
Abstract: The kinetics and modeling of dual-wavelength controlled photopolymerization confinement (PC) are presented and measured data are analyzed by analytic formulas and numerical data. The UV-light initiated inhibition effect is strongly monomer-dependent and different monomers have different C=C bond rate constants and conversion efficacy. Without the UV-light, for a given blue-light intensity, higher initiator concentration (C10) and rate constant (k’) lead to higher
conversion, as also predicted by analytic formulas, in which the total conversion rate (RT) is an
increasing function of k’R, which is proportional to k[gB1C1]0.5. However, the coupling factor b1 plays
a different role that higher b1 leads to higher conversion only in the transient regime; whereas higher
b1 leads lower steady-state conversion. For a fixed initiator concentration C10, higher inhibitor
concentration (C20) leads to lower conversion due to stronger inhibition effect. However, same
conversion reduction was found for the same H-factor of H0 = [b1C10 - b2C20]. Conversion of blue-only
are much higher than that of UV-only and UV-blue combined, in which high C20 results a strong
reduction of blue-only-conversion, such that the UV-light serves as the turn-off (trigger) mechanism for the purpose of spatial confirmation within the overlap area of UV and blue light. For example, UV-light controlled methacrylate conversion of a glycidyl dimethacrylate resin formulated with a tertiary amine co-initiator, and butyl nitrite, subject to a continuous exposure of a blue light, but an on-off exposure of a UV-light. Finally, we developed a theoretical new finding for the criterion of a good material/candidate governed by a double ratio of light-intensity and concentration, [I20C20.]/[I10C10].
Keywords: kinetic model; dual-wavelength; photopolymerization; spatial confirmation; additive manufacturing; 3D printing
1. Introduction
Polymers for 3D printing and customized additive manufacturing (AM) using various materials such as thermoplastics, polymeric resins, and inorganic powders, and under various methods of material extrusion, powder bed fusion and binder jetting have been developed [1-8]. Conventional photolithographic rapid prototyping achieves reaction confinement in depth through patterned irradiation of a resin having a strong absorbing at a specific wavelength and limited to a very thin layer of photo cured material. All contemporary stereo lithographic devices use of a single wavelength light to initiate polymerization patterned in a plane. However, the single-wavelength irradiation suffers the loss of polymerization confinement by accumulation of non-target light exposure [2-6]. To overcome this drawback, two-color (UV and blue lights), direct-write photolithography was reported, in which the UV-light selectively results polymerization inhibition,
concurrent with the blue-light photo-orthogonal, patterned irradiation employed to induce photopolymerization [9-11].
Idea dual-wavelength AM systems require the following conditions: (i) the photoinhibition light (UV) must yield significantly cease polymerization, while keeping sufficiently high polymerization rates produced by the initiation light (blue or red); (ii) a wide range of compatible monomers and co-initiators; (iii) the photoinhibition of free-radical chain-growth can be rapidly switched on and off by cycling the UV light; (iv) the formulated resins can be spatially confined using concurrent blue and UV irradiation; (v) rapid elimination of the inhibitor species in the dark, or after cessation of UV exposure; (vi) large polymerization inhibition depth adjacent to the projection window; and (vi) continuous part production at translation speeds of several hundred millimeters per hour. Above idea conditions allow for rapid, single-exposure fabrication of complex structures which can not be easily achieved by conventional single-wavelength methods.
Previously reported inhibition layers via oxygen inhibition are typically only tens of micrometers thick and thus it requires the use of low-viscosity resins or fabrication of objects with small cross sections. [6,7]. Single-wavelength, conventional and diffusion-reliant methods with a large inhibition thickness (IT) and high photoinitiation rates offer a continuous and rapid object printing [8-10]. However, they suffer the issues of separation resin reflow. In dual-wavelength systems, the IT may be reduced by decreasing irradiation intensity and thus increase the print speeds as polymerization proceeds closer to the projection window. For a given resin composition, the IT depends on the ratio of inhibitor to initiator absorbance, quantum yield of the radicals, reaction rates among the radicals and monomers. initiator, co-initiator and inhibitor, and the dual-wavelength light intensity and dose (or exposure time). The advantages of dual-wavelength concurrent inhibition and initiation photopolymerization include: controllable high vertical print speeds, eliminating the need for thin, oxygen-permeable projection windows, single-step fabrication of cured materials, rapid generation of personalized products, and the reflow into the inhibition volume during printing can be optimized for large cross-sectional area parts,
Dual-wavelength photopolymerization confinement (PC) were reported in both parallel [10] and perpendicular [11] concurrent irradiation schemes. In the parallel scheme, the volumetric PC was achieved by inhibition volume depth controlled by varying the ratio of the intensities of the UV and blue lights, where print speeds of 2 m/hour have been achieved in a wide variety of resins including acrylates, methacrylates, and vinyl ethers. In addition, by varying the intensity of the light source on a per-pixel basis, the system can perform surface topographical patterning in a single exposure/layer with no stage translation [10]. In the perpendicular scheme, photopolymerizations were reported to confine in depth the region polymerized resin, in which two perpendicular blue and UV lights, independently effect polymerization initiation and inhibition, respectively [11].
As reported by by van der Laan et al [11], the effectiveness of a photoinhibitor is strongly monomer-dependent, which also requires: (i) a high conversion of blue-photoinitiation in the absence of the UV-active inhibitor; (ii) a strong chain termination with significant reduction of blue and UV conversion in the presence of UV-active inhibitor; and (iii) short induction time or rapid elimination of the inhibitor species in the dark (or absence of UV-light), such that the initiation-inhibition cycles may be switched on and off rapidly. Fast switching-time may be achieved by high conversion rate, or high blue-light intensity, the triple-state quantum yield, and the absorption constant of the monomer resin. However, we note that higher light intensity achieves a faster photoinitiation, but suffers a lower saturation value, or lower conversion. Moreover, a short induction time may be achieved by high UV intensity or large inhibitor-concentration, and it also requires minimum impurity and oxygen which cause a delayed curing of the resin.
a factor of 64 reduction, Therefore, it is a better candidate than trimethylolpropane triacrylate (TMPTA) which only has a 3 times reduction of Kmax.
Although the mechanism for radical-mediated polymerization initiation and inhibition in dual-wavelength system and the simple formulas for the associated printing speed and inhibition volume thickness [11] were reported, there is no detailed kinetics or the conversion efficacy have been theoretically reported in a dual-wavelength, thick polymer system. We have previously reported the kinetics and modeling of a wavelength radical-mediated photopolymerization in single-initiator [12-14], two-single-initiator [15] and two-component system [16,17]. This study will extend our previous modeling to a 2-wavelength, 3-initiator system. We will focus on the following issues: the roles of the concentration of the blue-light active initiator and its co-initiator, and the UV-light-active inhibitor (BN); the role of reaction rates and light intensity on the conversion profiles; the polymerization inhibition depth and printing speed; and induction time, which is desired for a fast on-off switching control of PC. Finally, analytic formulas and numerical results will be utilized to analyze the measured data of de Beer et al [10] and van der Laan et al [11].
2. Materials and Methods
2.1. Photochemical Kinetic
As shown by Fig. 1, a dual wavelength (UV and blue light) radical-mediated system consists of photoinitiator, PA and a co-initiator, PC; and another photosensitizer, PB, which serves as a photoinhibitor for the monomer conversion. The blue-light (at 470 nm) excites photoinitiator (PA) producing excited states, PA* and triplet state T*; whereas the UV-light (at 365 nm) photodecomposes the photoinhibitor (PB) to produce an inhibition radical [N], and an initiation radical [X], which could interact with the monomer [M] for crosslinking. The PA triplet state (T*) could interact with the
co-initiator, PC, forming the primary radical (R’), which reacts with PA for a chain propagation and produces more radical (R). Bimolecular termination of R’ produces the propagating radical (R) which
leads to crosslink; terminations may be also resulted by the recombination of R, interaction of R’ and R, [N] and R’ and R.
Figure 1. Schematics of photochemical pathways of dual wavelength photopolymerization; in which crosslinkers are formed via two pathways, via the photoinitiator PA (under a blue light), and PB (under a UV light). The initiation radicals R and [X] crosslink with the monomer [M]; whereas the inhibition radicals [N] reduces the conversion efficacy by reducing the active radicals (R’ and R). Also shown is the co-initiator (PC) which reacts with the triplet state of PA (T*) forming an intermediate radical (R’). Bimolecular termination of R’ produces a propagating radical (R) which leads to crosslinks; terminations could be also resulted by the interaction of R and R’, and R and[N].
Using the short-hand notations for the concentration of various components: C1, C2, C3 for for the
ground state concentration of PA, PB and PC, respectively, and [M] for the monomer, the kinetic equations for the dual-color and 5 radicals (R’,R, [N], [X]) system are derived as follows [12,15,16]
∂C1
∂t = − gB1C3C1 (1)
∂C2
∂t = − g′B2[M]C2 (2)
∂C3
∂t = −gB1C3C1 + 2kTR 2+k
22R[N] (3)
∂[N]
∂t = B2C2− k22R[N] (4)
∂[X]
∂t = B2C2 – (k6+k8[M])[X] (5)
∂R′
∂t = gB1C1C3 – (2kTR ′+ k
12R )R′ (6)
∂R
∂t = − 2kTR
2− (𝑘′[M] + k
12R′+k22[N])R + 2kTR′2 (7)
∂[M]
∂t = − (k8[X] + k′R) [M] (8)
where B1=b1I1(z,t), B2= b2I2(z,t)I3(z,t)/I30, B3= (b3/b2)B2; g=1/(k57+kC3); g’=1/(k68+[M]), k57=(k5/k7),
k68=(k6/k8), k=(k3/k7). RE is the C1 regeneration term given by RE= k22[N]R+2kTR2. bj=83.6ajqjwj; aj is the
extinction coefficient for PA, PB and PC (with j=1,2,3); the light wavelength (in cm), w1 for the blue (at
470 nm), and w2 for UV (at 365 nm) and light intensity Ij(z,t) in mW/cm2; qj is the quantum yields of
the PA triplet state and PB radical.
Eq. (6) gives the generation of radical R’ via the interaction of T* and the co-initiator (PC), given by k3T*C3, with the steady-state T*=(g/k7)B1C1. The UV light intensity, I2(z,t), is absorbed mainly by
PB, in which the UV conversion of PA monomer is reduced by the presence of PB. On the other hand, the blue-conversion of PA could be significantly reduced by the UV-generated radical of PB, such that the inhibition depth may be controlled by the on-off of UV light, to be discussed more later. All
the reaction rate constants are defined by the associated coupling terms. For examples, in Eq. (7), k’
is for the reaction of monomer and radical R, which has a relaxation rate k5; k12 is for the radical
interaction of R’ and R, and both have a bimolecular termination rate of kT; More detail derivation
and definition of rate constants in g and g’, have been previously published [12,15].
Using the quasi-steady-state conditions of [12,15] d[N]/dt=d[X]/dt=d[R’]/dt=0, we obtain steady -state radicals given by [N]=B2C2/(k22R), [X]=g’B2C2/k8, and Eq. (8) becomes
∂[M]
∂t = −RT[M] (9)
Where RT is a total rate constant which consists of two crosslink components attributed from the
interaction of the monomer and [X] and R, respectively. Furthermore, the steady-state radicals, R’
and R, are given by
2kTR′2+ k12R′ − gB1C1C3= 0 (11)
2kTR2+ (𝑘′[M] + k12R′)R−(2kTR′2− B2C2) = 0 (12)
Solving for Eq. (11) and (12), we obtain
𝑅 = ( 1
4kT) [−𝐺 + √𝐺
2 + 8k
TH ] (13)
H = gB1C1C3− B2C2 (14)
where G=k’[M]+2k12R’. Eq. (13) may be further approximated to R=(0.5H/kT)0.5–k’[M](1-d), with
d=0.5G2/(8kTH), for 2k12R’<<k’[M], which shows that R and efficacy, are increasing function of H. The
balance point of inhibition depth is defined by when R=0, or 8kTH=0, or gB1C1C3=B2C2, in which the
PA initiated radical (R) is completely inhibited/consumed by the PB’s radical, [N]. We will have more
discussion later.
The dynamic light intensity of blue (I1) and UV (I2) are given by, when they are applied to the
resin orthogonally and separately, [13,15]
𝐼𝑗(𝑧, 𝑡) = 𝐼𝑗0 exp[−𝐴𝑗 𝑧] (15)
𝐴𝑗 (z, t) = 2.3(𝑎𝑗 𝐶𝑗0 + 𝑄𝑗 ) − 𝐴j1t (16)
where aj is the extinction coefficients of PA (for j=1) and PB (for j=2) and their photolysis products,
respectively; Qj is the absorption coefficient of the monomer at the blue and UV wavelength. Most
previous modeling [8-13] assumed a constant C (z, t) in Eq. (2.b). Our analytic formulas in this article will use a time-average of A (z, t) to count for the dynamic of light intensity due to PA and PB depletions. Accurate solutions of Eq. (1) and (8) require numerical simulations (to be shown later). For analytic formulas, we will use approximated analytic formulas for the light intensity and the PI and PE concentration and the expressive closed forms of Ij(z,t) and Cj(z,t) allow us to solve for the
first-order and second-order solutions of R, [M] and the conversion efficacy.
2.2. Analytic formulas for Efficacy
The monomer conversion efficacy for a bimolecular termination process is given by CEFF
=1-[M]/[M]0 = 1-exp(-S), with [M]0 being the initial monomer concentration, and the S-function is given
by the time integral of the total rate factor RT given by Eq. (1.f), d[M]dt= -RT[M], in which RT has 3
components defined by the coupling of the monomer [M] and the triplet-state, PA-radical, and PB radical, respectively.
For k53<<kC3, k68<<k”[M], gC3=g’[M] =1, the solutions of Eq. (1) to (3) are available by the
approximated analytic formulas for Ij(z,t) and Cj(z,t), with j=1,2,3, for PA, PB, PC, as follow [12,13] 𝐼𝑗(𝑧, 𝑡) = 𝐼𝑗0 exp[−𝐴𝑗 𝑧] (17)
𝐶𝑗 (𝑧, 𝑡) = 𝐶𝑗0 exp[−𝐵′𝑗 𝑡] (18)
𝐴𝑗 (z, t) = 2.3(𝑎𝑗 𝐶𝑗0 + 𝑄𝑗 ) − 𝐴j1t (19)
where B’j= bjIj0exp(-Aj’z), Aj1=2.3(aj-b’j)Cj0Ij0bjz, with Aj’ is the time-averaged absorption given by
Aj’=1.15(aj+b’j)+2.3Qj, bj’ is the extinction coefficient of the photolysis products. We note that the –Aj1t
term represents the decrease of Aj’, or increase of light intensity due to concentration depletions of
PA, PB and PC.
Using Eq. (17) and (18) for the total rate faction, RT, we solve for Eq. (9) to obtain the total efficacy
given by CEFF=1-[M]/[M]0= 1-exp(-S), with S is the time integral of RT , which requires a numerical
k’R=KH0.5, with K=0.5k’/kT0.5; case (ii) H<<G, k’R=k’H/G; where H0.5 may be further reduced to H0.5=
(B1C1)0.5- 0.5(B2C2)/(B1C1)0.5, for (B2C2)<<(B1C1), and gC3=1, for k=k3/k7=1.
In case (i) H>>G, CEFF=1-[M]/[M]0= 1-exp(-S), with S-function is given by
S=𝐾√𝐷10 [𝐸11 − 0.5(𝐷20/𝐷10)𝐸12 ] (20)
𝐸11= [1 − exp (−𝐺31𝑡)]/𝐺31 (21)
𝐸12= [1 − exp [−(𝐺32− 𝐺31)𝑡]/(𝐺32− 𝐺31) (22)
where initial values: Dj0=Bj0Xj,G3j=0.5(Bj0–A’1j), with Bj0= bjIj0Cj0, Xj=exp(-A’jz),
A’j=1.15(aj+𝑏j)Cj0+2.3Qj, is a mean value of Aj(z,t). We note that Eq. (20) reduces to our previous
formula for one-wavelength system with B20=0 and H=B1C1.
For case (ii), H<<G, and for k’[M]<<k’R, k’R=H/[M], Eq. (9) becomes
∂[M]
∂t = −H(t) (23)
Therefore, the efficacy is given by the time integral of H(t)/[M]0, or 𝐶𝐸𝐹𝐹= 𝑆/[𝑀]0 (24)
with S given by Eq. (20).
The steady-state of Eq. (21) and (22) are given by when E11=1/G31, E12=1/ (G32- G31), whereas
transient state is given by E11=E12 =t. Therefore, the inhibition effect given by the second term of Eq.
(21) is proportional to B20/(B10)0.5/ (G32- G31), with Bj0= bjIj0Cj0, for steady-state; and [tB20/(B10)0.5] for
transient state. Numerical data will be shown later. We also note that for a given B1C1, the radical R
is a decreasing function of the ratio of RAB=(B2C2)/ (B1C1)0.5. Therefore, same RAB reaches the same
efficacy. This feature will be numerically shown later.
2.3 The Inhibition depth and Time
Polymerization inhibition depth adjacent to the projection window is a critical parameter for continuous stereolithographic fabrication. One may find the inhibition depth (zH) defined by the
balance point of initiation and inhibition rate, or when R=0, or H=0. We find from Eq. (14),
𝑧𝐻(t) = 1
A2+A3 −A1 ln (
B20C2
𝑔B10C1C3) (25)
where Bj0= bjIj0, and Cj(t) are the z-averaged function of Cj(z,t). We note that Eq. (8) defines an
inhibition coefficient defined by 𝛽 =(b2/b1)[C2/(gC1C3)], which depends on multifactor and rate
constants related by g=1/(k57+kC3). Our formula is more general than that of de Beer et al [10] which
is our special case when A3=0, and C2=gC1C3, such that Eq. (25) reduces to Eq. (1) of de Beer et al [10]:
zH=(1/(A2-A1)ln[𝛽 I20//I10], with 𝛽(k37 + kC3 + [M])b2/b1. We note that bj=83.6ajqjwj; which is defined
by the extinction coefficient for PA, PB and PC (with j=1,2,3); the light wavelength, w1 for the blue (at
470 nm), and w2 for UV (at 365 nm) and the quantum yields (qj). Moreover, in our more general
formula, 𝛽 is also proportional to 1/g= k57+kC3, defined by the rate constants of k57 and k=k3/7.
Due to the time-dependence of Cj(z,t), Eq. (25) in general is time-dependent, which was
assumed as time-independent by de Beer et al [10], when Cj reaches a steady-state or remains as its
initial value, in which the initiators depletion is ignored. To explore this dynamic feature, one may define an inhibition time (TH) given by when the radical R=H=0. For a common situation that that
C1(t)=C10 exp(-B’t), with PA has a depletion rate, B’, much larger than that of PB and PC, such that
C2(t)=C20, C3(t)=C30, both are much slowing decay function of time (to be shown by our numerical data
later), we obtain an analytic formula
𝑇𝐻= 1 B′ln (
I10
𝛽′ I20exp[ (A2 +A3 −A1 )𝑧] ) (26)
where β′ =(b2/b1)[C20/(gC10C30)]. Eq. (26) shows that TH is an increasing function of the depth (z),
but a decreasing function of the concentration ratio C20/(C10C30), i.e., higher inhibitor concentration
The thickness of this polymerization inhibition volume adjacent to the projection window is a critical parameter for continuous stereolithographic fabrication. A minimum intensity ratio of UV and blue light, Rmin = (I20/I10)crit defined by which initiation and inhibition rates are balanced to
generate an inhibition depth, zH=0 in Eq. (25), and can be calculated by when Rmin = 1/ β′=
gC10C30/[(b2/b1)C20], which is dependent on resin composition ratios and rate constants. de Beer et al
[10] reported β′ = 1 in a TMPTA-based system.
Above formulas, Eq. (8) are based on H = 0 as also defined by de Beer et al [10]. A more accurate definition should be based on the time integral of RT, and defined by o the S-function higher than a
critical value, S> ST, or efficacy CEFF >CT, where ST=ln [1/(1-CT)], which can only be calculated
numerically (to be shown later).
2.4 Print Speed
Based on Eq. (13), the maximum print speed (Smax) as defined by de Beer et al [10], when the dose difference of blue light and UV light equals to a critical value (E*), and B1= 𝛽B2, we obtain a
similar formula
Smax=
B20−βB10
E∗ (27)
which, however, has a much complex function of 𝛽 =(C2b20/b10)/(gC1C3), than the simplified
function of de Beer et al [10], with 𝛽 =b20/b10. A more accurate definition would be based on the S
function, or time integral of Eq. (10), rather than light dose given by Eq. (20). However, Smax needs
numerical result integral of Eq. (10), to be shown later.
2.5Curing depth
There are two ways to define a curing depth of the green light: the simple one is defined by when the blue light dose, I10t, larger than a threshold value of ETH. Using the time integral of Eq. (17) with
neglected A1t, we obtain,
𝑧𝐶 = 1
A1ln (
I10𝑡
ETH) (29)
Above formula is the same as that of de Beer et al [10]. However, the more accurate definition of curing depth is given by when the blue-light conversion efficacy, given by Eq. (20), is higher than a critical value, CEFF >CT, or when S> ST, with ST=ln [1/(1-CT)]. We obtain
𝑇𝐶 = ( 2
B′) ln[B′/(K√0,5𝑋′𝐵 ) − 1 ] (30)
where B’= (b1I10C10), and X’=exp(-A’zC), with A’=1.15(a’1+b’2)C10+2.3Q1, is a mean value of A1(z,t).
3. Results and Discussion
Numerical results based on Eq. (1) to (8) and the steady-state radical given by Eq. (13), and using the light intensities given by Eq. (17) are shown as follows. We will first show the conversion for the case of blue-light only, i.e., when B2=0 (no UV light) for various concentration of the initiator, C10= (0,
0.5, 1.0, 3.0) %, and coupling parameter b1 which is given by the absorption coefficient and blue-light
intensity; and also the role of the crosslink rate constant (k’) which gives the conversion in Eq. (10). For simplicity, our modeling will limit to the surface layer of the resin, that is for z=0. Spatial conversion profiles can be found in our previous study, but limited to a single-wavelength system [13,14].
our numerical input will be the the initial values of Bj or bj (with j=1,2) rather than the light intensity
or the absorption coefficients. We will also show that the IBE is strongly monomer-dependent, as reported by van der Laan et al [11] by various reaction rate constants (k’, kT). The numerically
produced temporal profiles will be analyzed by our analytic formulas of Eq. (20). Finally, our numerical profiles will fit to the measured data of de Beer et al [10] and van der Laan et al [11] in an on-off scheme.
3.1. Efficacy Temporal Profiles
We will first show the conversion of blue-light only (without the UV-light). Fig. 2 (left Figure) shows that higher initiator concentration, C10, leads to higher conversion, as also predicted by our Eq.
(10), in which the total conversion rate (RT) is an increasing function of k’R, which is proportional to
[gB1C1]0.5. However, the coupling factor b1 plays a different role that higher b1 leads to higher
conversion only in the transient regime; whereas higher b1 leads lower steady-state conversion (as
shown by right Figure). This unique reverse effect in steady-state is also predicted by our analytic Eq. (20).
Fig. 3 shows that higher coupling rate constant (k’) leads to higher conversion, as also predicted
by Eq. (10). These calculated profiles well fit with the measured data of de Beer et al [10], for various resin formations (shown by their Figure 3).
Figure 4 shows the conversion profiles for blue-only, UV-only, and both-light and compared with
measured data of de Beer et al [10], with fit parameter of k’, kT and bj. Conversion of blue-only are much
higher than that of UV-only and UV-blue combined, in which high inhibitor concentration (C20)
results a strong reduction of blue-only-conversion, such that the UV-light serves as the turn-off (trigger) mechanism for the purpose of spatial confirmation within the overlap area of UV and blue light. Figure 5 shows the conversion profiles under the same conditions as that of Figure 4, but for different resin formations which are specified by our parameter k”. As reported by van der Laan et al [11], different monomers have different C=C bond rate constants (K) under the exposure of blue, UV and blue+UV. For example, bisphenol ethoxylate diacrylate (BPAEDA) resins formulated with camphorquinone (CQ) and ethyl 4-(dimethylamino)benzoate (EDAB) have a maximum conversion rate constant Kmax= 0.675 (at blue+UV) for 0% butyl nitrite (BN), and reduces to 0.0106 (for 1%BN), a factor of 64 reduction, Therefore, it is a better candidate than trimethylolpropane triacrylate (TMPTA) which only has a 3 times reduction of Kmax.
Similar to Figure 4, Figure 5 also shows significant reduction of conversion under the UV-light initiated inhibition of the radical (R). This is one of the key factors to achieve efficient photopolymerization confirmation (PC).
Figure 6 shows the initiation radical (R, left) and conversion (right) profiles in the presence of UV and blue light, for various inhibitor concentration (C20), in which, for a fixed initiator
concentration C10, higher C20 leads to lower conversion due to stronger inhibition effect. However, ,
as shown by Figure 7, same conversion reduction was found for the same H-factor of H0 = [b1C10 -
Figure 2. Conversion profiles of blue-light (without UV-light) for (left Figure) C10 = (0.05, 0.1, 0.2, 0.4)%, for curve (1,2,3,4), for fixed b1=0.1; and (right Figure) b1= (0.015, 0.05,0.15,0.5), for fixed C10 =0.2%; for C30 =0.5 (%), [M]0 =0.2 (%), k’=1.0, kT=0.5, k57=(k5/k7)=k68=(k6/k8)=k”=35 (1/s).
Figure 3. Same as Fig.2 but for various k’= (1.0, 0.3, 0.19), for curves (1,2,3), for fixed C10 =0.2%, and adjusted b1= (0.15, 0.05, 0.05) to fit the measured data of de Beer et al [10].
Figure 5. Same as Fig.4, but for different monomers governed by various k”=60 (left Figure) and
k”=150 (right Figure), for b1=0.05, b2=0.007, k’=1.0, where bars are measured data of de Beer et al [10].
Figure 6.The initiation radical (R, left) and conversion (right) profiles in the presence of UV light; for various inhibitor concentration,C20 = (0,1.0,2.0, 3.0), for curve (red, green, blue, violet), for b1= b3=0.1
(1/s/%), C10 =0.2 (%), C30 =0.5 (%), [M]0 =0.2 (%); k’= 1.0 (1/s), k48 =1.0 (1/s), k37=1.0 (1/s), k57 =0.01 (1/s).
Figure 7.Same as Fig. 6, but for a fixed difference of [b1C10 - b2C20] = 0.003, showing the overlapping of all curves, for C20>0.
3.2. Analysis of measured data
Our modeling conversion profiles shown by Fig. 3, 4 and 5 could be compared with the Figure 3 of de Beer et al [10], where to fit their data, we have adjusted the parameters of b1, b2 and rate
constants (k’, k”, kT), but kept the same initiator concentrations (C10, C20, C30), as the measured data
[10]. The monomer-dependence of the conversion for various resin formations are governed by the adjusted rate constants (in a relative amount), because the actual values are not available,
data that inhibition effects are an increasing function of the inhibitor concentration, although our curves are slightly higher. The difference might be due to the fact that our modeling is based on idea kinetics and excludes complex factors involved in the measurements. In addition, our presented conversions are for the surface layer only (with z=0). Therefore, we expect a better fit if the spatial (z-dependence) conversion profiles are included, as shown by our Eq. (15). However, most of the features and the roles of the key parameters presented based on surface layer should also apply to a volume conversion. Spatial conversion profiles can be found in our previous study, but limited to a single-wavelength system [13,14].
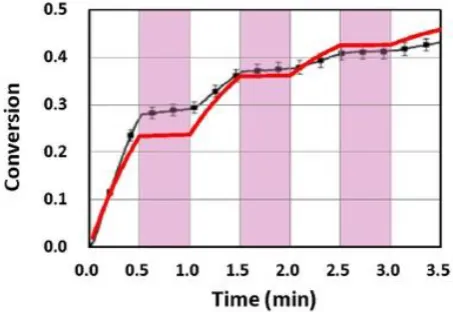
van der Laan et al [11] also reported the UV-light controlled conversion in an on-off scheme, in which methacrylate conversion of a glycidyl dimethacrylate (bisGMA) resin formulated with 0.2 wt% CQ, 0.5wt% EDAB, a tertiary amine co-initiator, and 0.5wt% butyl nitrite (BN). Figure 9 shows the calculated conversion profile of methacrylate subject to a continuous exposure of a blue light, but an on-off exposure of a UV-light for 0.5 min, as indicated by the violet vertical areas. Measured data of van der Laan et al [11], shown by their Figure 4, are well fit to our theoretical curve (in red).
3.3. The general criterion for efficient UV-inhibitor
The monomer-dependence of a dual-wavelength PC was reported by van der Laan et al [11], in which different monomers have different C=C bond rate constants (K) under the exposure of blue, UV and blue+UV. For example, bisphenol ethoxylate diacrylate (BPAEDA) resins formulated with camphorquinone (CQ) and ethyl 4-(dimethylamino)benzoate (EDAB) have a maximum conversion rate constant Kmax= 0.675 (at blue+UV) for 0% butyl nitrite (BN), and reduces to 0.0106 (for 1%BN), a factor of 64 reduction, Therefore, it is a better candidate than trimethylolpropane triacrylate (TMPTA) which only has a 3 times reduction of Kmax. The above measured feature could be mathematically described by a more general criterion.
Based on our H-factor defined in Eq. (14), which also governs the conversion efficacy, a general criteria for efficient UV-inhibitor, or a good candidate, could be mathematically determined as follows. Defining two H factors: HOFF and HON for the H-value without and with-UV, respectively, an efficient
candidate (or effective UV-inhibitor) requires two conditions: (i) high enough HOFF such that the
conversion without UV-light larger than 50%; and (ii) high enough HON such that the conversion of
both blue and UV light is reduced to lower than 20%. This concept could be further described mathematically as follows. H= HOFF - HON=HOFF (1-HON/HOFF). Therefore, a good candidate requires a
large HOFF and also a high H-ratio, RH=HON/HOFF. For example, for a fixed value of HOFF =10, a
candidate with HON =6 leading to RH=0.6, and H=10x (1-0.6)=40, is not as good as a candidate having
a higher HON =8 leading to RH=0.8 and H=80), which is 4 times higher.
From Eq. (14), H=gC3B1C1-B2C2 , which defines RH= B2C2/(gC3B1C1). We note that Bj= bjIj, which is
proportional to the light intensities (I1 for blue-light and and I2 for UV-light) and the effective
absorption constant (bj) governed by the quantum yield (q) and absorption coefficient at a specific
wavelength. Therefore, a high H-ratio (RH) is determined not only by the material properties, but also
the ratio of light intensity (UV/blue), and concentration ratio of the initiator and inhibitor, C20/C10. In
addition, it is also rate-constant dependence, because the g-factor is given by g= g=1/(k57+kC3).
Therefore, we conclude that the criterion for a good candidate is governed by collective factors, and at least by the double ratio of [I20C20.]/[I10C10]. Above criterion is the important new finding of our
Figure 8.The initiation radical (left) and conversion (right) profiles for C20 = (0, 0.5,1.0, 3.0), for curve (red, green, blue, violet), in the presence of both blue and UV light; for b1=0.04, b2=0.002, b3=0.1 (1/s/%);
k’= 2.0 (1/s), k48 =10 (1/s), k37=20(1/s), k57 =0.01 (1/s). In left figure, the background is measured data of
van der Laan et al [11] .
Figure 9. Methacrylate conversion of a bisGMA/TEGDMA resin formulated with 0.2 wt% CQ/0.5wt% EDAB/0/5wt%BN and subject to a continuous exposure of a blue light, but an on-off exposure of a UV-light for 0.5 min, as indicated by the violet vertical areas; where black bars are measured data of van der Laan et al [11] and red curve is our theoretical simulation.
4. Conclusion
We have theoretically demonstrated that without the UV-light, for a given blue-light intensity, higher initiator concentration (C10) and rate constant (k’) lead to higher conversion, governed by a
scaling law of k[gB1C1]0.5. However, the coupling factor b1 plays a different role that higher b1 leads
to higher conversion only in the transient regime; whereas higher b1 leads lower steady-state
conversion. For a fixed initiator concentration C10, higher C20 leads to lower conversion due to
stronger inhibition effect. However, same conversion reduction was found for the same H0 = [b1C10 -
b2C20]. Conversion of blue-only are much higher than that of UV-only and UV-blue combined, such
that the UV-light serves as the turn-off (trigger) mechanism for the purpose of PC. The UV-light initiated inhibition effect is strongly monomer-dependent and different monomers have different C=C bond rate constants and conversion efficacy.
Conflicts of Interest: Jui-Teng Lin is the CEO of New Vision , Inc. The funders had no role in the design of the study; in the collection, analyses, or interpretation of data; in the writing of the manuscript, or in the decision to publish the results.
1. Belter, J.T.; Dollar, A. M. Strengthening of 3D printed fused deposition manufactured parts using the fill compositing technique. PLOS ONE 10, 2015, e0122915.
2. Gao, G.; Zhang, Y.; Ramanujan, D.; Ramani, K.; et al. The status, challenges, and future of additive manufacturing in engineering. Comput. Aided Des. 2015, 69, 65–89.
3. Ligon, S. C.; Liska, R.; Stampfl, J.; Gurr, M.; Mulhaupt, R. Polymers for 3D Printing and Customized Additive Manufacturing. Chem. Rev. 2017, 117, 10212−10290.
4. Takagishi, K.; Umezu, S. Development of the improving process for the 3D printed structure. Sci. Rep. 2017, 7, 39852.
5. Shusteff, M.; Browar, A. E. M.; Kelly, B. E.; Henriksson, J.; Weisgraber, T. H.; Panas, R. M.; Fang, N. X.; Spadaccini, C. M. One-step Volumetric Additive Manufacturing of Complex Polymer Structures. Sci. Adv. 2017, 3, 7.
6. Janusziewicz, R.; Tumbleston, J. R.; Quintanilla, A. L.; Mecham, S. J.; DeSimone, J. M. Layerless Fabrication with Continuous Liquid Interface Production. Proc. Natl. Acad. Sci. U. S. A. 2016, 113, 11703− 11708. 7. Zhu, W.; Tringale, K. R.; Woller, S. A.; You, S. T.; Johnson, S.; Shen, H. X.; Schimelman, J.; Whitney, M.;
Steinauer, J.; Xu, W. Z.; Yaksh, T. L.; Nguyen, Q. T.; Chen, S. C. Rapid Continuous 3D Printing of Customizable Peripheral Nerve Guidance Conduits. Mater. Today 2018, 21, 951−959.
8. Kelly, B. E.; Bhattacharya, I.; Heidari, H.; Shusteff, M.; Spadaccini, C. M.; Taylor, H. K. Volumetric Additive Manufacturing via Tomographic Reconstruction. Science 2019, 363, 1075−1079.
9. Scott, T. F.; Kowalski, B. A.; Sullivan, A. C.; Bowman, C. N.; McLeod, R. R. Two-Color Single-Photon Photoinitiation and Photoinhibition for Subdiffraction Photolithography. Science 2009, 324, 913−917. 10. de Beer, M. P.; van der Laan, H. L.; Cole, M. A.; Whelan, R. J.; Burns, M. A.; Scott, T. F. Rapid, Continuous
Additive Manufacturing by Volumetric Polymerization Inhibition Patterning. Sci. Adv. 2019, 5, 8. 11. van der Laan, H. L.; Burns, M. A.; Scott, T. F. Volumetric Photopolymerization Confinement through
Dual-Wavelength Photoinitiation and Photoinhibition. ACS Macro Lett. 2019, 8, 899-904.
12. Lin, J.T. Efficacy S-formula and kinetics of oxygen-mediated (type-II) and non-oxygen-mediated (type-I) corneal cross-linking. Ophthalmology Research. 2018, 8,1-11.
13. Lin, J.T.; Cheng, D.C. Modeling the efficacy profiles of UV-light activated corneal collagen crosslinking. PloS ONE. 2017, 12, e0175002.
14. Lin, J.T.; Liu, H.W.; Chen, K.T.; Cheng, D.C. Modeling the optimal conditions for improved efficacy and crosslink depth of photo-initiated polymerization. Polymers. 2019, 11, 217; doi:10.3390/polym11020217. 15. Lin, J.T. Kinetics of enhancement for corneal cross-linking: proposed model for a two-initiator system.
Ophthalmology Research. 2019, 10:1-6.
16. Chen KT, Lin JT, HW Liu. Enhancing radical-mediated photopolymerization efficacy and crosslink depth: kinetic and model of a two-monomer system. Res Med Eng Sci. 2019, 8(2):853-860.
![Figure 2. Conversion profiles of blue-light (without UV-light) for (left Figure) C10 = (0.05, 0.1, 0.2, 0.4)%, for curve (1,2,3,4), for fixed b1=0.1; and (right Figure) b1= (0.015, 0.05,0.15,0.5), for fixed C10 =0.2%; for C30 =0.5 (%), [M]0 =0.2 (%), k’=1.](https://thumb-us.123doks.com/thumbv2/123dok_us/7893711.1310107/9.595.171.342.551.697/figure-conversion-profiles-figure-curve-right-figure-fixed.webp)
![Figure 7. Same as Fig. 6, but for a fixed difference of [b1C10 - b2C20] = 0.003, showing the overlapping of all curves, for C20>0](https://thumb-us.123doks.com/thumbv2/123dok_us/7893711.1310107/10.595.210.387.486.619/figure-fig-fixed-difference-c-showing-overlapping-curves.webp)