R E S E A R C H
Open Access
A new measurement algorithm for PMU in
power system based on all-phase Fourier
transform
Peng Luo
1*, Hui Fan
1, Suxiang Zhang
2, Xiaoguang Hao
1and Xiaowei Wang
1Abstract
One new vector estimation approach for phasor measurement units (PMUs) within power system is put forward, which is built upon the basis of apFFT, namely all-phase fast Fourier transform. On account of the remarkable accomplishment of apFFT when subduing property of “phase invariant” and spectral leakage, the estimation approach is capable of achieving quick evaluation of PMU phase angles, and subsequently, the spectrum correction of time-shift phase discrepancy is used so as to evaluate the amplitude and frequency parameters. The calculation flow of the algorithm is given, and the hardware design of the new PMU measuring system is completed by using ARM9 microprocessor. Simulation result indicates that the method in this paper is roughly the same to an estimator without bias for noise-free conditions, and this calculation precision is also better than the existing approach.
Keywords:Phasor measurement unit (PMU), Vector estimation, All-phase fast Fourier transform (apFFT), Phase invariant, ARM9 microprocessor
1 Introduction
Against the background of increasing technical growth and usage of smart grid, stability and security of electric power system is of particular significance [1,2]. How to construct the dynamic stability monitoring and control system for whole power grid is a problem urgent to be solved. Phasor measurement unit is built on the basis of the GPS, namely the global position system, and great accuracy timing signals, which enjoys widespread appli-cations within wide-area measurement system so as to achieve simultaneous sampling of various nodes in the system mentioned above [3]. Various kinds of phasor measurement units (PMUs) get used in areas containing on-line parameter estimation, wide-area protection, fault location, and power grid dynamic calculation [4–6], and the PMU algorithm’s performance is prone to exert dir-ect influence on the capability of this system.
Phasor measurement algorithms chiefly get created so as to evaluate the phase angle, amplitude, and frequency parameters of electric power system, mainly including
discrete Fourier transform method, zero-crossing detec-tion method, and Kalman filtering method [7, 8]. Be-cause of the wonderful harmonic suppression of discrete Fourier transform (DFT) for stationary signal, this method is widely applied at present. However, when the operating frequency of the system deviates from 50 Hz, the receiving data of PMUs cannot satisfy the condition of integral period sampling, and the frequency aliasing and spectral leakage of DFT method will cause big er-rors in parameter estimation. In paper [9], length of the data window gets designed to function as a variable so as to promote frequency estimation accuracy, while the computational complexity gets great increase. In paper [10], sampling frequency gets regulated flexibly by sys-tem operating frequency so as to meet the restriction of integer-period sampling. Nevertheless, bay level IEDs cannot get direct command of the sampling rate of process level in typical substations, making a problem of practical applications. Paper [11] presents one vector measurement approach on the basis of recursive DFT, which reduces the estimation error of frequency signifi-cantly. But this method cannot solve the problem of spectral leakage or frequency aliasing also, and the
© The Author(s). 2019Open AccessThis article is distributed under the terms of the Creative Commons Attribution 4.0 International License (http://creativecommons.org/licenses/by/4.0/), which permits unrestricted use, distribution, and reproduction in any medium, provided you give appropriate credit to the original author(s) and the source, provide a link to the Creative Commons license, and indicate if changes were made.
* Correspondence:[email protected]
1State Grid Hebei Electric Power Research Institute, Shijiazhuang 050021, China
amplitude of signal is assumed to be fixed, which is not suitable for dynamic condition.
In this paper, a new power system vector measuring algorithm on the basis of all-phase fast Fourier trans-form (apFFT) [12–14] is proposed, in which phase, fre-quency, and amplitude parameters of received PMU signal can be estimated synchronously, and the input data need not be sampled by strictly integrated periods.
The remaining part of this paper is designed as shown below: Section 2 will give a brief description about the relevant concepts of all-phase spectral analysis, and the evaluation performance of phase parameters for deter-ministic condition will come up in Section 3. In Section 4, time-shift phase difference correcting method is put forward so as to evaluate the amplitude and frequency of observed signals. Finally, simulation results and con-clusion are presented respectively.
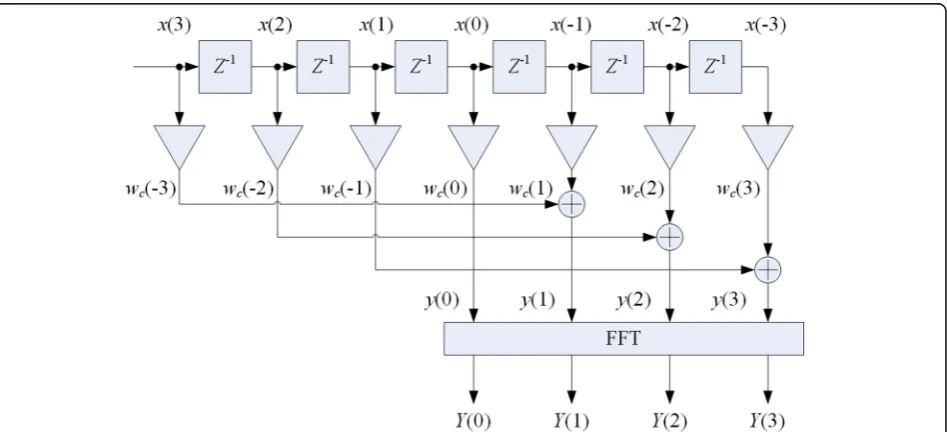
2 Description of current analysis method The apFFT’s data process flow is shown in Fig.1.
From this figure, convolution windowwc = [wc(−N+ 1),…, wc(−1), wc(0), wc(1),…,wc(N−1)]Tgets framed by front window f convolved with reversal back window b, which is the result of the cross-correlation operation of two window sequences with lengthN, counted by:
wcð Þ ¼n f nð Þ bð Þ−n ; n∈ −N½ þ1;N−1 0; j jn≥N
ð1Þ
Here, the front windowf and the back windowb are usually required to be the same symmetrical window,
and none of them are rectangular windows. Due to the symmetry of fand b, the convolution windowwcis also a symmetrical window aswc(n) =wc(−n).
The FT ofwcis as follows:
Wc ejω ¼ F ejω B e −jω¼F ejω B ejω ð2Þ
It is found that the Fourier transform of the whole N types of data units containing point x(0) are taken into full consideration in the apFFT result, which brings many excellent performance such as flat phase distribu-tion in the vicinity of the spectral peak and suppression of amplitude spectral leakage. Besides, the FFTs of vari-ous data units are taken into account, and the calcula-tion of apFFT is realized by simply one FFT, significantly improving the computational efficiency.
For the applications of phasor measurement in power system, the measured current and voltage signals often have typical stationary signal characteristics and are mostly single-frequency signals. For this type of input data, the window function used for data pre-processing is a key factor to improve the performance of the algorithm.
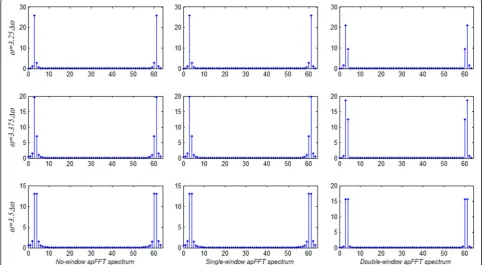
Take the most common cosine voltage amplitude sig-nal as an example, the sampling pointN= 64, frequency sampling intervalΔω = 2π/64 rad/s, and three single fre-quency cosine signals have digital angular frequencies of 3.25Δω, 3.375Δω, and 3.5Δω, respectively. The three groups of data were pre-processed with no-window, single-window, and double-window functions, then DFT
operations were performed and the resulting apFFT discrete spectrum is shown in Fig.2.
From the comparison results, for the single-frequency sampling data of power system, the pre-processing of window function can effectively suppress the energy leakage caused by the offset of the sampling frequency. In particular, when the frequency offset reaches 0.5Δω, the results of the double-window apFFT spectrum are basically only focused on the two main spectral lines. In the absence of no-window and single-window, besides the main spectral lines, there are also some side spectral leaks. Based on this situation, this paper chooses the double-window all-phase data pre-processing scheme and selects the Hanning window function with better performance against high-frequency interference.
3 Phase estimation of deterministic signal
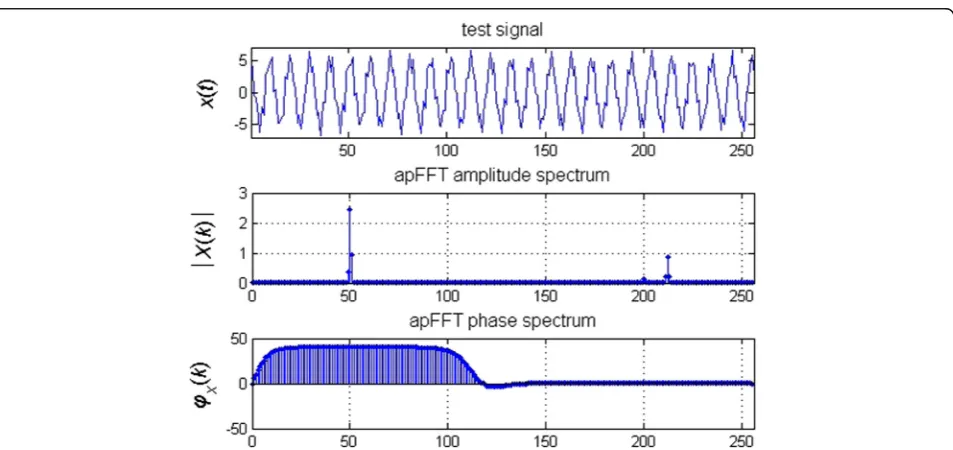
Think about one compound test signal including 3 ele-ments with different signal parameters:
x nð Þ ¼X 3
m¼1
cos 2ð πωmn=NþφmÞ; n∈ −N½ þ1;N−1
ð3Þ
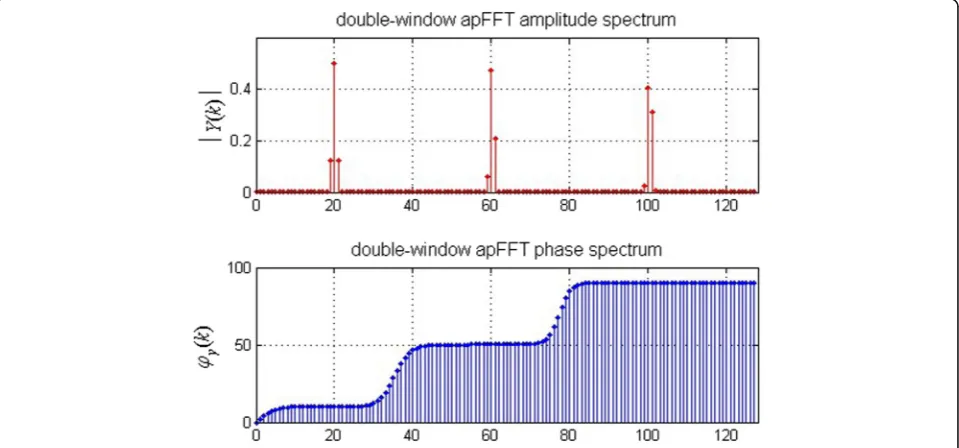
where ω1= 20.0, ω2= 60.2, ω3= 100.4, φ1= 10°, φ2=
50°, φ3= 90°, and N= 256. Figures 3 and 4 have shown
the windowed FFT of x(n) and the double-window apFFT ofx(n), respectively, and rising-cosine windowwh is used as a window function with an expression as follows:
whð Þ ¼n 0:5 1−cos 2πn N−1
; n∈½0;N−1 ð4Þ
From the figures listed above, apFFT enjoys a greater feature of spectrum decrease of leakage in comparison with FFT, the leakage of energy because of non-integer process sampling, and cross talks among various fre-quency elements get significantly inhibited within 2 spectral lines.
When it comes to the phase spectrum, conventional FFT spectrum is irregular, and the spectral value ap-proaches theoretical value 10° at positionk= 20 (integral period sampling point), but there is a big deviation be-tween measured phase and real phase at the pointsk= 60 and k = 100. The apFFT spectrum shows one orga-nized allocation nearby object frequency, that is, the fea-ture of “phase invariant.” Using this advantage, the initial phases of all signal components can be estimated without any error correction. The phase measurement of these two approaches gets listed in Table1.
4 Frequency and amplitude estimation
Similar to discrete Fourier transform, the barrier ef-fect of apFFT spectral analysis also exists. If the length of calculation samples is N, then the minimum resolution of digital angular frequency Δω = 2π/N, and the real frequency position of signal lies between the two adjacent spectrum lines with the interval of Δω.
In the paper, data intercepting approach gets improve-ment, and brand-new time-shift phase discrepancy cor-recting method is put forward so as to evaluate PMU vectors’ frequency and amplitude. Detailed procedures get shown below:
Received signal is taken as a sample (perhaps not be integer process sampled) and falls into 2 sets,
Fig. 4Double-window apFFT spectrum ofx(n). The double-window apFFT spectrum of the test signal is listed in Fig.2. The rising-cosine window is taken as window function here, and the expression of the window function is given in Eq. (4). The upper half of Fig.3is the apFFT amplitude spectrum of the experimental signal, and the bottom part is the apFFT phase spectrum of the signal
includingx1(n) andx2(n) having set length 2N+ 1.
Time delay ofx1(n) andx2(n) isn0:
x1ð Þ ¼n Aejω
nþθ
ð Þ;n∈ −½ Nþ1;N−1 ð5Þ
x2ð Þ ¼n Aejω
ðn−n0Þþθ
½ ;n∈ −½ Nþ1;N−1 ð6Þ
Perform double-windowed apFFT concerningx1(n)
andx2(n), and phase difference between them given
by Eq. (7) is obtained from phase spectrum in the major spectral linek*, in which 2n0k*π/Nis the
compensation value of digital frequency 2 k*π/Nof spectrumk*with time delayn0:
Δφ¼φ1ð Þk −φ2ð Þ þk 2n0kπ=N ¼ωn0 ð7Þ
On the basis of Eq. (7), the evaluation of frequency with phase compensation and frequency deviation at spectral linek*gets generated respectively as Eqs. (8) and (9):
^ ω¼ φ
1ð Þk −φ2ð Þk
½ =n0þ2kπ=N ð8Þ
dω¼ω^−2kπ=N¼½φ1ð Þk −φ2ð Þk =n0 ð9Þ
Calculate the signal amplitude by deviation of frequencydω; in the case of double-window apFFT, the evaluation equation is:
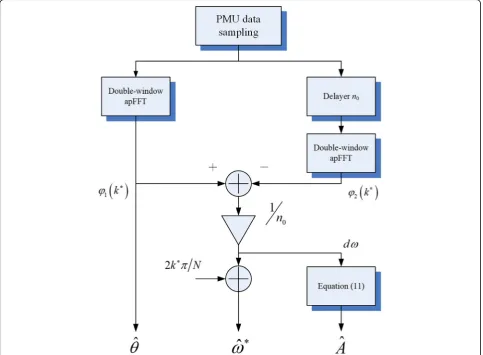
Fig. 5Processing flow of PUM vector measurement. The processing flow of proposed PUM vector measurement algorithm on the basis of all-phase spectrum analysis is listed, where the all-phase, frequency, and amplitude parameters of received PMU signal can be estimated synchronously, and the input data need not be sampled by strictly integrated periods
Table 1Contrast of phase measurement outcomes (N= 256)
Real value Windowed FFT Double-window apFFT
k= 100 90° 161.7187408919° 89.9999999999°
k= 60 50° 85.8592933936° 50.0000000006°
Fig. 6Hardware construction of PUM vector measurement system based on ARM9 processor. The typical implementation of PMU measurement system based on ARM9 processor. The system consists of front-end analog access circuit, signal conditioning circuit, A/D converter, ARM9 LPC3250 microprocessor, and external system
^
In the paper, the Hanning window is used for window function, then the amplitude parameter is adjusted to Eq. (11):
All in all, the processing flow of proposed PUM vector measuring algorithm is offered (Fig.5).
5 System hardware design
In order to implement the algorithm, the optimal imple-mentation of PMU measurement system based on ARM9 processor is shown in Fig.6.
The system consists of front-end analog access circuit, signal conditioning circuit, A/D converter, ARM9 LPC3250 microprocessor, and external system. The front-end analog access circuit is responsible for isolat-ing the measured AC signal before accessisolat-ing the system and improving the security of the entire measurement system. The analog signal conditioning circuit consists of an integrated operational amplifier and a digital po-tentiometer, the voltage and current signals are ampli-fied, and the digital potentiometer performs feedback resistance adjustment under the control of the ARM processor to achieve automatic variable range measure-ment. The ADS8568 type 8 channel synchronous sam-pling converter is used in the A/D conversion circuit. An industrial class ARM9 microcontroller LPC3250 is used as the control and operation core of the PMU measurement system. The external SPI-type flash mem-ory is used to store measurement information and sys-tem parameters. The Ethernet port is used to achieve communication with the scheduling terminal. SDRAM is used to store and execute the test master program code.
6 Simulation results and discussion
6.1 Experiment 1: Performance of algorithm under harmonics condition
A high-precision three-phase synchronized vector meas-uring device is used as signal generator in this experi-ment. The essential frequency phase parameters of test Table 2Parameter evaluation outcomes ofx(t)
Real value Approach in [9] Approach in this paper
A 5 4.9404296603° 4.9978567797
θ 40° 40.1024310871° 39.9999999996°
f 50.5 50.5018709238 50.5000000000
signal get fixed with 50.5 Hz and 40°, and two harmonic signal elements with frequency 200 Hz and 300 Hz also get included in the test signal, as Eq. (12).
x tð Þ ¼5 cos 50ð :52πt=fsþ40π=180Þ þ
0:25 cos 200ð 2πt=fsÞ þ1:75 cos 300ð 2πt=fsÞ
ð12Þ
x(t)’s double-window apFFT is given in Fig.7.
Evaluation approaches designed in this paper and paper [9] get applied so as to evaluate the phase angle, frequency, and amplitude of this signal, and estimation results are given in Table2.
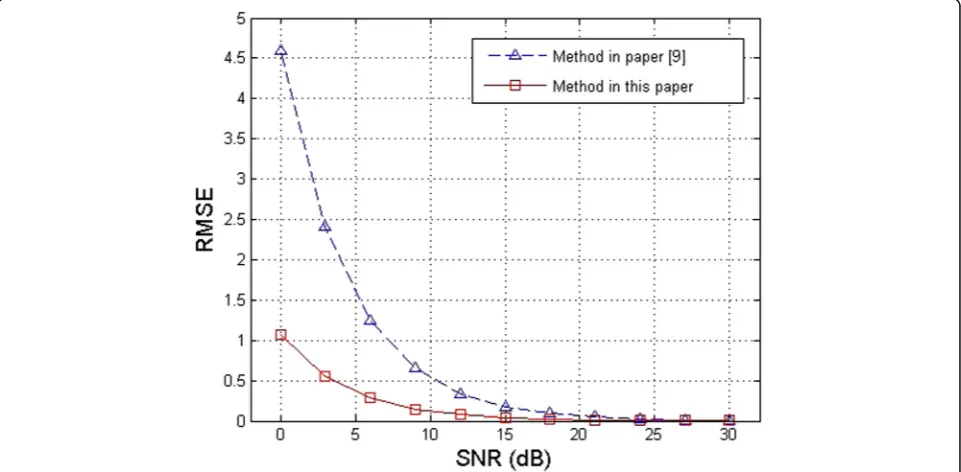
6.2 Experiment 2: Performance of algorithm under noise condition
White Gaussian noise is injected into signal x(t) with signal-to-noise (SNR) 0~30 dB, and the testing flow is repeated. The root mean square error (RMSE) of above two parameter estimation methods is shown in Fig. 8 versus SNR, where the estimation RMSE of frequency, phase angle, and amplitude parameters is defined as follows:
From the simulation outcomes mentioned above and comparison between the DFT and FFT method, the apFFT approach of the paper gets a greater performance in terms of accuracy and noise suppression. The algo-rithm of this paper can gain 7 dB signal-to-noise ratio gain in comparison with the traditional approach.
7 Conclusions
The accomplishment of PMU vector estimation algo-rithm tends to exert direct influence on the dependabil-ity of power system applications, like controlling, measuring, and relay protection. In the paper, one brand-new vector measuring approach for power system is put forward on the basis of all-phase spectrum ana-lysis. In this approach, noticed data do not need to be taken as samples by thoroughly integrated processes, and the spectral leakage and barrier influence get inhib-ited in a significant manner. Simulation outcomes indi-cate that the apFFT approach enjoys a greater property in calculation accuracy and noise controlling than exist-ing approach. There is a possibility that this approach will get widespread applications in ranges of harmonic and vector measurement explanation within power sys-tem automation, enjoying huge value of researching.
Abbreviations
apFFT:All-phase fast Fourier transform; DFT: Discrete Fourier transform; IED: Intelligent Electronic Device; PMU: Phasor measurement unit; RMSE: Root mean square error; SNR: Signal-to-noise ratio
Acknowledgements
There are no other participants in this work except those in the author’s list.
Authors’contributions
PL conceived and created the research, then performed the simulations, and wrote the draft. HF and SZ reviewed and corrected the manuscript. All writers read and approved the final manuscript.
Authors’information
Not applicable.
Funding
The research was supported by the technology program of State Grid Hebei Electric Power Research Institute (No. KJ2017-016).
Availability of data and materials
Data sharing not applicable to this article as no datasets were generated or analyzed during the current study.
Competing interests
The authors declare that they have no competing interests.
Author details 1
State Grid Hebei Electric Power Research Institute, Shijiazhuang 050021, China.2State Grid Information & Telecommunication Branch, Beijing 100053, China.
Received: 16 August 2018 Accepted: 10 June 2019
References
1. A.G. PHADKE, J.S.‘. THORP,Synchronized phasor measurements and their applications(Springer, Berlin, 2008)
2. D. NOVOSEL, V. MADANI, B. BHARGAVA, et al., Dawn of the grid synchronization’. Power and Energy Magazine, IEEE6(1), 49–60 (2008) 3. W.A.N.G. Zengping, Z.H.A.N.G. Jinfang, Q.I.A.N. Cheng, Topology error
identification based on synchronized measurements for power network. Electric Power Automation Equipment32(1), 1–8 (2012)
4. M.E.N.G. Fanchao, D.O.N.G. Xiaoliang, G.A.O. Zhiqiang, et al., Online PSS evaluation based on WAMS/PMU technology. Electric Power Automation Equipment32(10), 146–149 (2012)
5. ZHANG Yingchen, Markham P, XIA Tao, et al.‘Wide area frequency monitoring network (FNET) architecture and applications’. IEEE Trans on Smart Grid, 2010, 1(2): 159-167.
6. D. SHI, T. D J, K.M. Koellner, et al., Transmission line parameter identification using PMU measurements. European Transactions on Electrical Power21(4), 1574–1588 (2011)
7. P. Jafarian, M. Sanaye-Pasand, Weighted least error squares based variable window phasor estimator for distance relaying application. IEE Proceeding Generation, Transmission & Distribution5(3), 298–306 (2011)
8. E. GHAHREMANI, I. KAMWA, Dynamic state estimation in power system by applying the extended Kalman filter with unknown inputs to phasor measurement. IEEE Transactions on Power Systems26(4), 2556–2566 (2011) 9. D. Hart, D. Novosel, Y. Hu, et al., A new frequency tracking and phasor
estimation algorithm for generator protection. IEEE Trans on Power Delivery
12(3), 1064–1073 (1997)
10. C.H.E.N. Mingkai, Z.H.E.N.G. Xiangji, W.A.N.G. Xiaoqiang, et al., A novel algorithm for reducing spectrum leakage based on equal angle-interval sampling principle’Transactions of China Electrotechnical. Society20(8), 94– 98 (2005)
11. M. AKKE, J.S. Thorp, Sample value adjustment improves phasor estimation at off-nominal frequencies. IEEE Transactions on Power Delivery25(4), 2255– 2263 (2010)
13. H.U.A.N.G. Xiangdong, W.A.N.G. Zhaohua, L.U.O. Peng, et al., Discrimination and correction for dense all-phase FFT spectrums. Acta Electronica Sinica
39(1), 172–177 (2011)
14. C.H.E.N. Wei, L.I. Quan, W.A.N.G. Yangui, Object reconstruction of fourier-telescopy based on all-phase spectrum analysis. Acta Optica Sinica30(12), 3441–3446 (2010)
8 Publisher’s Note