R E S E A R C H
Open Access
Modeling the UE-perceived cellular
network performance following a
controller-based approach
Jessica Mendoza
*, David Palacios, Isabel de-la-Bandera, Eduardo Baena, Emil J Khatib and Raquel Barco
Abstract
During the last few years, mobile communication networks have experienced a huge evolution. This evolution culminates with the arrival of the fifth generation (5G) of mobile communication networks. As a result, the complexity of network management tasks has been increasing and the need to use automatic management algorithms has been demonstrated. However, many mobile network operators (MNOs) are reluctant to evaluate these algorithms in their networks. To address this issue, in this paper, a modeling approach is proposed. In this sense, the behavior of a commercial network, as it is perceived by user equipments (UEs), has been replicated in a research testbed using a three-step modeling process. The first step consists on performing a measurement campaign in several external networks. The second step is composed of the measurement campaign result analysis and the classification of the results in different types of scenarios. Finally, the third step is related to the application of a modeling algorithm in a research testbed. In order to perform the last step, the use of a method based on a controller is proposed. The modeling process presented in this paper allows to replicate the network behavior from users located in different areas and with different conditions point of view. Moreover, the use of a testbed environment can help to avoid downtime in commercial networks caused by possible algorithm bugs.
Keywords: Modeling, UE-perceived, Testbed, Measurement campaign, Mobile communication networks
1 Introduction
Mobile communication networks have experienced a large development over the last few years. According to stud-ies conducted by Cisco [1], “Global mobile data traffic was 7% of total IP traffic in 2016 and will be 17% of total IP traffic by 2021”. This growth in traffic will be espe-cially pronounced with the arrival of the fifth generation (5G) of mobile communication networks. In these net-works, an increment in the number of users and offered services is also expected, resulting in an increase in the number of configuration parameters of the networks and possible scenarios. In this context, the development of automatic algorithms that allow the management of net-works in a faster and more efficient way become a pri-ority for mobile network operators (MNOs). However, MNOs are increasingly reluctant to implement in their
*Correspondence:[email protected]
1Department of Communication Engineering, University of Malaga, Andalucía
Tech., 29071 Malaga, Spain
own network algorithms that have not been assessed in prototypes of real networks. The reason is to avoid a possible service degradation due to a suboptimal param-eter configuration change made by a certain algorithm. This problem is getting worse in 5G networks, since in these networks, a reduction of the downtime is sought. Thus, many automatic management network algorithms developed by researchers and tested in simulated envi-ronments are never implemented in real networks. In the cases in which the MNOs decide to assess an algorithm in their own networks, the tests will be carried out in limited areas of the network before extending them to the complete network. This methodology presents some important limitations, since different network areas may behave in a different way and, therefore, the conclusions obtained from a specific area of the network might not be generalizable to the entire network.
To deal with this problem, a modeling approach could be followed. Modeling is the act of representing some-thing. This representation is often mathematical. Thus, in
the literature, there are many works focused on the devel-opment of analytical models that describe the behavior of different types of phenomena. In relation to mobile com-munication networks, in [2] and [3], the authors present analytical models of the behavior of different metrics associated with the quality of experience (QoE) of video services. Download throughput models are proposed in [4] and [5]. In the first case, the authors use neural net-works, whereas in the second case, the authors use linear regression. However, modeling can also be the act of imi-tating the behavior of a specific situation. In mobile com-munication network scope, to the authors’ knowledge, in the literature, there are no other works related to the modeling in this line.
On the other hand, with the aim of satisfying the needs of a growing number of users, the goal of network agement tasks has been changing over time, from man-agement focused on the performance of a certain section of the network (typically the radio access network), such as in [6], to a management that is increasingly closer to the user, and to the user’s perception of the performance or behavior of the network [7], obtaining in this way an end-to-end (E2E) vision of the network behavior.
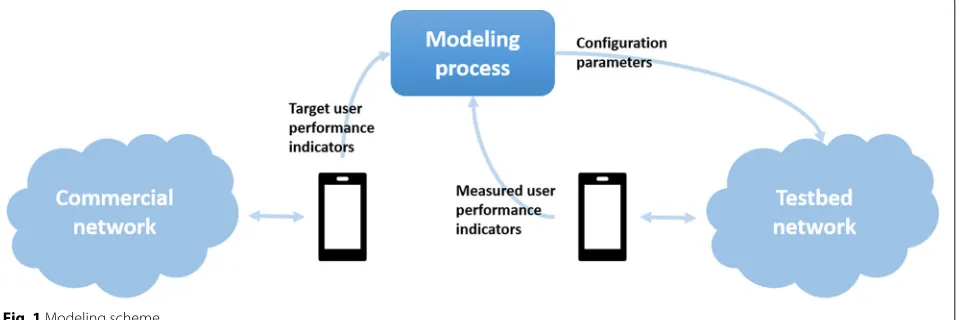
In line with the latter, this paper aims at showing how the behavior of a commercial cellular network could be replicated from a user equipment (UE) point of view by using a research testbed (Fig. 1). In this sense, by the adjustment of the configuration parameters of the testbed network, it is intended to obtain a network equivalent to the commercial one in terms of user perception, that is, to ensure that users connected to the testbed network report the same values of users’ performance indicators (measured user performance indicators in Fig. 1) than the users connected to the commercial network (target user performance indicators in Fig.1), thus providing an environment in which testing automatic management net-work algorithms before their implementation in MNO commercial networks. One of the main advantages of the use of a network model is that different areas, with
different behaviors, could be independently modeled and optimized. In addition, the use of a testbed environment allows detecting possible failures or bugs in the algorithms before being implemented in the real network, avoiding possible configuration failures of the network parameters and the consequent service degradations.
To achieve the global objective, the modeling of a cellu-lar network behavior from a UE perspective, a three-step process is proposed. The first step consists of performing a measurement campaign. For this purpose, similarly to the measurement campaign conducted in [8], experiments have been carried out in commercial networks of some of the main MNOs in Europe. The second step consists in the analysis and classification of the data collected in the measurement campaign, obtaining different behavior pat-terns of the measured networks. The output of the second step is taken as the input to perform the last step. Such step refers to the modeling of a commercial network per-formance from the UE point of view. In order to perform the modeling, a method based on a controller has been used. In particular, the use of the Taguchi method (TM) is proposed, in a similar way to the one proposed in [9], where antenna azimuths and tilts are optimized in order to improve the user throughput. In this paper, the TM controller aims at adjusting the value of specific network configuration parameters depending on the behavior to be replicated that will be represented by user performance indicators.
The rest of the paper is organized as follows. Firstly, the methodology developed in the modeling process is presented, indicating how the design of the mea-surement campaign has been made and providing the main characteristics of the proposed method to carry out the modeling. Secondly, an overview of the testbed network is provided, and the result of the measure-ment campaign, as well as the result of the mod-eling algorithm application are shown. Finally, some conclusions are drawn from the previous study and tests.
2 Modeling methodology
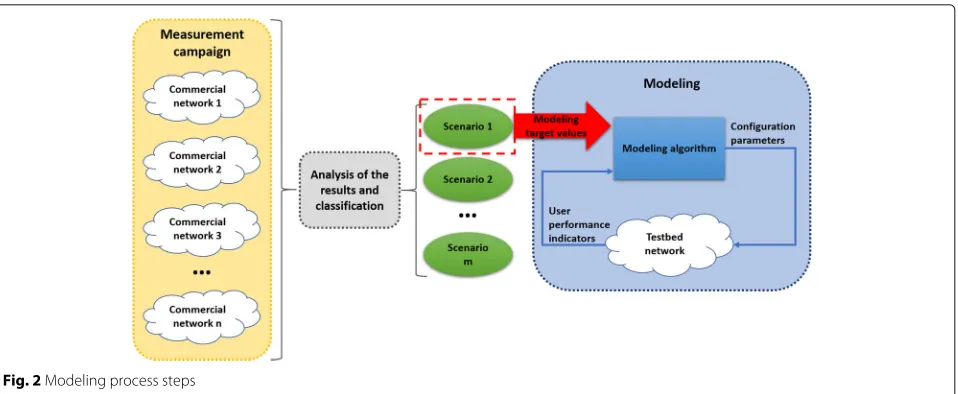
This section presents the modeling process presented in this study. To model the UE perception of a commercial network behavior, a three-step approach is proposed as follows (Fig.2):
• Measurement campaign. This first phase consists in taking measurements in commercial networks behavior as perceived by the UEs. In this sense, the values of some user performance indicators such as user download throughput has been collected.
• Analysis results and classification. By inspecting the resulting measurements, these are grouped, resulting in several scenarios that represent the behavior of the studied networks.
• Modeling. The objective of this task is to obtain a set of configuration parameters, such as the eNodeB transmission power or the bandwidth, to be applied to the testbed network in order to obtain similar user performance indicators that those obtained from measurement campaign for different considered scenarios.
In the next subsections, an overview of the measure-ment campaign motivation and methodology as well as the main characteristics of the algorithm used to perform the modeling is provided.
2.1 Measurement campaign
For a model to be built, a number of observations of the entity to be modeled are needed. These observations will allow extracting the underlying relations among the involved variables as well as providing a general view of the entity behavior and neglecting punctual deviations. In the context of cellular networks, a model may be extracted from its performance indicators, which take different shapes and quantify different aspects of the same system. In particular, performance information is usually gathered from network elements, such as the base stations, as coun-ters, which count the number of times an event occurred, or key performance indicators (KPIs), which are a type of performance measurement computed from the first. Performance information may also be gathered from UEs, either by directly collecting data from radio channel mea-surements (such as reference signal received power, RSRP; or reference signal received quality, RSRQ) or after a com-plex event processing (CEP) phase is applied on signaling messages between the UE and the network.
Counters and KPIs are often collected as aggregate mag-nitudes (not carrying information about specific UEs) within a certain time period; typically, with a time resolu-tion in the order of several minutes. They are periodically stored in databases belonging to the operations support systems (OSS), from which they can be retrieved for
management tasks. These indicators quantify the perfor-mance of a network segment, either the radio access net-work (RAN) or the core netnet-work (CN), and as a result, do not allow MNOs to obtain an E2E vision of the network.
On the other hand, performance information gathered from the UEs is registered with a much higher resolution; in the order of seconds. This information may be retrieved either from the UEs themselves, by means of driving tests with UEs modified ad hoc, or from network elements. This source of performance information provides an E2E vision, allowing MNOs to follow user-centric approaches for management purposes, which is a trend nowadays [10, 11]. This additional information, which is crucial for novel network management, comes at the expense of increased processing and storing needs for MNOs. This is the type of information used to perform the modeling tasks in this paper.
2.2 Taguchi method
TM is one of the most widely used tools in the engineer-ing experiment design scope. TM computes the values that the inputs (called factors or parameters) of a sys-tem should take in order to obtain a specific value on a target response metric. In the mobile network modeling case, these factors will be network configuration param-eters, and the response metric, the UE’s metric selected to perform the modeling. To this end, the method exe-cutes successive iterations until a specified stop criterion is met. In each iteration, a set of experiments with dif-ferent combinations of input factors or parameter values are performed. Each experiment consists on the use of a service by a UE (e.g., file download, video streaming). Experiment results are metrics that can represent the per-formance of the networks in different levels, such as radio, KPI, and key quality indicators (KQI). These metric values depend on the type of service that is being used by the user as well as the service traffic profile. Therefore, modeling results in terms of configuration parameters will depend on the service used to perform the experiments.
For each factor, TM defines a set of levels (possible val-ues of the factors to be tested in each iteration) and an initial range of values (maximum and minimum values that could be adopted during the process).
Fig. 2Modeling process steps
(NTB). Since the modeling purpose is to replicate the behavior of a system, the TM approach that better fits the modeling problem is the NTB.
To obtain the optimal values of the factors, TM uses a metric called signal to noise (SN). The SN metric is computed after each iteration for each factor level. The optimal level of a factor is the one that produces the high-est value of the SN metric. Depending on the objective of the method: STB, LTB, and NTB, the SN metric will be calculated differently. In the NTB case, the SN metric is computed as follows:
SN= −10·log10
μ2
σ2
(1)
whereμis the response metric mean of the experiments performed with a certain factor level andσ is their stan-dard deviation.
Figure3shows the steps to follow during the process. The first step is the selection of an appropriate OA and an objective SN metric that fits the problem. Then, a mapping between the levels of each factor and the real
values of these are made. To this end, it is necessary to define the maximum and minimum values to be tested for each factor. Afterwards, the experiments are carried out and, through the calculation of the SN metric, the com-bination of factors that provide the maximum response metric result is sought. Once the optimum values have been obtained in the iteration, the stop criterion, defined as the difference between two adjacent values of a fac-tor, is checked. If the stop criterion is met, the process is finished; in the opposite case, the maximum and mini-mum values to be tested of each factor are reduced, taking as central value the optimal value in the previous iteration. Then, the mapping between the levels of each factor and the measurements of these, as well as the experiments, is made again.
One limitation of the TM is that only one metric can be used as a response metric. However, in some cases, such as the one presented in this work, the objective of the process (maximize, minimize, or achieve a target value) is defined as a combination of different metrics. Such a situation is called the multi-response problem in TM. An approach to address this limitation is proposed in [13] and is the one
followed in this paper. Specifically, the proposed solution consists of four steps: first, the SN metric is calculated for each response metric and for each combination of factors. Then, the average SN for each response metric and for each factor level and a certain weight is given at each level in relation to the maximum SN calculated for that fac-tor and response. Next, the average weight for each facfac-tor level is calculated, considering the weight obtained in all the responses. Finally, for each factor, the factor level with the highest average weight is taken as the optimum factor level.
3 Proof of concept
In this section, first an overview of the main character-istics of the testbed used to perform the modeling tasks is provided. Then, the results obtained from the three steps that make up the modeling process, explained in the previous section, are presented.
3.1 Testbed description
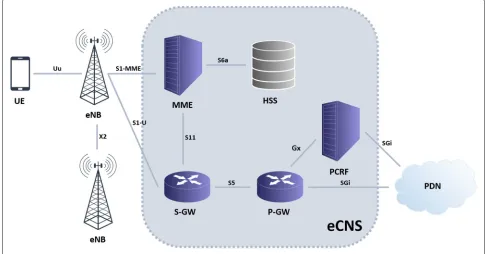
The University of Malaga Heterogeneous Network (UMAHetNet) [14] is a full indoor long-term evolu-tion (LTE) network deployed at the Telecommunicaevolu-tion Engineering School. The RAN consists of 12 base stations in the shape of picocells. The evolved packet core (EPC) is integrated in a single compact equipment, namely, the evolved Core Network Solution (eCNS), which is composed of all core network elements (home subscriber server, HSS; mobility management entity, MME; serving gateway, S-GW; packet data network gateway, P-GW; and
policy and charging rules function, PCRF), as shown in Fig.4. On top of this, UMAHetNet is monitored and coor-dinated by a network management system (NMS), the Huawei solution iManager U2000.
These network elements are interconnected by means of a 24-port Gbit switch providing all the equipment access to the Internet.
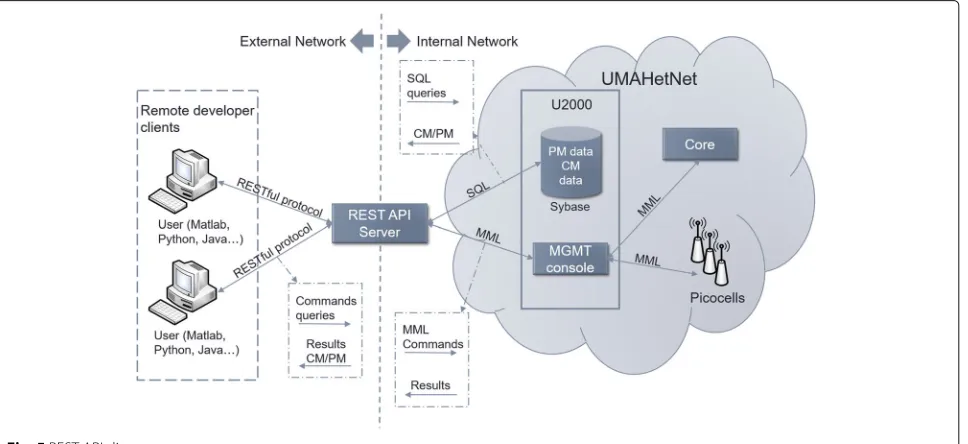
Both the picocells and the eCNS are fully configurable. The picocells can be managed either directly through a local management terminal (LMT) client or by means of the U2000 and eCNS clients. These two latter allow the user to fully customize all the network parameters, as well as to monitor the network status using built-in and user-defined KPIs. Furthermore, this testbed enables the user to integrate his own self-organizing network (SON) applications and algorithms, from self-configuration tech-niques to any self-optimizing and self-healing application. In order to enable the integration of new manage-ment mechanisms into the NMS, as well as to allow other researchers deploy their own management func-tionalities in the testbed, a web service application pro-gramming interface (API) has been developed. Among the different types of web service APIs that exist (simple object access protocol, SOAP, representational state transfer, REST, common object request broker archi-tecture, CORBA, etc.), it has been decided to implement an API of type REST. Whereas SOAP, CORBA, and other remote procedure calls (RPC) aim at defining a communi-cation protocol between the client and the web server [15], REST is a web architecture style that uses the hypertext
transfer protocol (HTTP) in the communication between these two parts. This makes the use of RPC systems more complex and inflexible. Moreover, REST allows the trans-mission of a greater variety of data formats (e.g. plain text, JavaScript object notation, JSON or extensible markup language, XML).
Thus, on the one hand, users communicate with the REST API using a RESTful interface. This interface is accessible using standard hypertext transfer protocol (HTTP) libraries, being easily integrable with algorithms implemented on any programming language for SON functions, monitoring, etc. On the other hand, the REST API will traduce users’ HTTP queries in (a) man-machine language (MML) commands that allow users to perform both RAN and CN configuration parameters changes and (b) structured query language (SQL) queries that allow users to consult network configuration parameters as well as performance indicators. In Fig. 5, a diagram of the REST API is shown.
In UMAHetNet, UEs are Linux-based devices, which are connected to the UMA picocells and which gather user’s measured performance indicators. Specifically, UEs are MONROE nodes, which are further described in [16]. The MONROE project aims at establishing a collabo-ration framework for European researchers in the field of mobile broadband (MBB) communications. To that end, the project allows each partner to execute MBB-related experiments in another partner’s facilities, so that information from several cellular commercial networks can be gathered and compared [17]. The experiments as well as the data collection are performed by MON-ROE nodes, which are permanently connected to the
partner’s facilities. To manage the execution of experi-ments, a platform has been developed in the scope of this project [18].
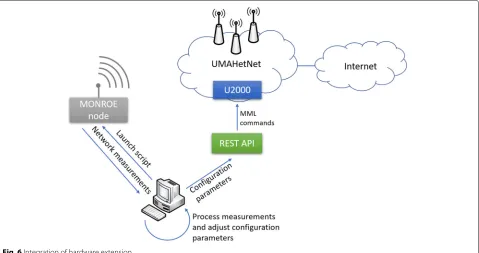
Figure 6 shows the hardware structure used to per-form the modeling in the UMAHetNet and the con-nections between its elements. This structure consists in a management device, a MONROE node and the UMAHetNet itself. The intelligent of the system is cen-tralized in the management device (a computer, in this case). On the one hand, this element communicates with the MONROE node through a secure shell (SSH) con-nection. The management device sends commands to the MONROE node to perform a certain experiment and to retrieve the resulting performance measurements col-lected by the node during the experiments. The results of the experiments are processed by the management device, which will decide the adjustment to be made in the net-work configuration parameters. On the other hand, the management device communicates with the UMAHetNet through the REST API described above. The manage-ment device send to the REST API the new values of the configuration parameters, and the REST API transforms the request of the management device in MML com-mands and sends them to the UMAHetNet to make the configuration changes.
3.2 Results
In this subsection, the results of the different tasks of the modeling process are shown, which are the measurement campaign, the subsequent data analysis and classifica-tion, and the use of the modeling algorithm. To carry out the experiments related to the measurement campaign
Fig. 6Integration of hardware extension
and the modeling steps, a file transfer service has been selected. File transfer service is the base of most of the services demanded by UEs, especially in the MBB service category, which carries most of the cellular traffic nowa-days [19] and whose most relevant performance indicator is throughput.
3.2.1 Measurement campaign
In order to validate the model of the network perfor-mance, a measurement campaign has been devised. The measurement campaign aims at obtaining a set of measurements of the UE perception of the behavior of commercial networks. These measurements will be processed and taken as the target value of the modeling algorithm. To have a broader view of the commercial net-works’ behavior, different networks of some of the main European MNOs (Yoigo, Vodafone, Orange, Telia, Telenor, and TIM) have been studied. As said before, the service used for the campaign is file transfer service. By means of a battery of tests in which files of different sizes have been proved (100MB, 50MB, 10MB, 1MB, and 0.5MB), it has been determined that the optimal file size for the measurements is 1MB, achieving a tradeoff between the time to perform a complete download and the statistical significance of the results.
The measurement campaign has been performed using the MONROE platform (see Section3.1) to manage the experiments and download the results and the MONROE nodes connected to MNOs networks to execute the exper-iments and gather UE metrics. The UE metrics used in
this paper are collected by the nodes in two different ways. On the one hand, the nodes have installed the cURL tool [20] that provides metrics such as the setup time, the total download time, and the average achieved through-put. On the other hand, the metadata of the nodes, related to the radio signal, are collected during the execution of the experiments by means of the LTE modem avail-able at MONROE nodes: a ZeroMQ socket. These data are the RSRP, the RSRQ, and the received signal strength indicator (RSSI).
3.2.2 Data analysis and classification of scenarios
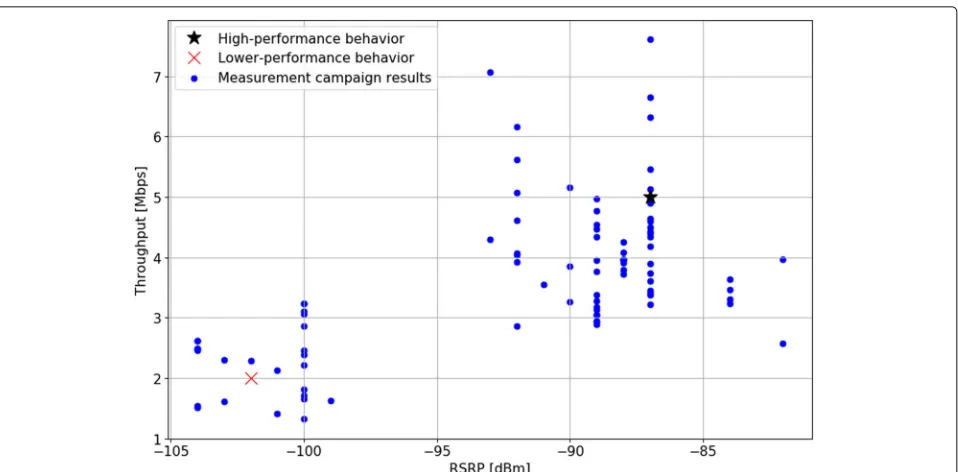
The metrics chosen to model an external commercial net-work are the RSRP (in dBm) and the file transfer protocol (FTP) user throughput, averaged along the duration of each experiment. Figure7shows these metrics with a scat-ter plot, where two well differentiated behaviors can be seen. The left group of samples stands for low values of RSRP, and consequently, low throughput values. These samples may have been gathered from nodes experienc-ing low-signal quality, possibly due to high propagation losses or interferences. The right group, however, presents higher values of RSRP and throughput. Thus, two behav-iors may be distinguished, each one representing one of the groups of samples:
Fig. 7Classification of measurement campaign results. Centroids representing the average behavior of each cluster are represented with a red cross (low-performance behavior) and a black star (high-performance behavior)
2. High-performance behavior. This behavior may be characterized by an average RSRP of – 87 dBm and an average throughput of 5 Mbps.
3.2.3 Modeling algorithm application
The modeling algorithm application step have been car-ried out in the UMAHetNet network. The file size used in the file transfer service is 1 MB as in the measure-ment campaign. The scenario in which the modeling have been performed consists of two terminals: a MONROE node and a smartphone, each one connected to a different picocell. The picocell in which the MONROE node is con-nected is considered as the serving cell and the other one as the interfering cell. As said before, in this case, the met-rics selected to model an external commercial network behavior are the RSRP and the UE throughput. These measurements are provided by the MONROE node as the results of the experiments. The configuration parameters that will be modified to achieve the target behavior (the input factors of TM algorithm) are the transmission power of the serving and the interfering cell, and the serving cell available bandwidth. For each configuration param-eter, three levels are defined. The OA used to perform the modeling, which depends on the number of factors as well as the levels of each factors, can be found in [21]. Finally, the TM stop criterion is set to 0.2 since with this value a tradeoff between modeling accuracy and process-ing time is achieved. The main configuration parameters of the UMAHetNet are summarized in Table1.
Due to the fact that most of the samples obtained in the measurement campaign belong to the second of the sce-narios identified in Section3.2.2, this scenario has been selected for modeling. Thus, the target values of through-put and RSRP are 5 Mbps and – 87 dBm, respectively.
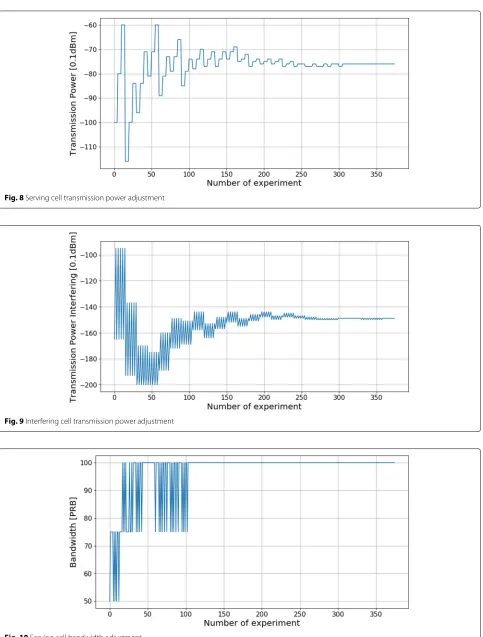
Figures 8, 9, 10, 11, and 12show the results of the network modeling. In Figs. 8 to 10, the convergence of the configuration parameters (serving cell transmission power, interfering cell transmission power, and serving cell available bandwidth, respectively) is depicted. In these figures, it can be seen how, in each iteration, the TM con-troller is reducing the search range, focusing on those
Table 1Configuration of the UMAHetNet
Scenario 2 UEs. Each one connected to a
different picocell
System bandwidth 5, 10, 15 and 20 MHz
Serving cell transmission power – 4 to – 12 dBm
Interfering cell transmission power – 6 to – 20 dBm
Mobility Static user
Transmission direction Download
Service File transfer service (file size: 1MB)
e-NodeB (picocell) Omnidirectional antennas. MIMO
Scheduler Enhanced proportional fair
Fig. 8Serving cell transmission power adjustment
Fig. 9Interfering cell transmission power adjustment
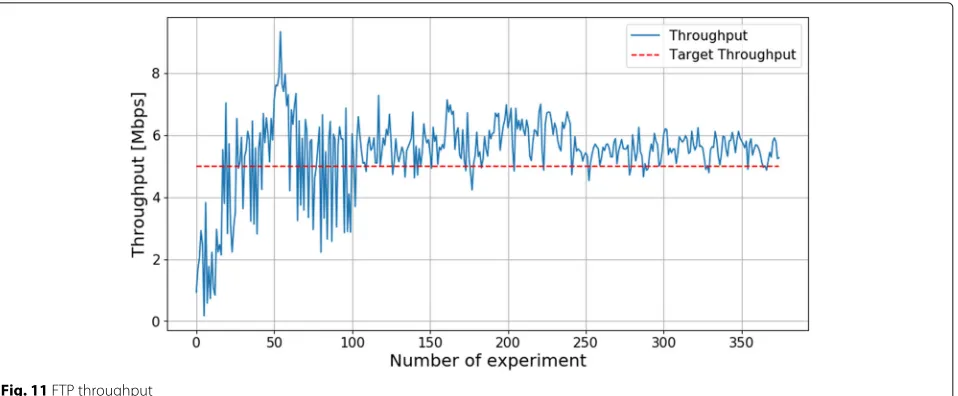
Fig. 11FTP throughput
values of the configuration parameters for which the throughput and RSRP obtained in the simulations are closer to the target values. Finally, the values of configura-tion parameters, for which the target values of throughput and RSRP are achieved are in the serving cell transmission power case, – 7.6 dBm; in the interfering cell transmission power case – 14.9 dBm, and in the serving cell, the avail-able bandwidth is 100 physical resource blocks (PRBs) (20 MHz).
Figures11and12show the resulting values of through-put and RSRP obtained in each experiment (represented in blue) as well as the target values of these metrics (rep-resented in red). It can be observed how the values of throughput and RSRP resulting from the successive exper-iments get closer to the throughput and RSRP target values along the iterations. So, as a result of the modeling
process, specific values for the different considered con-figuration parameters, with which the target values of the measured user performance indicators are achieved, are obtained.
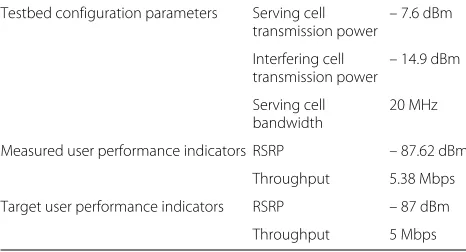
On the one hand, in Table 2, the results of the mod-eling process proposed in this paper are shown (testbed configuration parameters). As it is explained before, these values are the ones that should be use in the testbed network in order to achieve the target values of user per-formance indicators. On the other hand, the final values obtained during the modeling process for the user per-formance indicators: RSRP and throughput and the target values of these indicators are also listed in Table2. Results obtained for the modeling process has been computed as the mean values of the indicators once the TM has con-verged. Regarding these results, it can be appreciated in a
Table 2Summary of the target values and the results obtained
Testbed configuration parameters Serving cell transmission power
Measured user performance indicators RSRP – 87.62 dBm
Throughput 5.38 Mbps
Target user performance indicators RSRP – 87 dBm
Throughput 5 Mbps
quantitative manner, that the final user performance indi-cators values are very close to the target ones. The final values of RSRP and throughput achieved in the model-ing process are – 87.62 dBm and 5.38 Mbps, respectively, while the target values are – 87 dBm and 5 Mbps.
4 Conclusion
New management network algorithms developed by researchers are rarely tested on commercial networks due to the reluctance of most MNOs. To deal with this prob-lem, in this paper, the modeling of the UE perception of a commercial network performance using a testbed network is proposed. Firstly, a measurement campaign has been developed. To this end, several user perfor-mance indicators have been measured in different types of scenarios in commercial networks of several European operators. Secondly, by analyzing the results of the mea-surement campaign, it has been possible to differentiate two groups that represent the behavior of the studied net-works. Finally, taking one of the previous groups as input, the modeling over a testbed network has been carried out using a TM controller. This method can be used by oper-ators to have a preliminary assessment of the effects of a certain optimization action over their network, without actually interrupting or affecting services. It can also be used by researchers to draw better conclusions on how their algorithms will behave in a commercial network; as well as debug them for different scenarios.
As future work, the development of a more complex commercial network model is proposed. In particular, a wider range of user performance indicators will be consid-ered, so that the different services could be better repre-sented. New scenarios will also be considered to allow the modeling of wider range of behaviors that can be found in a commercial network with UMAHetNet. Finally, the use of new configuration parameters will be considered, to be able to model the more complex scenarios discussed above.
Abbreviations
5G: 5th generation; API: Application programing interface; CEP: Complex event processing; CN: Core network; CORBA: Common object request broker
architecture; E2E: End-to-end; eCNS: Evolved Core Network Solution; EPC: Evolved packet core; FTP: File transfer protocol; HSS: Home subscriber server; HTTP: Hypertext transfer protocol; JSON: JavaScript object notation; KPI: Key performance indicator; KQI: Key quality indicator; LMT: Local management terminal; LTB: The larger-the-better; LTE: Long-Term Evolution; MBB: Mobile broadband; MME: Mobility management entity; MML: Man-machine language; MNO: Mobile network operator; NMS: Network management system; NTB: The nominal-the-better; OA: Orthogonal array; OSS: Operations support system; P-GW: Packet data network gateway; PCRF: Policy and charging rules function; PRB: Physical resource block; QoE: Quality of experience; RAN: Radio access network; REST: Representational state transfer; RPC: Remote procedure calls; RSRP: Reference signal received power; RSRQ: Reference signal received quality; RSSI: Received signal strength indicator; S-GW: Serving gateway; SN: Signal to noise; SOAP: Simple object access protocol; SON: Self-organizing network; SQL: Structured query language; SSH: Secure shell; STB: The smaller-the-better; TM: Taguchi method; TTI: Time transmission interval; UE: User equipment; UMAHetNet: University of Malaga Heterogeneous Network; ¸SXML: Extensible markup language
Acknowledgements
Not applicable.
Authors’ contributions
EB designed and performed the measurement campaign. JMR, DP, and IB analyzed the measurement campaign results and performed the modeling tasks. JMR and EJK developed the API REST used in this work. JMR and EB designed and implemented the hardware structure used to perform the modeling tasks in the UMAHetNet. JMR was the major contributor in writing the manuscript. RB was the responsible of supervise all tasks and for the funding acquisition. All authors read and approved the final manuscript.
Funding
This work has been partially funded by the European Union’s Horizon 2020 research and innovation program under both the grant agreement No. 644399 (MONROE) through a second open call project (eSON) and the project ONE5G (ICT-760809), the Junta de Andalucía (Research Project of Excellence P12-TIC-2905), and the Spanish Ministry of Economy and Competitiveness (project TEC2015-69982-R). The authors would like to acknowledge the contributions of their colleagues in the project, although the views expressed in this contribution are those of the authors and do not necessarily represent the project.
Availability of data and materials
The network behavior data used to support the findings of this study are available from the corresponding author upon request.
Competing interests
The authors declare that they have no competing interests.
Received: 26 July 2019 Accepted: 6 November 2019
References
1. Cisco, Cisco Visual Networking Index: Global Mobile Data Traffic Forecast Update, 2016-2021 (2017).https://www.cisco.com/c/en/us/solutions/ collateral/service-provider/visualnetworking-index-vni/complete-white-paper-c11-481360.html. Accessed Dec 20 2018
2. Z. Xiao, Y. Xu, H. Feng, T. Yang, B. Hu, Y. Zhou, in2015 IEEE Global Communications Conference (GLOBECOM). Modeling streaming QoE in wireless networks with large-scale measurement of user behavior, (2015), pp. 1–6.https://doi.org/10.1109/GLOCOM.2015.7417690
3. X. Zhang, Y. Xu, H. Hu, Y. Liu, Z. Guo, Y. Wang, Modeling and analysis of Skype video calls: rate control and video quality. IEEE Trans Multimed.
15(6), 1446–57 (2013).https://doi.org/10.1109/TMM.2013.2247988 4. T. Rehman, M. A. I. Baig, A. Ahmad, in2017 IEEE 8th Annual Ubiquitous
Computing, Electronics and Mobile Communication Conference (UEMCON). LTE downlink throughput modeling using neural networks, (2017), pp. 265–70.https://doi.org/10.1109/UEMCON.2017.8249044
throughput of LTE networks, (2014), pp. 623–8.https://doi.org/10.1109/ LCNW.2014.6927712
6. P. Muñoz, R. Barco, I. de la Bandera, Load balancing and handover joint optimization in LTE networks using fuzzy logic and reinforcement learning. Comput. Netw.76, 112–25 (2015)
7. 5G Infrastructure PPP Association and others, 5G Vision - The 5G Infrastructure Public Private Partnership: the next generation of communication networks and services (2015)
8. F. Mah-Rukh, K. Kousias, A. Lutu, M. Rajiullah, Ö. Alay, A. Brunström, A. Argyriou, in11th Workshop Wireless Network Testbeds, Expeimental Evaluation & Characterization. FLEX-MONROE: aunified platform for experiments under controlled and operational LTE settings, (2017), pp. 1–8.https://doi.org/10.1145/3131473.3131477
9. A. Awada, B. Wegmann, I. Viering, A. Klein, in2011 IEEE 73rd Vehicular Technology Conference (VTC Spring). A joint optimization of antenna parameters in a cellular network using Taguchi’s method, (2011), pp. 1–5. https://doi.org/10.1109/VETECS.2011.5956217
10. A. Gómez-Andrades, R. Barco, I. Serrano, P. Delgado, P. Caro-Oliver, P. Muñoz, Automatic root cause analysis based on traces for LTE self-organizing networks. IEEE Wirel. Commun.23(3), 20–28 (2016). https://doi.org/10.1109/MWC.2016.7498071
11. V. Buenestado, M. Toril, S. Luna-Ramírez, J. M. Ruiz-Avilés, A. Mendo, Self-tuning of remote electrical tilts based on call traces for coverage and capacity optimization in LTE. IEEE Trans. Vehicular Technol.66(5), 4315–4326 (2017).https://doi.org/10.1109/TVT.2016.2605380 12. G. Taguchi,Taguchi Methods. Research and Development, 1st Edition.
(American Supplier Institute, S. Konishi, eds.) (Taguchi Methods Series, 1993)
13. A. Al-Refaie, T.-H. Wu, M.-H. Li, An effective approach for solving the multi-response problem in Taguchi method. Jordan J. Mech. Industr. Engineer.4(2), 314–23 (2010)
14. S. Fortes, S.-R. J. Antonio, D. Palacios, E. Baena, R. Mora-García, M. Medina, P. Mora, R. Barco, The Campus as a Smart City: University of Málaga environmental, learning, and research approaches. Sensors.19(6) (2019). https://doi.org/10.3390/s19061349
15. J. Tihomirovs, J. Grabis, Comparison of SOAP and REST based web services using software evaluation metrics. Information Technology and Management Science.19(1), 92–97 (2016)
16. M. Peón-Quirós, T. Hirsch, S. Alfredsson, J. Karlsson, A. S. Khatouni, Ö. Alay, Deliverable D1.3 Final Implementation.https://www.monroe-project.eu/ resources/projectdeliverables/. Accessed Nov 3 2018
17. MONROE Measuring Mobile Broadband Networks in Europe.https:// www.monroe-project.eu/. Accessed Feb 8 2019
18. Ö. Alay, A. Lutu, M. Peón-Quirós, V. Mancuso, T. Hirsch, K. Evensen, A. Hansen, S. Alfredsson, J. Karlsson, A. Brunström, A. Safari Khatouni, M. Mellia, M. A. Marsan, inProceedings of the 23rd Annual International Conference on Mobile Computing and Networking. Experience: an open platform for experimentation with commercial mobile broadband networks (ACM, New York, 2017), pp. 70–80.http://doi.acm.org/10.1145/ 3117811.3117812.https://doi.org/10.1145/3117811.3117812
19. Ericsosn, Ericsson Mobility Report (2018).https://www.ericsson.com/ 491e34/assets/local/mobilityreport/documents/2018/ericsson-mobility-report-november-2018.pdf. Accessed Dec 20 2018
20. D. Stenberg,Everything curl, (2018).https://curl.haxx.se/book.html. Accessed Apr 22 2018
21. N. J. A. Sloane, A library of orthogonal arrays.http://neilsloane.com/oadir/. Accessed Jul 18 2018
Publisher’s Note