© 2019, IRJET | Impact Factor value: 7.211 | ISO 9001:2008 Certified Journal | Page 4399
CKD Prediction Using Data Mining Technique As SVM And KNN With
Pycharm
Amruta Rajeev Shetty
1, Fouziya Basheer Ahmed
2, Veena Madev Naik
3Anjuman Institute of Technology and Management ,Bhatkal Under the guidance of
Taufique Ahmed and Rizwan Shaikh
(Professor of Computer Science and Engineering department AITM,Bhatkal)
---***---Abstract -
Chronic kidney disease (CKD) is one of thecommon reasons for death around the world nowadays. The term “chronic kidney disease” means lasting damage to the kidneys that can get worse over time. If the damage is very bad, then kidney may stop working. This is called kidney failure, or end-stage renal disease (ESRD).The prediction of CKD is one of the most important and challenging issues in healthcare analytics. In this paper we employ some data mining techniques for predicting the chronic kidney disease using clinical data. We use two data mining techniques as
support vector machine (SVM),K-nearest
neighbor(KNN).The performance of the above models are compared with each other to in order to select the best classifier among them to predicting the CKD for given
dataset.
Key Words: Data mining; SVM, KNN, CKD, PyCharm
1. INTRODUCTION
Amount of data in the medical field is increases day by day. It is really challengeable task to handle this large amount of data and extract them to get productive information for effective decision making. That’s why medical industry come up with new solution as applying data mining techniques which will provide fruitful decision from vast database. This data mining technique is useful to solve a various real world problems. However, health care industry is one of the field providing largest amount of data collected using different clinical reports and patient history’s.
The goal is to develop an application that can predict whether a person would be diagnosed with chronic kidney disease or not in future by given some health parameters of the person. This involved
collecting large datasets of medical records pertaining to various individuals who were diagnosed with CKD or not having. These all dataset available in machine learning UCI laboratory. With this dataset Machine learning was trained and tested, that could predict the probability of a person could likely to be having a CKD or not regarding some current parameters of health.
2. LITERATURE REVIEWS
Researchers have conducted numerous studies related to CKD using different data mining techniques in recent years. Chronic kidney disease has become a global health issue and it’s an area of concern. It’s a condition where kidney’s become damaged and cannot filter toxic wastes in the body. Our work predominantly focuses on predicting life threatening disease like chronic kidney disease (CKD) using classification algorithm as Support Vector Machine and K-Nearest Neighbor (KNN).
© 2019, IRJET | Impact Factor value: 7.211 | ISO 9001:2008 Certified Journal | Page 4400 involves grouping of objects of similar kinds together
in a group or cluster. Some of its techniques include K-means,Kmedoids, agglomerative, divisive, DBSCAN etc. Association states the probability of occurrence of items in a set.
S.N Author Year disease techniques
1 Vijayarani S
2015 kidney SVM & ANN
2 Ravindra B
2014 kidney K-means
3 Laxmi kr 2016 kidney DT & ANN
4 Chiu K R 2012 kidney KNN
[image:2.595.308.521.96.220.2] [image:2.595.30.275.180.400.2]5 Ahmed S 2014 kidney Fuzzy logic
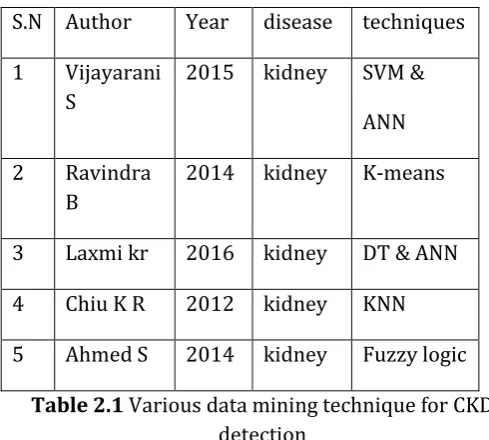
Table 2.1 Various data mining technique for CKD detection
Table 2.1 describes about various data mining techniques used for investigating kidney diseases.
Fig 2.2 Data mining techniques for detecting the diseases
Figure 2.2 shows a potential use of data mining techniques like clustering, classification which includes DT, Naive Bayes, Neural Network, SVM, KNN etc.
Fig 2.1 Classification technique for detecting the kidney disease
It has been observed that classification algorithms have widely been used for identifying and investigating kidney disease. Figure 2.1 shows that many research work has been conducted using SVM,KNN,NB and ANN.The performance of SVM has also been compared with KNN algorithm.
Now we will reviews about classification techniques and the prediction of kidney disease. The SVM (Support Vector Machine) it’s an classification technique used to predicting the CKD. The main objective of this research work is to find the best classification algorithm on the basis of classification accuracy and minimum execution time performance factors.
The SVM concept works on the principle that using the hyperplane the data points are classified that maximize the separation between data points and the hyperplane which is constructed using support vectors.
Fig 2.3 SVM classification
[image:2.595.39.259.453.576.2] [image:2.595.345.553.585.694.2]© 2019, IRJET | Impact Factor value: 7.211 | ISO 9001:2008 Certified Journal | Page 4401 classification.SVM which includes use of various
machine learning techniques applied on irregular as well as unbalanced kidney dataset, such as support vector machine classification and feature selection methods.
[image:3.595.58.267.251.360.2]SVM algorithms use a set of mathematical functions that are defined as the kernel. The function of kernel is to take data as input and transform it into the required form.
Fig 2.4 KNN classifier
K-NN, abbreviated as K-nearest neighbor is a classification algorithm which is subset of supervised learning.Performed metabolic investigation in patients with nephrolithiasis. For knowledge extraction in the form of decision rules, various data mining techniques such as clustering and classification were employed. The results find out morbidity risk and disease recurrence risk. In the research, it was found that SVM performed as the better classifier as compare to KNN.
3. METHODOLOGY
Data Mining is one of the most significant stages of the Knowledge Data Discovery process. The process involves data collection from various sources with preprocessing of the chosen data. The data is then transformed into suitable format for further processing. Data mining technique is applied on the data to extract valuable information and evaluation is done at the end.
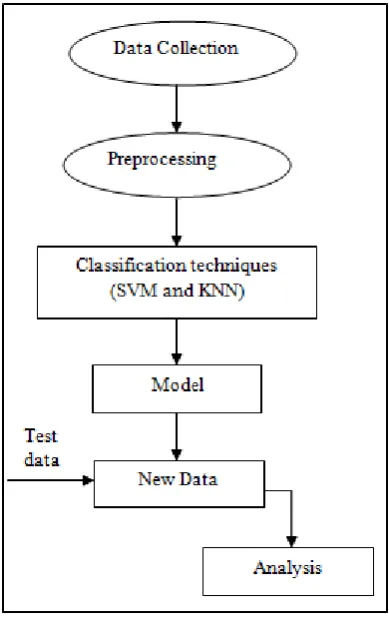
Fig 2.3 shows work flow of the CKD predictor as described below.
Data collection is the process of gathering and measuring data, information or any variables of
interest in a standardized and established manner that enables the collector to answer or test hypothesis and evaluate outcomes of the particular collection.
Data preprocessing is a data mining technique that
involves transforming raw data into an
[image:3.595.337.532.283.597.2]understandable format. Real-world data is often incomplete, inconsistent, and/or lacking in certain behaviors or trends, and is likely to contain many errors. Data preprocessing is a proven method of resolving such issues.
Fig 3.1 Flow chart showing CKD
© 2019, IRJET | Impact Factor value: 7.211 | ISO 9001:2008 Certified Journal | Page 4402 attributes include specific gravity, albumin, sugar,
RBC, pus cell, pus cell clumps, bacteria, hypertension, diabetes mellitus, coronary artery disease, appetite, pedal edema, anemia and class.
Number of Instances: 400 Number of Attributes: 25 Class: {CKD, NOTCKD}
Missing Attribute Values: yes
Class Distribution: [63% for CKD] and [37% for NOTCKD].
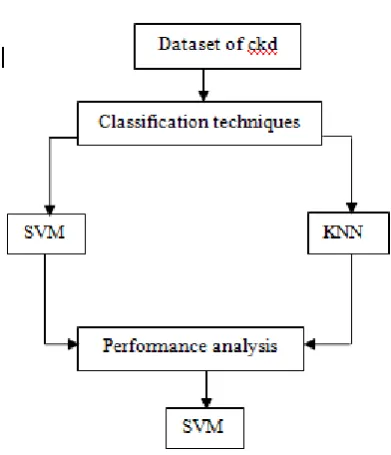
B. Proposed System
The working of the architecture is as follows: The dataset for CKD patients have been collected and fed into the classifier named SVM and KNN. The prediction of CKD will be executed with the help of a IDE known as Pycharm. In this paper, the dataset is collected from UCI machine learning repository, as the input for prediction. The dataset consists of attributes and values. This tool will results the accuracy that how many patients are having the chronic kidney disease with in a particular time. In order to improve the rate of prediction, comparison of the two classifiers is done based on evaluation parameters. The experimental result is retrieved, which shows the best classifier between the two. C. Evaluation parameters Some of the data mining parameters are:
i. Sensitivity It is also called True Positive Rate. It is used for measuring the percentage of unwell people from the dataset. Sensitivity = Number of true positives/Number of true positives + Number of false negatives.
ii. Specificity It is also called True Negative Rate. It measures the percentage of healthy people that are exactly recognized from the dataset.
[image:4.595.334.530.97.325.2]Specificity = Number of true negatives/Number of true negatives + Number of false positives.
Fig 3.2 Proposed approach
iii. Precision and recall It is also called positive predictive value. It is defined as the average probability of relevant retrieval.
Precision = Number of true positives/Number of true positives + Falsepositives Recall It is defined as the average probability of complete retrieval. Recall= True positives/True positives + False negative.
iv. Accuracy is defined in terms of correctly classified instances divided by the total number of instances present in the dataset. Accuracy=Number of correctly classified samples/Total number of samples.
v. Confusion Matrix It displays the number of correct and incorrect predictions made by the model compared with the actual classifications in the test data. The matrix is represented in the form of n-by-n, where n is the number of classes. The accuracy of each classification algorithms can be calculated from that.
D. Data mining classification techniques
© 2019, IRJET | Impact Factor value: 7.211 | ISO 9001:2008 Certified Journal | Page 4403 classification. The advantage of the SVM is that, by
use of the so-called ‘‘kernel trick’’, the distance between a molecule and the hyper plane can be calculated in a transformed (nonlinear) feature space, lacking of the explicit transformation of the original descriptors. The radial basis function kernel (Gaussian kernel) which is the most commonly used was applied to this study.
2. K-nearest neighbor Classification In pattern recognition, the K-Nearest Neighbor algorithm (K-NN) is a non-parametric method used for classification and regression. In both cases, the input consists of the K closest training examples in the feature space.
K-NN is a type of instance-based learning. In KNN Classification, the output is a class membership. Classification is done by a majority vote of neighbours. If K = 1, then the class is single nearest neighbor. In a common weighting scheme, individual neighbour is assigned to a weight of 1/d if d is the distance to the neighbour.
The shortest distance between any two neighbours is always a straight line and the distance is known as Euclidean distance. The limitation of the K-NN algorithm is it’s sensitive to the local configuration of the data.
[image:5.595.325.543.497.629.2]The steps involved in a K-NN algorithm:
Fig 3.3 Work flow of KNN
4. RESULT AND ANALYSIS
This work is performed in Pycharm IDE, developed by Data mining classification technique as SVM and KNN. Pycharm allows matrix manipulations, plotting of functions and data, implementation of algorithms, creation of user interfaces, and interfacing with programs written in other languages like html, css. The experimental comparison of KNN and SVM are done based on the performance measures of classification accuracy and precision.
Datasets and preprocessing The datasets are extracted from UCI Machine learning repository benchmarks. The UCI Machine Learning Repository is a collection of databases, domain theories, and data generators that are used by the machine learning community for the empirical analysis of machine learning algorithms. The archive was created as an ftp archive in 1987 by David Aha and fellow graduate students at UC Irvine. Since that time, it has been widely used by students, educators, and researchers all over the world as a primary source of machine learning data sets.
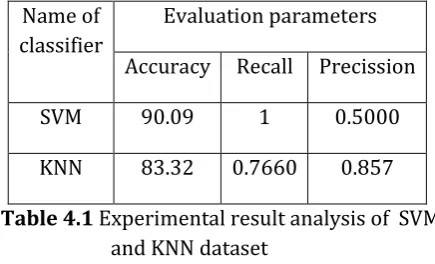
The table below shows the experimental result analysis of SVM & KNN on CKD dataset:
Name of classifier
Evaluation parameters
Accuracy Recall Precission
SVM 90.09 1 0.5000
KNN 83.32 0.7660 0.857
Table 4.1 Experimental result analysis of SVM and KNN dataset
5. CONCLUSIONS
© 2019, IRJET | Impact Factor value: 7.211 | ISO 9001:2008 Certified Journal | Page 4404 comparative study of their performance is done.
From the analysis we found that, out of two classifiers SVM and KNN, SVM classifier performed better than the KNN. The rate of prediction of CKD is improved.
6. ACKNOWLEDGEMENT
We consider it as a privilage to articulate a few words of gratitude and respect to all those deserving individuals who guided us in this project .First and foremost ,we would like to extend our profound gratitude and sincere thanks to our guide Prof.Taufique Ahmed and Rizwan Shaikh, Department of computer science and Engineering, AITM Bhatkal. Who constantly supported and Encouraged us during every step of dissertation .We really feel highly indebted to them for constantly guiding us to continue our work and giving us short term goals.
We are thankful to our project co-coordinator prof. S G Bhagwat and our HOD prof.Anil Kadle Department of Computer Science and Engineering ,AITM,Bhatkal for their immense support.
We take this opportunity to thank Dr.M.A Bhavikatti Principal, AITM Bhatkal for us encouragement and useful suggestions to pursue this work.
7. REFERENCES
[1] Vijayarani, S., & Dhayanand, M. S. kidney disease prediction using svm and ann algorithms.
[2] Ravindra, B. V., Sriraam, N., & Geetha, M. (2014, November). Discovery of significant parameters in kidney dialysis data sets by Kmeans algorithm. In Circuits, Communication, Control and Computing (I4C), 2014 International Conference on (pp. 452-454). IEEE.
[3] Lakshmi, K. R., Nagesh, Y., & VeeraKrishna, M. (2014). Performance Comparison of Three Data Mining Techniques for Predicting Kidney Dialysis Survivability. International Journal of Advances in Engineering & Technology (IJAET), 7(1), 242-254.
[4] Chiu, R. K., Chen, R. Y., Wang, S. A., & Jian, S. J. (2012, July). Intelligent systems on the cloud for the
early detection of chronic kidney disease. In Machine Learning and Cybernetics (ICMLC), 2012 International Conference on(Vol. 5, pp. 1737-1742). IEEE.
[5]Ahmed, S.,Tanzir Kabir, M.,Tanzeem Mahmood, N.,& Rahman,R. M. (2014, December).Diagnosis of kidney disease using fuzzy expert system. InSoftware,Knowledge,Information Management and Applications (SKIMA), 2014 8th International Conference on (pp. 1-8). IEEE.
© 2019, IRJET | Impact Factor value: 7.211 | ISO 9001:2008 Certified Journal | Page 4405 BIOGRAPHIES
Amruta Rajeev Shetty Department of computer science And Engineering,
Anjuman Institute of Technology And Management,Bhatkal
Fouziya Basheer Ahmed Department of computer science And Engineering,
Anjuman Institute of Technology And Management,Bhatkal
Veena Madev Naik Department of computer science And Engineering,