IJPAR |Vol.5 | Issue 4 | Oct - Dec - 2016 Journal Home page: www.ijpar.com
Research article Open Access
Blend uniformity validation in low dose formulation of levocetirizine
hydrochloride tablet
K. Kathiresan
Assistant Professor, Department of Pharmacy, Annamalai University
*Corresponding Author: K. KathiresanABSTRACT
One of the most challenging problems conformations oral solid dosage form manufacturers today is the difficulty in applying scientifically valid methods to blend uniformity validation. Validation of final blending process, as one of a series of unit operations, is important to ensure satisfactory active ingredient content in a tablet, in particular, in low dose formulations. Routine final blend evaluation for active ingredient homogeneity is unwarranted, although it may be appropriate in certain circumstances. However, the final product (e.g. tablets, capsules) is required to be tested for the uniformity of dosage units to meet the Pharmacopoeia requirements. In this work, the blend uniformity is validated in a low dose tablet formulation to the predetermined protocols as part of concurrent process validation. The selected product is Levocetirizine Hcl (Each tablet contains Levocetirizine Hcl 5 mg).The test for content uniformity is applicable to this product as per requirement of BP / USP / IP, hence the study is conducted to assure the compliance to official requirements of content uniformity in the product by demonstrating adequate blend uniformity during the mixing operation.
Keywords:
Levocetirizine hydrochloride, Validation, Determination, Blend uniformity, UV spectrophotometer.INTRODUCTION
Levocetirizine is a third-generation non-sedative antihistamine, developed from the second-generation antihistamine cetirizine. Chemically, levocetirizine is the active enantiomer of cetirizine. It is the R-enantiomer of the cetirizine. Levocetirizine is an inverse agonist that decreases
activity at histamine H1 receptors. This in turn prevents the release of other allergy chemicals and increased blood supply to the area it and provides relief from the typical symptoms of hay fever. It does not prevent the actual release of histamine from mast cells.
Fig.1: Levocetirizine hydrochloride
MATERIALS AND METHODS
List of the chemicals
Levocetirizine Hcl (RL Chemicals, Ltd, Chennai), Ammonium Acetate (S.D. fine- chem. Ltd;) Glacial Acetic Acid (Ranbaxy, Fine Chemicals Ltd;), Isopropyl Alcohol (Ranbaxy, Fine Chemicals Ltd;), Distilled Water (Merck Ltd.,)
List of the equipment’s
Thief apparatus (Chitra equipment’s pvt ltd Mumbai), UV Spectro photo meter (Shimadhz UV-1800), Mechanical stirrer (lab chemicals Mumbai), Mettle weighing balance, Essay Mass mixer (Balaji pharma, Chennai)
Plan of work
To evaluate the results of blend uniformity studies in relevance to the acceptance criteria for content uniformity testing as per IP, BP and USP.
Blend uniformity study
In this study we Select 3 batch of blend location. From the blend, sample at least 10 locations, with at least 3 replicates from each #Assay 1 per location. During filling or compression, sample from at least 20 locations, taken at least 7 dosage units each. Assay at least 3 dosage unit per each location, Blend uniformity assay and validation.
Experimental
From blend we Selected three batches of salbutamol tablets .Ten samples of different location were taken from each batch .Samples were taken from thief apparatus (sampling rod).Quantity of sample was 1 to 3 x (150 mg) taken .From the 10 samples, 3 samples taken for content uniformity test .Assay method done by UV method. Assay
values meet criteria. RSD less than or equal to 5.0% and all individual are within the mean +\ - 10 of the mean value.
From dosage unit
20 samples collected periodically in every three batches. Tablets are collected in every 30 minutes. SO that every 30 minutes collected 7 tablets. Assay done by 3 tablets from the 7 tablets .Assay method done by UV method .Assay values meet criteria. RSD of all individuals less than or equal to 6.0 %. Each location mean is within 90.0 % to 110.0 % of target potency and all individuals are within 75.0 % and 125% of target potency.
Blend uniformity assay
Name of the product: L-CET 5mg TABLETS (to Levocetirizine HCl 5MG)
Label claim: Each uncoated tablet contains. Levocetirizine HCl (Equivalent to Levocetirizine HCl 5MG)
Content of levocetirizine hcl I.P (by UV)
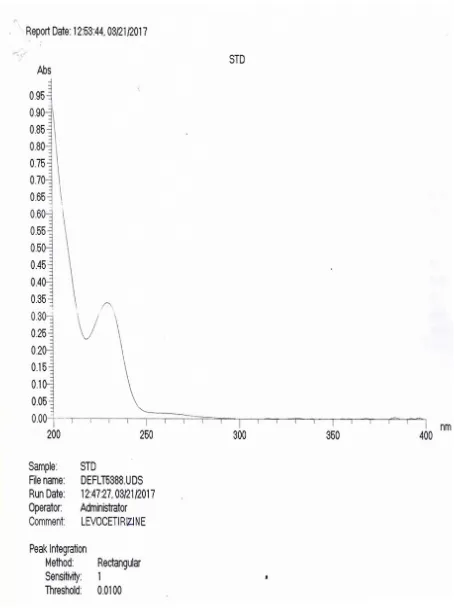
Preparation of Analytical Standard Solution
In a 100-mL volumetric flask, about 30 mg of Levocetirizine Dihydrochloride standard was taken and the standard was dissolved by adding 30 mL of 0.1 M Hydrochloric acid and was added to sonication for 2 to 3 minutes. After sample temperature came to room temperature, volume the sample up to mark with 0.1 M Hydrochloric acid. Then,5 mL of this solution was taken in a 100- mL volumetric flask and was diluted to 100 mL with 0.1 M Hydrochloric acid.
Preparation of Sample Solution
by adding 30 mL of 0.1 M Hydrochloric acid and was added to sonication for 2 to 3 minutes. After sample temperature came to room temperature, volume the sample up to mark with 0.1 M
Hydrochloric acid. Then,5 mL of this solution was taken in a 100-mL volumetric flask and was diluted to 100 mL with 0.1 M Hydrochloric acid.
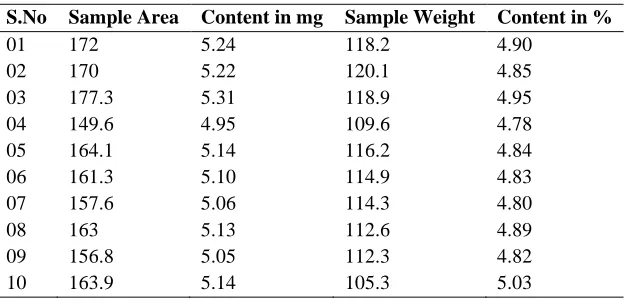
Table No.: 1.1 Results of Blend Samples Batch (1)
S.No Sample Area Content in mg Sample Weight Content in %
01 172 5.24 118.2 4.90
02 170 5.22 120.1 4.85
03 177.3 5.31 118.9 4.95
04 149.6 4.95 109.6 4.78
05 164.1 5.14 116.2 4.84
06 161.3 5.10 114.9 4.83
07 157.6 5.06 114.3 4.80
08 163 5.13 112.6 4.89
09 156.8 5.05 112.3 4.82
10 163.9 5.14 105.3 5.03
Table No: 1.2 Results of Blend Samples Batch (1I)
S.No Sample Area Content in mg Sample Weight Content in %
01 149.3 5.06 118.8 4.73
03 131.4 4.81 102.6 4.76
04 150 5.07 116.5 4.77
05 146.5 5.02 116.9 4.73
06 155.9 5.15 117.3 4.83
07 145 5.00 112.6 4.77
08 153.2 5.11 118.4 4.78
09 150.6 5.08 104.9 4.98
10 145.9 5.01 109.6 4.83
Mean 47.99
SD 0.07214
RSD 4.00
Table No: 1.3: Results of Blend Samples Batch (III)
S.No Sample Area Content in mg Sample Weight Content in %
01 112.8 5.10 115.8 4.812
02 115.9 5.16 119.1 4.810
03 112.6 5.09 117.7 4.779
04 133 5.47 123.1 5.010
05 112.9 5.10 119.6 4.756
06 122.6 5.28 117.6 4.939
07 112.6 5.09 118.6 4.766
08 110.9 2.06 115 4.794
09 102.6 4.91 108 4.767
10 101.1 4.88 102.6 1.833
Mean 48.27 SD 0.083151 RSD 4.55
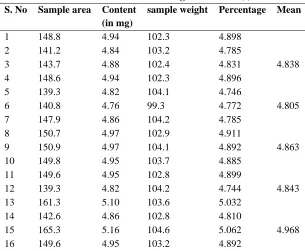
Table No: 1.4 Results of Dosage Unit Batch (I) S. No Sample area Content
(in mg)
sample weight Percentage Mean
1 148.8 4.94 102.3 4.898
2 141.2 4.84 103.2 4.785
3 143.7 4.88 102.4 4.831 4.838
4 148.6 4.94 102.3 4.896
5 139.3 4.82 104.1 4.746
6 140.8 4.76 99.3 4.772 4.805
7 147.9 4.86 104.2 4.785
8 150.7 4.97 102.9 4.911
9 150.9 4.97 104.1 4.892 4.863
10 149.8 4.95 103.7 4.885
11 149.6 4.95 102.8 4.899
12 139.3 4.82 104.2 4.744 4.843
13 161.3 5.10 103.6 5.032
14 142.6 4.86 102.8 4.810
15 165.3 5.16 104.6 5.062 4.968
17 151.9 4.98 104.6 4.895
18 142.8 4.86 102.3 4.822 4.869
19 143.6 4.87 102.9 4.821
20 177.4 5.31 103.8 5.230
21 143.6 4.87 104.6 4.791 4.948
22 181.6 5.37 106.2 5.231
23 142.4 4.86 100.1 4.856
24 155.6 5.03 102.3 4.985 5.024
25 142.5 4.86 102.3 4.818
26 142.6 4.86 101.2 4.839
27 169.3 5.21 108.3 5.040 4.899
Contd.. Table 1.4
30 151.4 4.98 101.8 4.941 4.861 31 142.1 4.85 102 4.818 32 145.1 4.89 103.3 4.833
33 143.5 4.87 101.7 4.841 4.830728 34 156.3 5.04 105.8 4.928
35 150.11 4.96 101.6 4.928 36 139.97 4.83 103.4 4.766 4.874 37 139.47 4.82 105.6 4.723 38 151.02 4.97 104.2 4.891 39 149.6 4.95 101.7 4.920 4.845 40 143.54 4.87 102.1 4.835 41 141.97 4.85 103.4 4.792 42 151.54 4.98 102 4.939 4.855 43 141.15 4.84 105.7 4.743 44 146 4.91 102.4 4.861 45 148.05 4.93 101.7 4.900 4.834 46 140.86 4.84 101.1 4.818 47 142.51 4.86 101 4.841 48 148.7 4.94 101 4.921 4.860 49 142.88 4.86 101.3 4.841 50 146.69 4.91 103.3 4.853 51 161.3 5.10 105.2 5.001 4.898 52 149.9 4.96 102.8 4.903 53 147.51 4.92 102.3 4.882 54 147.9 4.93 104.2 4.852 4.879 55 142 4.85 101.8 4.820 56 142 4.85 103.2 4.796 57 142.6 4.86 103.8 4.793 4.803 58 148.7 4.94 101.8 4.906 59 142.9 4.86 102.8 4.814 60 140.8 4.73 101.2 4.705 4.808
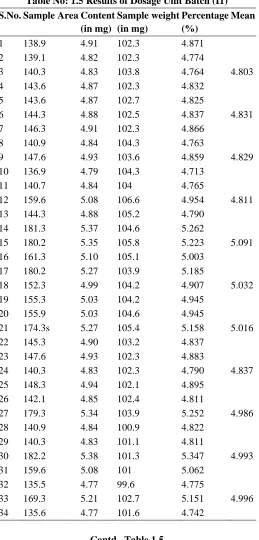
Table No: 1.5 Results of Dosage Unit Batch (I1)
S.No. Sample Area Content (in mg)
Sample weight (in mg)
Percentage (%)
Mean
1 138.9 4.91 102.3 4.871
2 139.1 4.82 102.3 4.774
3 140.3 4.83 103.8 4.764 4.803
4 143.6 4.87 102.3 4.832
5 143.6 4.87 102.7 4.825
6 144.3 4.88 102.5 4.837 4.831
7 146.3 4.91 102.3 4.866
8 140.9 4.84 104.3 4.763
9 147.6 4.93 103.6 4.859 4.829
10 136.9 4.79 104.3 4.713
11 140.7 4.84 104 4.765
12 159.6 5.08 106.6 4.954 4.811
13 144.3 4.88 105.2 4.790
14 181.3 5.37 104.6 5.262
15 180.2 5.35 105.8 5.223 5.091
16 161.3 5.10 105.1 5.003
17 180.2 5.27 103.9 5.185
18 152.3 4.99 104.2 4.907 5.032
19 155.3 5.03 104.2 4.945
20 155.9 5.03 104.6 4.945
21 174.3s 5.27 105.4 5.158 5.016
22 145.3 4.90 103.2 4.837
23 147.6 4.93 102.3 4.883
24 140.3 4.83 102.3 4.790 4.837
25 148.3 4.94 102.1 4.895
26 142.1 4.85 102.4 4.811
27 179.3 5.34 103.9 5.252 4.986
28 140.9 4.84 100.9 4.822
29 140.3 4.83 101.1 4.811
30 182.2 5.38 101.3 5.347 4.993
31 159.6 5.08 101 5.062
32 135.5 4.77 99.6 4.775
33 169.3 5.21 102.7 5.151 4.996
34 135.6 4.77 101.6 4.742
Contd.. Table 1.5
35 120.6 4.57 102.2 4.540
36 181.3 5.37 101.1 5.340 4.874 37 137.9 4.80 101.3 4.776 38 131.7 4.72 101.1 4.700
39 186.3 5.43 101.7 5.390 4.956 40 144.6 4.89 102.1 4.848 41 152.3 4.99 101.9 4.950
43 143.6 4.87 102.1 4.835 44 139.6 4.82 100.1 4.820
45 171.3 5.24 102.1 5.189 4.948 46 140.5 4.83 101.8 4.801
47 140.2 4.83 102.1 4.792 48 161.3 5.10 100.9 5.086 4.893 49 146.1 4.91 101.1 4.886
50 134.6 4.76 101.4 4.732 51 142.9 4.86 101.1 4.844 4.901 52 156.3 5.04 102.5 4.990
53 139.6 4.82 102.3 4.781 54 137.8 4.80 104.2 4.726 4.832 55 145.8 4.90 101.8 4.869
56 139.9 4.83 103.2 4.769 57 145.8 4.90 102.3 4.860 4.833 58 141.8 4.85 101.8 4.818
59 141.3 4.84 102.5 4.799 60 140 4.83 100.3 4.821 4.813
Mean 49.023 SD 0.088339 RSD 4.633912
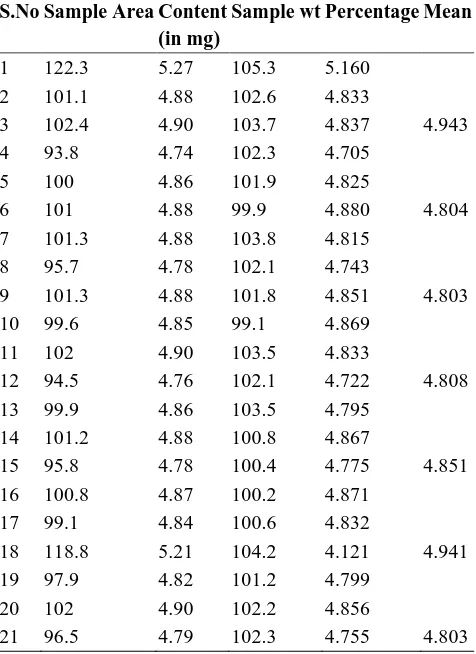
Table No: 1.6 Results of Dosage Unit Batch (II1)
S.No Sample Area Content (in mg)
Sample wt Percentage Mean
1 122.3 5.27 105.3 5.160
2 101.1 4.88 102.6 4.833
3 102.4 4.90 103.7 4.837 4.943
4 93.8 4.74 102.3 4.705
5 100 4.86 101.9 4.825
6 101 4.88 99.9 4.880 4.804
7 101.3 4.88 103.8 4.815
8 95.7 4.78 102.1 4.743
9 101.3 4.88 101.8 4.851 4.803
10 99.6 4.85 99.1 4.869
11 102 4.90 103.5 4.833
12 94.5 4.76 102.1 4.722 4.808
13 99.9 4.86 103.5 4.795
14 101.2 4.88 100.8 4.867
15 95.8 4.78 100.4 4.775 4.851
16 100.8 4.87 100.2 4.871
17 99.1 4.84 100.6 4.832
18 118.8 5.21 104.2 4.121 4.941
19 97.9 4.82 101.2 4.799
20 102 4.90 102.2 4.856
22 99.2 4.85 103.3 4.786
23 102.2 4.90 100.8 4.886
24 121.8 5.27 106.8 5.121 4.931
25 97.7 4.82 102.3 4.776
26 95.7 4.78 100.3 4.775
27 103.6 4.93 103.2 4.867 4.806
28 97.6 4.82 100.2 4.812
29 101.1 4.88 101.3 4.856
30 99.1 4.84 102.1 4.805 4.824
31 101.3 4.88 103.6 4.819
32 99.5 4.85 102.3 4.809
Contd. Table 1.6
33 102.3 4.90 102.3 4.860 4.829 34 96.6 4.80 101.7 4.767
35 98.2 4.83 100.1 4.825 36 115.5 5.15 108.4 4.982 4.858 37 96.7 4.80 100.6 4.788 38 100.2 4.86 102.5 4.818
39 97.9 4.82 100.5 4.812 4.806 40 97.9 4.82 103.5 4.759 41 105.3 4.96 101.1 4.937
42 97.7 4.82 101.7 4.787 4.828 43 102.2 4.90 100.8 4.886 44 112.8 5.10 102.4 5.049
45 100.3 4.87 99.1 4.883 4.939 46 98.9 4.84 100.8 4.825
46 98.9 4.84 100.8 4.825 47 99.2 4.85 102.6 4.798 48 99.9 4.86 100.8 4.843 4.822
49 97.9 4.82 103.7 4.756 50 100.3 4.87 101.1 4.845 51 115.5 5.15 102.1 5.104 4.902 52 99.4 4.85 101.9 4.814
53 96.5 4.79 100.9 4.779 54 101 4.88 101.4 4.853 4.815
55 99.5 4.85 101.8 4.818 56 101.2 4.88 100.9 4.866 57 101.6 4.89 101.4 4.864 4.849
58 101.8 4.89 100.3 4.888 59 105 4.95 101.3 4.928 60 95.7 4.78 101.9 4.747 4.854
RESULTS AND DISCUSSION
The blend samples
B.No. Parameters Results Acceptance criteria
1 RSD 4.02% Less than or equal to 5.0%
Variation of individual values to the mean - 4.76 %to 8.61% +/- 10% of mean
2 RSD 4.00% Less than or equal to 5.0%
Variation of individual values to the mean - 3.86 %to 10% +/- 10% of mean
3 RSD 4.55% Less than or equal to 5.0%
Variation of individual values to the mean - 4.2 %to 10% +/- 10% of mean
Tablet samples
B.No. Parameters Results Acceptance criteria
1 RSD 5.31% Less than or equal to 6.0%
Variation of each location mean to target potency 4.9% +/- 10% of target potency Variation of individual values to the target potency -7.6% to 23.2% +/- 25% of target potency
2 RSD 4.6% Less than or equal to 6.0%
Variation of each location mean to target potency 4.9% +/- 10% of target potency Variation of individual values to the target potency -9.7% to 24.86% +/- 25% of target potency
3 RSD 5.51% Less than or equal to 6.0%
Variation of each location mean to target potency 4.9% +/- 10% of target Potency Variation of individual values to the target potency -5.89% to22.7% +/- 25% of target potency
RESULTS
The uniformity of dosage units needs to be established for all the tablet formulations. The uniformity of dosage units is established either by uniformity of weight or content uniformity in the formulations. Pharmacopoeia describes criteria for performing content uniformity on the basis of the drug content / proportion in the formulation. The blend uniformity in granules following mixing
operation is crucial in determining the compliance of final product to the official requirements.
• Blend uniformity in the granules to the predetermined acceptance criteria
• Blend uniformity on the basis of the content uniformity from compressed tablets
• Mixing operation is good enough to provide content uniformity in the final product
REFERENCES
[1]. Allen, T., particle size measurement, 4 the Ed., Chapman and Hall, New York, 1990, 40.
[2]. Bergum, Constructing Acceptance Limits for Multiple Stage Tests, Drug Development and Industrial Pharmacy, 16, 1990, 2153-2166.
[3]. C.F. Harrwood and K.A. Walanski “Monitoring the Mixing of Powders,” ACS Division of Organic Coatings &
Plastic chemistry, 33(2), 1973, 508-515.
[4]. Current Good Manufacturing Practice: “Amendment of certain Requirements for Finished Pharmaceuticals; Proposed Rule,”3, 1996.
[5]. D.C. Montgomery, Design and Analysis of Experiments, John Wiley and Sons, 3, 1991, 81-87.
[6]. J.T.Carstensen and C.T. Rhodes “ Sampling in Blending Validation,” Drug Development & Industrial
Pharmacy, 20, 1993, 2699-2708.
[7]. K.W.Carley- Macauly and M.B. Donald “The Mixing of Solids It Tumpling Mixers-1,” Chemical Engineering
Science, 17, 1962, 493-506.
[8]. Motise, Paul J., William Crabbs, and Tony Lord, “Solid oral dosage forms: Blend uniformity Acceptance
[9]. PDA specific comments. Docket No. 99D-2635.Draft Guidance for Industry, ANDA`s: Blend Uniformity Analysis. 26, 1999, 1-10.
[10].PDA Technical Report No. 25, PDA journal of pharmaceutical science and technology 51(3), S1-S37.
[11].R.L. Lantrz, Jr. in Pharmaceutical Dosage Forms-Tablets, Vol 2, Second Edition, HA. Liberman; L. Lachman and J.B. Schwartz. Marcel Dekker, New York, 1989, 158-162.