warwick.ac.uk/lib-publications
Manuscript version: Working paper (or pre-print)The version presented here is a Working Paper (or ‘pre-print’) that may be later published elsewhere.
Persistent WRAP URL:
http://wrap.warwick.ac.uk/125867
How to cite:
Please refer to the repository item page, detailed above, for the most recent bibliographic citation information. If a published version is known of, the repository item page linked to above, will contain details on accessing it.
Copyright and reuse:
The Warwick Research Archive Portal (WRAP) makes this work by researchers of the University of Warwick available open access under the following conditions.
Copyright © and all moral rights to the version of the paper presented here belong to the individual author(s) and/or other copyright owners. To the extent reasonable and practicable the material made available in WRAP has been checked for eligibility before being made available.
Copies of full items can be used for personal research or study, educational, or not-for-profit purposes without prior permission or charge. Provided that the authors, title and full
bibliographic details are credited, a hyperlink and/or URL is given for the original metadata page and the content is not changed in any way.
Publisher’s statement:
Please refer to the repository item page, publisher’s statement section, for further information.
Warwick Economics Research Papers
ISSN 2059-4283 (online)
ISSN 0083-7350 (print)
Patent-Based News Shocks
Danilo Cascaldi-Garcia & Marija Vukotic
Patent-Based News Shocks
∗
Danilo Cascaldi-Garcia
†Federal Reserve Board
Marija Vukoti´
c
‡University of Warwick
First version: May 8, 2019
This version: July 10, 2019
Abstract
In this paper we exploit firm-level data on patent grants and subsequent reactions of their stocks to identify technological news shocks. Changes in stock market valuations due to announcements of individual patent grants represent expected future increases in the technology level, which we refer to as patent-based news shocks. Our patent-based news shocks resemble diffusion news in that they do not affect total factor productivity in the short-run but account for about 20 percent of its variations after five years. These shocks induce positive comovement between consumption, output, investment and hours. Unlike the existing empirical evidence, patent-based news shocks generate a positive response in inflation and the federal funds rate, in line with a standard New Keynesian model. Patenting activity in electronic and electrical equipment industries within the manufac-turing sector and computer programming and data processing services within the services sector play a crucial role in driving our results.
Keywords: News Shocks, Patents, Patent-based news shocks
JEL Classification Codes: E3, E32, L60
∗We would like to thank Rodrigo Ad˜ao, Hafedh Bouakez, Antonio Conti, Christoph G¨ortz, Boyan Jovanovich,
Pavel Kapinos, Michael McMahon, Roberto Pancrazi, Carlo Peroni, Thijs van Rens, and Francesco Zanetti for useful comments. Chazz Edington provided excellent research assistance. The views expressed in this paper are solely the responsibility of the authors and should not be interpreted as reflecting the view of the Board of Governors of the Federal Reserve System or of any other person associated with the Federal Reserve System.
†Federal Reserve Board, International Finance Division, Washington-DC 20551, USA; E-mail address:
‡University of Warwick, Economics Department, Coventry CV4 7AL, United Kingdom; E-mail address:
1
Introduction
Ever since the seminal work of Beaudry and Portier (2006) revived the idea of
expectation-driven business cycles in Pigou(1927), many economists have tried to understand the role that
so-called technological news shocks play in explaining business-cycle fluctuations.1
Technolog-ical news shocks are usually defined as advance information about technologTechnolog-ical improvements
that will become available in the future. Isolating these technological news shocks requires two
elements: first, a reliable measure of technological improvements and, second, an identification
strategy to extract the advance information about these improvements.
The empirical news literature almost exclusively uses the utilization-adjusted total factor
productivity (TFP) inFernald (2012) as a measure of technological improvements, and defines
technological news shock as the shock that does not affect TFP in the short run but drives
most of its variations over longer horizons.2,3 Neither of these two elements is free of concerns.
First, TFP is an indirect measure of technology that is hard to link to specific technological
improvements. Second, regardless of the specific assumptions imposed, existing identification
schemes rely on strong assumptions that the TFP follows an exogenous process and that,
consequently, long-run movements in TFP are solely due to productivity shocks.4
This paper contributes to the empirical literature by using a direct measure of technological
improvements and by proposing a straightforward identification strategy that is agnostic about
the TFP process. We use microlevel data on patents that are, as noted by Griliches(1990), by
definition directly related to inventiveness. In particular, we use the measure of technological
innovation in Kogan, Papanikolaou, Seru, and Stoffman (2017) (KPSS, henceforth), and refer
to it as patent-based innovation index because it combines firm-level data on patent grants with
their subsequent stock price movements.5 These stock price movements represent the reaction
1See, for example, Beaudry and Portier (2006), Jaimovich and Rebelo (2009), Barsky and Sims (2011),
Kurmann and Mertens (2014), Beaudry and Portier (2014), Schmitt-Groh´e and Uribe (2012), Forni et al.
(2014), andG¨ortz and Tsoukalas (2017).
2The TFP in Fernald (2012) is constructed following his earlier work in Basu et al. (2006). Even though
this measure arguably represents the best aggregate measure of technology at a quarterly frequency, it does
not fully coincide with the annual purified technology measure proposed by Basu et al. (2006) as it does not
correct for the possibility of non-constant returns to scale. As pointed out byBouakez and Kemoe(2017) even
this seemingly small discrepancy between the two measures can have important implications on the conclusions
regarding the effects of news shocks. In addition,Cascaldi-Garcia (2017) and Kurmann and Sims(2017) show
that the existing identification schemes are very sensitive to updates recently implemented by Fernald to his original TFP measure.
3Barsky and Sims(2011) identify technological news shock as a shock that explains most of the forecast error
variance of TFP over a 40-quarter horizon, restricting it to have zero impact effect on TFP. Some researchers
in this literature have adopted the approach of Francis, Owyang, Roush, and DiCecio (2014) and identified
technological news shocks as shocks that explain most of the forecast error variance of TFP at the 40-quarter
horizon, restricting it to have zero effect on TFP on impact. More recently,Kurmann and Sims(2017) propose
using the approach ofFrancis et al.(2014) but without imposing a zero-impact restriction.
4For example, as pointed out byBarsky and Sims(2011), other structural shocks that can affect productivity
in the future but not immediately, such as research and development shocks, investment-specific shocks or re-allocative shocks would be confounded with true news shocks when maximum variance decomposition of TFP is used, thus misrepresenting the importance of technological news shocks in driving the business cycle.
5The authors calculate an economic value of each patent based on the firm’s stock price reaction to news
of markets to announcements about technologies that will become available in the future, which
maps directly into the definition of technological news shocks.
The advantage of using this direct measure of future technology is that, unlike most of the
empirical news literature, we can use a very simple and straightforward identification
strat-egy. In particular, we identify the patent-based news shock as the shock that explains most
of the contemporaneous variations in the measure that aggregates stock market valuations of
all individual patents. We show that this shock essentially amounts to an unexpected
con-temporaneous shock. An increase in the patent-based innovation index represents the market
valuation of the potential patent outcomes, capturing expectations about technology that will
be available with some delay.
The news shocks identified with our approach are more closely connected to true
technologi-cal improvements for at least two reasons. First, our approach uses data on technology together
with forward-looking variables that reflect advance information about future improvements in
order to recover the structural shock. As we already discussed, using movements in TFP for
identification might be problematic, so it does not come as a surprise that even small updates
in TFP lead to different conclusions regarding the effects of technological news shocks. At the
same time, aggregate stock prices, often used in this literature, are also likely to capture changes
not related to economic fundamentals, such as optimism or animal spirits. By using microlevel
data, our approach mitigates these issues, as the KPSS measure considers only movements in
market responses during a narrow window of time around patent grant announcements.
There-fore, any surprise movements in the KPSS should measure market expectations solely about
future technological improvements reflected in patents.6
Second, long lags between a patent grant and the appearance of the patented product or
process account for a delay in the implementation of technology. This delay makes patents more
appealing for identifying news shocks than alternative direct measures that capture
technolog-ical improvements around their implementation dates (see, for example, Alexopoulos, 2011;
Alexopoulos and Cohen, 2009). Overall, patents represent a good proxy for a technology that
will be available and diffuse with a delay, while movements of the firm’s stock price within
a very short window around the patent grant date represent the market expectations about
this technology. Indeed, the key idea behind expectation-driven business cycles is that markets
economic value of the patent.
6It is important to note that the use of simple patent counts is often criticized in the literature because it does
not account for drastic differences in technical and economic significances across patents. It follows that a simple patent count may either underestimate or overestimate the real (expected) economic effect of such innovations. In addition, patents are used differently across fields and do not always reflect how the firm appropriates returns
from innovation (Sampat, 2018). The KPSS measure overcomes these issues by carefully weighting patents by
learn about a new technology before it is implemented, which is precisely what the patent-based
innovation index captures.
Our results show that the response of TFP to the patent-based news shocks closely
resem-bles the predicted path of diffusion news described by Portier (2014), as they seem to “bring
information about the future evolution of TFP without affecting TFP in the short run.” In
fact, our news shocks do not significantly move TFP for about six quarters in our benchmark
specification. Strikingly, this is a result of the identification and not an imposed assumption;
Beaudry and Portier (2006) only achieve such diffusion by imposing it through statistical
pro-cedures, and Barsky and Sims (2011) show TFP quickly growing to a new higher level, which
is less compatible with the idea of diffusion news. Because of this feature, our results are also
much less susceptible to the criticism that expansions following news shocks are not due to
the effects of news per se, but rather to the expected change in fundamentals evoked by news
innovations.
The identified patent-based news shocks induce a clear comovement among output,
con-sumption, investment, and hours. They all rise on impact, displaying hump-shaped responses;
the majority of these movements happen even before the positive effect on TFP becomes
signif-icant and TFP starts picking up. This result indicates that the identified shock carries advance
information about future productivity prospects, rather than tracking its path. This
anticipa-tion feature of the patent-based news shock is further confirmed by the strong positive impact
effect on the two forward-looking variables, stock prices and consumer confidence.
Another important result of our analysis relates to the responses of inflation and the federal
funds rate to the patent-based news shock. Both variables respond positively in the short
run, consistent with the predictions of a standard New Keynesian model. This result becomes
even more relevant in light of the fact that most of the empirical literature suffers from a
so-called disinflation puzzle – a persistently negative response of inflation to a positive news
shock. Bouakez and Kemoe(2017) show that the existence of this puzzle in the empirical news
literature is the direct consequence of measurement errors in TFP that impair the identification
of technological news shocks.7 Because our identification does not rely on any assumptions
regarding TFP, this result reinforces the claim that the patent-based news shocks we identify
represent “true” technological news shocks.8
The news shocks identified here explain less of the forecast error variance of main
macroe-conomic aggregates than typically found in the empirical literature on news shocks. This result
is expected, because most identification schemes are based precisely on maximizing the forecast
7In addition, these authors also confirm that technological news shocks in the Smets and Wouters (2007)
model are indeed mildly inflationary.
8As pointed out byBarsky and Sims(2009), in order to make TFP-based empirical news literature findings
consistent with a New Keynesian model, one would need to account for additional features, such as exogenous
real wage rigidity or monetary policy that reacts to output growth rather than output gap. Furthermore,Jinnai
(2013) shows that these modifications are not enough in a model with endogenous capital, and proposes two
error variance of TFP over a particular horizon. We believe that our results represent a lower
bound of the importance of technological news shocks given that not all innovative activity
is patented in the first place, and the patent-based innovation index only considers publicly
listed companies. Nevertheless, the patent-based news shocks explain almost zero short-run
variations in TFP and about 20 percent of variations at a five-year horizon.
We also provide industry evidence, where we show that patenting activity in
manufactur-ing and services is predominantly responsible for explainmanufactur-ing future movements in TFP. Within
manufacturing, the most important industries are Electronic and electrical equipment,
Machin-ery and Chemicals. Interestingly, a patent-based news shock identified only considering these
industries produces a perfect zero effect on impact, before slowly growing to a new higher level.
Another important industry, Business services, produces a significant positive effect on impact,
also increasing in the long-run. This positive impact effect is expected, as this industry is driven
by services related to computer programming and data processing which can be available more
promptly to the market than manufacturing goods.
We show that our main results are robust to using the patent-based innovation index as
an instrument for innovative activity in a proxy VAR setting by following the methodology
developed in Stock and Watson (2012) and Mertens and Ravn (2013). As the patent-based
innovation index aims to capture exogenous stock price movements due to expected future
economic fundamentals, it represents a good candidate for a proxy for technological news shocks.
The idea of using proxy VARs to identify technological news shocks is recent and, to the
best of our knowledge, initiated by Cascaldi-Garcia (2018), who employs forecast revisions
from professional forecasters as exogenous instruments. Miranda-Agrippino et al. (2019) also
propose a proxy for technological news shocks, based on the number of patents registered with
the USPTO. However, as previously discussed, the sole use of patent counts can underestimate
or overestimate the real (expected) economic effects of patented innovations.
This paper is also linked to the literature that relates patents to technological development.
The idea of using patent data to identify surprise technology shocks has been explored byShea
(1999) andChristiansen(2008). The former uses data on patent applications and research and
development expenditures in 19 U.S. manufacturing industries to recover technology shocks,
concluding that favorable technology shocks do not significantly increase measured TFP at any
horizon. Christiansen (2008) uses more than a century of annual data on patent applications
and investigates effects of patent shocks on inputs and labor productivity.
Our paper is organized as follows. Section 2 argues why patents and their stock market
valuations can be used to identify technological news shocks. Section 3 describes the data
and the identification procedure. Section 4 presents the main results. Section 5 discusses
the relation of our patent-based news shocks to traditional TFP-based news shocks and to
unexpected innovations in other forward-looking variables. Section6presents the robustness of
our results when proxy VAR with the patent-based innovation index as an instrument is used.
2
Patent-Based News Shocks
The news literature usually defines technological news shocks as advance information about
technology that will become available with some delay. Rarely, however, does this literature
provide specific examples of such technological advances. Instead, it almost exclusively relies
on using TFP as an abstract aggregate measure of technology and explores its movements over
the business cycle to identify aggregate technological news shocks.
We identify technological news shocks using a measure, proposed by KPSS, that combines
microlevel data on patents together with their stock market valuations. This approach
over-comes the restriction that TFP is an abstract and imperfect measure of technology by relying
on the importance of microlevel data to learn about relevant aggregate shocks.9 We argue that
unexpected innovations in this measure represent technological news shocks and refer to them
as patent-based news shocks.
Patents contain useful information about inventive activity of an economy.10 Furthermore,
as argued byGriliches(1990), analyzing data on patents together with the data on stock market
valuation is particularly useful because of the immediate nature of stock market reactions to
the events that are a result of firms’ research activities. At the same time, the author notes
that a downside of using stock market data is its large volatility, arguing that “the needle might
be there but the haystack can be very large.” We argue that specific stock market variations
exploited by KPSS bring us much closer to finding this needle and, consequently, to identifying
technological news shocks.11
2.1
KPSS Innovation Index
The KPSS aggregate innovation index is constructed by using rich firm-level datasets. In
particular, the authors estimate the economic value of the patent by combining data on patents
issued to U.S. firms during the 1926-2010 period with firm stock price movements.12 The biggest
challenge these authors face is to carefully extract the information about the economic value of
9When learning about an aggregate shock that might represent a relevant force behind business cycles, it is
always useful to consult more data. For example,Romer and Romer(2004) use a narrative approach by reading
accounts of each Federal Open Market Committee meetings to identify monetary policy shocks and, similarly,
by analyzing presidential speeches and congressional reports to identify tax shocks inRomer and Romer(2010).
Nakamura and Steinsson (2014) exploit variation in regional military procurements to estimate the effects of government spending. Using microdata becomes particularly relevant in the case of technological news shocks, given the imperfections related with TFP as an aggregate measure of technology.
10AsGriliches(1990) writes “the stated purpose of the patent system is to encourage invention and technical
progress both by providing a temporary monopoly for the inventor and by forcing the early disclosure of the information necessary for the production of this item or the operation of the new process.”
11Several authors have explored stock valuations of patentable assets. See, for example, Austin (1993),
Nicholas (2008), and Hall et al. (2005). However, none of these studies is as broad, both in firm and time dimension, as the KPSS one.
12In particular, the authors use about 7.8 million patents available from Google Patents and then match all
the patent contained in stock prices from unrelated news. To do so, they focus their analysis
on the days around an announcement of a patent grant, which are also characterized by larger
trading activity in the stock of the firm. They then filter the stock price reaction to the patent
issuance from noise by making several distributional assumptions; the results prove to be quite
robust to these assumptions.
The value of each patent in the database is calculated as a part of the stock reaction that
is solely due to news about a patent grant. One can then aggregate firm-level information to
obtain an aggregate innovation index. In order to do so, particular assumptions must be made
about how monopoly profits of the firms, accumulated because of the patent issuance, relate to
aggregate improvements in technology. The authors propose a simple model of innovation as
inAtkeson and Burstein(2011), in which firms collect monopoly profits from innovation; these
profits, in turn, are approximately linearly related to aggregate improvements in output and
TFP. Therefore, an aggregate measure (equation 18 in the original article) is the sum of the
value of all patents granted in year t to the firms in their sample, scaled by aggregate output.
The aggregate index constructed following the above procedure is in an annual frequency.
Crucially for our analysis, we were able to construct an analogous measure in a quarterly
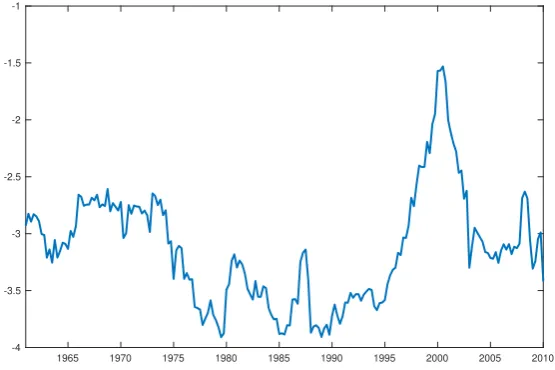
frequency, as displayed in Figure 1.13 We refer to this measure as the patent-based innovation
[image:9.595.161.439.439.624.2]index.
Figure 1 Quarterly Patent-Based Aggregate Innovation Index
1965 1970 1975 1980 1985 1990 1995 2000 2005 2010 -4
-3.5 -3 -2.5 -2 -1.5 -1
Note: Log of the aggregate patent-based quarterly index constructed following the procedure described
inKogan et al.(2017), spanning 1961:Q1 - 2010:Q4.
The value of the index seems to follow times of speculation in the market and especially
13The authors make available information on patent grant dates, the inferred economic value of each patent
that of the dot-com bubble, where investors appear to have been actively following technological
patents. Throughout the entire sample, the distribution of patents assigned to the firms is highly
skewed. There are few high-frequency patenting companies in the sample. For example, during
the sample Exxon Mobil was granted, on average, 240 patents per year, Cisco about 332, and
IBM 1,384. To put these numbers into perspective, the median number of patents per company
per year is 3, and the average number is about 29. Figure2represents the top 10 firms by their
[image:10.595.158.428.229.421.2]patent value from 1961 to 2010 with all their patent values throughout the sample.14
Figure 2Value of Patents by Company
Note: The figure shows values (in 1982 dollars) of each patent by top 10 firms.
Figures 3and4represent the share of total number (and value) of patents by top 10 firms in
each year. The share of these firms, both in terms of number and value of patents, is consistently
higher than 25 percent and, in some periods, even as high as 50 percent.
2.2
Bridging the Theoretical and Empirical Technological News
A few reasons lead us to believe that the patent-based innovation index can be used to
extract technological news shocks.
First, by combining patent counts with stock market data, this measure overcomes the
criticisms that arise when only simple patent counts are used for economic analysis, which
pertain to the issue of drastic differences in technical and economic significances across patents.
Specifically, this measure carefully extracts the economic value of each patent by capturing
firm stock market movements in response to news about patent grants; these stock market
valuations, in turn, are used as weights for the economic importance of each patent.15
14Nicholas (2008) investigates valuations of corporate patentable assets in an earlier period, from 1910 to
1939, and also finds that the distribution of patents is highly skewed, with few companies dominating patenting activity.
15Another “quality-adjusted” measure of patents often used in the literature is citation counts, as discussed by
Figure 3 Top Firms by Number of Patents per Year
Note: The figure shows the share of number of patents by top 10 firms in each year from 1961 to 2010.
Figure 4 Top Firms by Total Patent Value per Year
Note: The figure shows the share of total value of patents by top 10 firms in each year from 1961 to 2010.
Second, while lags between a patent grant and the date when a product or process that is
patented is brought to markets might be worrisome when one is interested in recovering surprise
technological shocks (see, for example, Alexopoulos, 2011), they represent a desirable feature
when one is interested in recovering technological news shocks. Indeed, the key idea behind
expectation-driven business cycles is that markets learn about a new technology before it is
implemented, which is precisely what the patent-based innovation index captures.
Third, any plausible identification of technological news shocks must rely on the usage
of forward-looking variables because of their predictive power regarding future movements in
[image:11.595.140.454.367.567.2]has often used movements in aggregate stock prices and consumer confidence to extract the
forecastable component of TFP. However, these movements also capture changes not related
to economic fundamentals, such as optimism, confidence, and animal spirits. By narrowing
the forward-looking component to the specific market responses to announcements of patent
grants, the patent-based measure is more prone to capture market expectations only based on
future economic fundamentals.
Fourth, identifying technological news shocks by looking at unexpected movements in a
measure that collects market expectations about the future value of a technological innovation
circumvents the issues that arise when the identification relies on TFP measures. Fernald(2012)
calculates a utilization-adjusted TFP series that is widely used by the news shock literature as a
proxy for the technological level of the U.S. economy. The process of extracting the technological
level is complex and depends on imputations on hours worked and capital level as well as on
filters to estimate the utilization factor. As a result, the series is subject to measurement errors
and data revisions.
As pointed out byCascaldi-Garcia (2017) and Kurmann and Sims(2017), the identification
of news shocks is not robust to different vintages of this series. The Barsky and Sims (2011)’
identification, for example, relies on the assumption that this series perfectly captures the
technological level of the economy, and that it is driven by only two shocks: surprise and
news shocks. It follows that movements in forward-looking variables that can explain future
movements in TFP should represent a news shock. This claim, however, does not hold if TFP is
measured with an error. Our identification instead depends only on the patent-based innovation
index series, and it is agnostic about the measurement of TFP.
Overall, rather than focusing on proposing a novel statistical approach that would recover
news shocks by exploiting fluctuations in TFP, we approach this problem differently, by using
microlevel data on patents and their stock market valuations. Because this measure represents
a forward-looking measure that collects market expectation about the future value of an
inno-vation, any unexpected changes in this measure would represent news about the future value
of these innovations.
2.3
Some Illustrative Examples
Although a firm that applies to patent a technology might start using the technology
dur-ing or even before the application process, it is only after the technology is patented that the
information about it becomes public knowledge. This information can then be used by
com-petitors for advancing their own technological ideas. Therefore, it is likely that the effects of a
technological discovery that is admissible for being patented will be reflected in the aggregate
TFP only after the patent is granted.
We provide several examples in order to establish the relationship between a patent grant,
technology and its effect on competitors.
First we consider patent 5,064,435, titled “Self-expanding prosthesis having stable axial
length,” which was granted to Schneider (USA) Inc. on November 1, 1991. This patent
rep-resented an improvement over plastically expanded stents used until that time. The patent
was assigned a very high economic value, placing it in the top 15 percent in 1991. With 788
forward citations, the patent was the 25th most-cited patent in the entire sample and the
sec-ond most-cited patent in 1991, indicating its high scientific value as well. Interestingly, even
though the U.S. Food and Drug Administration approved the stent use only two years after
the patent grant, it was already cited about 40 times within the first two years of its grant,
suggesting that the information released in the patent was widely used for the development of
other technologies.
Another example that illustrates the importance of the dissemination of the information
released with a patent grant is patent 4,131,919, awarded to Eastman Kodak Company on
December 26, 1978, for the invention of the “electronic still camera that employs a nonvolatile
reusable storage medium for recording scene images”– the first self-contained digital camera.
Although Kodak didn’t make a camera that used digital single-lens reflex commercially
avail-able until 1991, the information contained in this patent was crucial for the development of
competing technologies and for the overall advancement of the field of photography and
imag-ing. The information was invaluable for competitors that understood the importance of digital
technology even more than Kodak itself and produced a commercially available digital camera
in 1986.16 The patent value was the third highest in 1977. Its scientific value was very high
as well; the patent was cited 100 times, placing it in the top 1 percent of cited patents in the
entire period.
Patent 4,699,545, granted to Exxon Production Research Company on October 13, 1987
and titled “Spray Ice Structure,” is an example that confirms the narrative behind technological
news shocks. The patent is for a method of creating a structure to protect against ice sheets
when drilling offshore arctic wells, and it presents a “fast, economical and practical approach
for drilling offshore arctic wells in areas covered by floating ice.” It was only after two years
that the technology was first used. This invention, therefore, clearly represents an important
technological advancement available with delay.
3
Data, Bayesian VAR, and Identification Procedure
The information set contains a combination of technology, real macroeconomic, and
forward-looking variables, described in Appendix A. We estimate our benchmark VAR model with 10
endogenous variables. All variables except inflation (reported in annualized percent) are in log
levels as in Barsky and Sims (2011), allowing for the possibility of cointegration among them.
16In 1986, the Japanese company Nikon introduced a prototype of the first digital single-lens reflex (DSLR)
The data frequency is quarterly, from 1961:Q1 to 2010:Q4 and the model contains four lags
and an intercept term. We employ a Bayesian VAR in order to deal with the large number of
coefficients by taking advantage of Minnesota priors (Litterman, 1986; Ba´nbura et al., 2010).
Confidence bands for the impulse response graphs are computed using 1,000 draws from the
posterior distribution.
The patent-based news shock is identified following the procedure introduced by Francis
et al. (2014) and the maximum forecast error variance approach in Uhlig (2005), which was
further developed by Barsky and Sims(2011).
Taking a vector of endogenous variables yt, assuming that patent-based innovation index is
ordered first, the moving average representation (in levels) is written as
yt=B(L)ut. (1)
If there is a linear mapping of the innovations (ut) and the structural shocks (st), this
moving average representation can be rewritten as
ut=A0st (2)
and
yt=C(L)st, (3)
where C(L) = B(L)A0, st = A−01ut, and A0 is the impact matrix that makes A0A
0
0 = Σ
(variance-covariance matrix of innovations). It is possible to rewrite A0 as A˜0D, where A˜0 is
the lower triangular Cholesky factor of the covariance matrix of reduced-form innovations (or
any other orthogonalization), and D is any k×k matrix that satisfies DD0 =I.
Considering that Ωi,j(h) is the share of the forecast error variance of variable i of the
structural shock j at horizon h, and that patent-based innovation index is driven only by one
exogenous shock (patent-based news shock), it follows that Ω1,1(0)news= 1, where h= 0 refers
to the effect on impact, i= 1 refers to patent-based index andj = 1 is the patent-based news
shock. The share of the forecast error variance of the patent-based news shock is defined as
Ω1,1(0)news=
e01BτA˜0De2e 0 2D 0 ˜ A 0 0B 0 τ e1
e01(BτΣB
0
τ)e1
= B1,τ
˜ A0 γγ
0
˜ A00B01,τ B1,τΣB
0 1,τ
, (4)
where e1 is a selection vector with 1 in the positioni= 1 and zeros elsewhere, e2 is a selection
vector with 1 in the positioni= 1 and zeros elsewhere, andBτ is the matrix of moving average
coefficients measured at each period until τ. Since the effect of interest here is on impact, this
can be simplified as τ = 0. The combination of selection vectors with the proper column of
D can be written as γ, which is an orthonormal vector that makes A˜0γ the impact of a news
The patent-based news shock is identified by solving the optimization problem
γ =argmaxΩ1,1(0)news, (5)
s.t.
γ0γ = 1, (6)
where the restriction imposes that the γ vector is orthonormal.
In summary, the patent-based news shock is identified as the shock that best explains
unpredictable movements of the patent-based innovation index on impact (h = 0). This is
equivalent to finding the linear combination of the reduced-form VAR innovations ut that
maximizes the forecasting variance of productivity on impact.17
4
Results
In this section we discuss the effects of our patent-based news shock on the business cycle.
We discuss its effect on aggregate productivity as well as on the following macroeconomic
variables: output, consumption, investment, hours, inflation, the federal funds rate, consumer
confidence, and the stock price index. We then provide industry evidence and document which
industries prove to be most relevant for our results. We consider a horizon of five years (20
quarters) which, as suggested by Barsky et al. (2015), represents a reasonable benchmark
horizon for predictions of future productivity. In addition, this is the horizon over which the
effect of the patent-based news shocks on patent-based innovation index dies out.
4.1
Patent-Based News Shocks and Total Factor Productivity
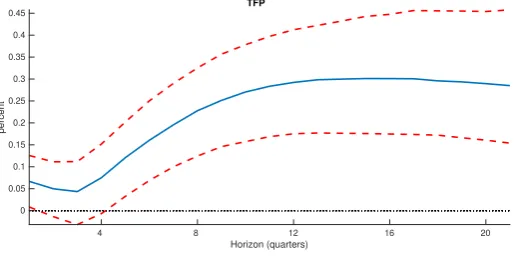
Figure 5displays the response of TFP to a patent-based news shock described above. Even
though the impact response of TFP is not restricted, it is barely statistically different from
zero. After this small initial jump, TFP decreases for about a year before it slowly picks up
and converges to its new long-run level.18 However, it is only after about five quarters that the
coverage bands of the impulse response do not rule out a zero effect. This result implies that
after an announcement of a new patent grant, a jump in the firm’s stock price – a
forward-looking variable – anticipates the expected future aggregate technological improvements brought
by the implementation of this patent. In fact, after a favorable patent-based news shock, TFP
permanently increases by about 0.3 percent.
As pointed out by Barsky et al.(2015), a news shock should not be correlated with current
productivity but should predict its future movements. The shock we identify does precisely that.
17The signs of the identified shocks might flip because the identification is based on the forecast error variance.
To ensure a positive patent-based news shock, we check whether the response of the patent-based index is positive
on impact. If the response is negative, all computed responses are multiplied by (−1).
18This slight decrease of aggregate TFP before it starts to rise might be a reflection of a creative destruction
Figure 5 Response of TFP to a Patent-Based News Shock
TFP
4 8 12 16 20
Horizon (quarters) 0
0.05 0.1 0.15 0.2 0.25 0.3 0.35 0.4 0.45
percent
Note: The blue solid line is the estimated impulse response to a patent-based news shock and corre-sponds to the posterior median estimates. The unit of the vertical axis is the percentage deviation from the situation without a shock. The responses originate from a VAR composed of the following: the patent-based innovation index, TFP, GDP, consumption, investment, hours, inflation, the fed-eral funds rate, consumer confidence, and the stock price index. The time period is from 1961:Q1 to 2010:Q4. The system is estimated in the levels of all variables, features four lags and a constant. The dashed red lines represent +/- one standard deviation confidence bands of the patent-based news shock obtained by drawing from the posterior.
The above result suggests that an innovation in the patent-based index carries information
about aggregate productivity many periods into the future but not about its current level.
This conclusion is bolstered by the fact that the patent-based index Granger causes future
productivity and that there is significant correlation between the current level of the
patent-based index and TFP five years ahead, while there is no correlation in the short run.19
The TFP response presented in Figure5also resembles a process that follows a slow diffusion
of new innovative activity, as discussed by Portier (2014). In particular, in line with the
illustrative examples provided above, the author argues that a “true” technological news shock
should take some time to diffuse into aggregate productivity. As a result, impulse responses
of TFP after a news shock should not show a significant increase in the short-run.20 Barsky
and Sims (2011), for example, have trouble reproducing this fact even after imposing a
zero-impact response of TFP. FigureB1in the Appendix displays responses of TFP to a news shock
identified using four different identification schemes often used in the literature. It is clear that
when zero-restrictions are not imposed the response of TFP on impact is quite large (about 0.7
percent and 0.2 percent when Barsky and Sims, 2011, and Francis et al., 2014, identification
without zero impact restriction is used, respectively), making the results less compatible with
the diffusion news story. In addition, these results show that TFP may not be a perfect measure
of technology and that it might be problematic to explore features of this particular series to
extract news shocks.
19A Granger causality test reveals that movements in the patent-based index predict movements in TFP. The
value of the F statistic is 7.89 with a p-value of .0001 for a lag length of 3 chosen according to the Bayesian Information Criterion.
20In particular, the response of TFP in Figure5very much resembles a response to a hypothetical news shock
in panel (d) of Figure 2 inPortier(2014). Using Portier’s terminology, our patent-based news shock very much
In light of these results, the attractive feature of our identification is that it does not rely
on imposing any assumptions about short- and long-run behavior of TFP. Our results are not
affected by the measure of TFP used. Traditionally, news literature uses utilization-adjusted
TFP as a proxy for the technological level of the economy, which we also adopt as our benchmark
case. However, as Figure B2 in the Appendix illustrates, the responses to a patent-based
news shock are almost identical regardless of whether productivity is adjusted for capacity
utilization. Furthermore, as evident from the right panel of this figure, our patent-based news
shock essentially represents an unexpected innovation to the patent-based index.
Finally, as an additional check, we perform a local projection of the patent-based news
shock on utilization-adjusted TFP, following methodology proposed by Oscar Jord`` a (2005).
As presented in Figure B3 in the Appendix, the response of TFP is zero on impact, and
starts to slowly increase over time. After 20 quarters it is statistically different from zero.
This robustness test provides extra evidence of the power of the patent-based news shock on
capturing the technological diffusion characterized by the news shock literature.21
4.2
Patent-Based News Shock and Business Cycle
Figure 6 shows the responses of output, consumption, investment, hours, inflation, the
federal funds rate, consumer confidence, and the stock price index to a positive patent-based
news shock.
A patent-based news shock induces a clear comovement among output, consumption,
in-vestment, and hours. Output increases by about 0.15 percent on impact. Interestingly, much
of this increase is dictated by investment behavior. In particular, the 0.25 percent impact
re-sponse of investment is higher than that of output. The effect is long-lasting as investment
remains positive at a new higher level of about 0.7 percent. Consumption also reacts positively
on impact, but this effect is quite muted, with an impact increase of about 0.1 percent. This
new higher level is sustained even after five years, but the coverage bands do not rule out a zero
long-run effect. The response of hours is positive on impact and through about seven quarters.
Output, consumption, investment and hours all rise on impact and display hump-shaped
responses. The majority of these movements happen even before the positive effect on TFP
becomes significant and TFP starts picking up, which is clearly indicative of the identified
shock carrying advance information about future productivity prospects, rather than tracking
its path. The strong positive impact effect on two forward-looking variables, stock prices and
consumer confidence, also confirms the anticipation feature of the patent-based news shock.
This result suggests that economic agents anticipate future technological improvements and act
upon them before actual changes in TFP materialize.
The impact responses of inflation and the federal funds rate are particularly interesting.
21Local projections of the patent-based news shock on other macroeconomic variables are qualitatively similar
Figure 6 Responses to a Patent-Based News Shock
Output
4 8 12 16 20
Horizon (quarters) 0 0.1 0.2 0.3 0.4 percent Consumption
4 8 12 16 20
Horizon (quarters) -0.1 0 0.1 0.2 0.3 percent Investment
4 8 12 16 20
Horizon (quarters) 0 0.5 1 percent Hours
4 8 12 16 20
Horizon (quarters) -0.1 0 0.1 0.2 0.3 percent Inflation
4 8 12 16 20
Horizon (quarters)
0 0.05 0.1
percent
Federal Funds Rate
4 8 12 16 20
Horizon (quarters) -0.1 -0.05 0 0.05 0.1 0.15 0.2 percent Consumer Confidence
4 8 12 16 20
Horizon (quarters) -0.5 0 0.5 1 1.5 percent Stock Prices
4 8 12 16 20
Horizon (quarters) -2 -1 0 1 2 3 percent
Note: The blue solid lines are the estimated impulse responses to a patent-based news shock, and correspond to the posterior median estimates. The unit of the vertical axis is the percentage de-viation from the situation without a shock. The responses originate from a VAR composed of the following: the patent-based innovation index, TFP, GDP, consumption, investment, hours, infla-tion, the federal funds rate, consumer confidence, and the stock price index. The time period is from 1961:Q1 to 2010:Q4. The dashed red lines represent +/- one standard deviation confidence bands of the patent-based news shock obtained by drawing from the posterior.
Both inflation and the federal funds rate rise mildly on impact, although the response of the
federal funds rate does not rule out a zero effect. The positive response of the federal funds
rate is in line with the initial increase in inflation, and with the predictions of a standard New
Keynesian model. However, most of the empirical news shock literature suffers from a so-called
disinflation puzzle, a negative and persistent response of inflation to a positive news shock (see,
for example,Barsky and Sims,2011;Kurmann and Sims,2017;Barsky et al.,2015). As pointed
out byBarsky and Sims (2009), in order to make these empirical findings consistent with a New
Keynesian model, one would need to account for additional features, such as exogenous real
wage rigidity or monetary policy that reacts to output growth rather than output gap. In
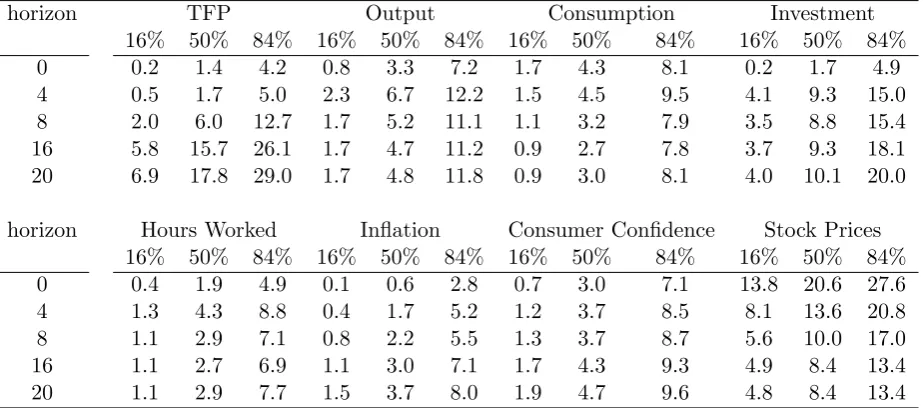
Table 1 Distribution of the Forecast Error Variance
horizon TFP Output Consumption Investment 16% 50% 84% 16% 50% 84% 16% 50% 84% 16% 50% 84% 0 0.2 1.4 4.2 0.8 3.3 7.2 1.7 4.3 8.1 0.2 1.7 4.9 4 0.5 1.7 5.0 2.3 6.7 12.2 1.5 4.5 9.5 4.1 9.3 15.0 8 2.0 6.0 12.7 1.7 5.2 11.1 1.1 3.2 7.9 3.5 8.8 15.4 16 5.8 15.7 26.1 1.7 4.7 11.2 0.9 2.7 7.8 3.7 9.3 18.1 20 6.9 17.8 29.0 1.7 4.8 11.8 0.9 3.0 8.1 4.0 10.1 20.0 horizon Hours Worked Inflation Consumer Confidence Stock Prices
16% 50% 84% 16% 50% 84% 16% 50% 84% 16% 50% 84% 0 0.4 1.9 4.9 0.1 0.6 2.8 0.7 3.0 7.1 13.8 20.6 27.6 4 1.3 4.3 8.8 0.4 1.7 5.2 1.2 3.7 8.5 8.1 13.6 20.8 8 1.1 2.9 7.1 0.8 2.2 5.5 1.3 3.7 8.7 5.6 10.0 17.0 16 1.1 2.7 6.9 1.1 3.0 7.1 1.7 4.3 9.3 4.9 8.4 13.4 20 1.1 2.9 7.7 1.5 3.7 8.0 1.9 4.7 9.6 4.8 8.4 13.4
Note: The table reports distribution of forecast error variance explained by a patent-based news shock at different horizons – namely at 0, 4, 8, 16, and 20 quarters.
such as sticky nominal wages in the labor market and a monetary policy that responds to
consumption growth rate are needed. Our results show that all these additional features are
not needed in the first place.
Table 1 displays the distribution of forecast error variance explained by the patent-based
news shock. There are several compelling observations. First, the shock explains almost no
short-run variations in TFP, while it accounts for a large part of the longer-run variations
in TFP. Recall that our identification procedure does not impose this result as it is the case
with identifications based on forecast error maximization of TFP. This result is encouraging,
because it suggests that the information contained in firms’ stock prices after they have been
granted the patent clearly explains part of future TFP movements. Furthermore, this result
does not come as a surprise given our previous assertion regarding the patent-based index
Granger causing TFP and patent-based index being significantly correlated with TFP only
after about 20 quarters.
Second, the patent-based news shock explains about 9 to 10 percent of the variation in
investment in the long run, and about 5 to 7 percent of output (mean of the posterior
dis-tribution). Interestingly, the identified shock explains variations in output and investment at
horizons when positive changes in TFP have not materialized or reached their long-run level,
in line with the idea of anticipated effects from future technological improvements.
Third, the shock explains a large part of short-run variation in stock prices. In particular, it
explains about one-fifth of total variation on impact and less than one-tenth of total variation
after five years. This result is in line with news being reflected immediately in forward-looking
variables, with a diminishing effect over time, and with stock market efficiency. The shock
accounts only for 3 to 5 percent of the variation of consumer confidence, at all horizons.
longer-run variations in TFP, suggesting that it carries relevant information about future productivity
movements. This shock also induces comovement among output, consumption, investment and
hours. Furthermore, contrary to technological news shocks identified by maximizing variations
in TFP, patent-based news shocks induce responses of inflation and the federal funds rate in
line with the New Keynesian model.
It is important to note that our results are likely to understate the effects of news shocks.
KPSS use patents from publicly listed firms and therefore do not cover the universe of all
patented innovations. Although this effect is minimized by constructing the aggregate index as
we discussed above, not all innovations are patented in the first place, as patenting is a strategic
decision. Therefore, our results are likely to represent a lower bound on the (business cycle)
importance of true news shocks. The fact that patent-based news shock still explains quite a
good share of variations in TFP is reassuring because it suggests that the shock we identify
carries important information about future productivity.
4.3
Industry Evidence
The aggregate patent-based innovation index is based on the valuations of patents spanning
many different industries. To better understand which industries technological news originate
from, we break up the aggregate index into indexes specific to nine SIC divisions: 1) Agriculture,
Forestry and Fishing, 2) Construction, 3) Finance, Insurance and Real Estate, 4)
Manufactur-ing, 5) MinManufactur-ing, 6) Retail Trade, 7) Services, 8) Transportation, Communications, Electric, Gas
and Sanitary service, and 9) Wholesale Trade. We disaggregate the divisions that turn out
to be crucial further into industries and subindustries. For each major division (and relevant
industries) we construct a patent-based innovation index following the same procedure as with
the aggregate index, i.e. summing the valuations of all patents from that particular division
(industry). We then repeat the same exercise as in the previous two subsections, replacing the
aggregate index with a division (industry) index.
Our industry evidence suggests that patenting activity in manufacturing is most relevant for
explaining observed aggregate movements. Within manufacturing, the most important
indus-tries areElectronic and Other Electrical Equipment and Components, Except Computer
Equip-ment (electronic/electrical), followed by Industrial And Commercial Machinery And Computer
Equipment (machinery), and Chemicals And Allied Products (chemicals).22 These three
in-dustries account for 63% of the total number (and 64% of the total value) of all patents in
Manufacturing.23
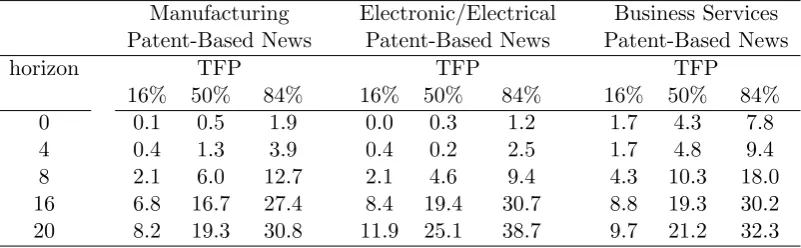
Figure 7 displays the responses of aggregate productivity to a positive shock to the
man-ufacturing patent-based index (left panel) and to the electronic/electrical patent-based news
22This result is in line withVukoti´c(2019) who shows that aggregate news shocks propagate mainly through
the durable goods industries within manufacturing.
23Electronics account for 29% (number) and 22% (value), machinery for 17% (number) and 20% (value), and
shock (middle panel). In both cases, aggregate TFP does not increase on impact, takes time
to become significant, and converges to a new higher value. This pattern is somewhat more
pronounced when only patents in electronic/electrical are considered. In particular, TFP takes
almost two years to become significantly different from zero, then slowly converging to a higher
value, 0.4. Notice that this increase is higher than when all patents in the sample are considered.
This result suggests that the patenting activity in manufacturing, and in electronic/electrical
in particular, carries important information about future movements in the aggregate TFP.
This assertion is confirmed by looking at the FEV of TFP due to these two shocks, which is
displayed in Table 2; the manufacturing news shock explains 19%, and the electronic/electrical
[image:21.595.123.514.280.381.2]news shock explains 25% of the FEV of TFP after 20 quarters.
Figure 7Effects of Disaggregated Patent-Based News Shocks on TFP
TFP to Manufacturing News
4 8 12 16 20
Horizon (quarters) 0 0.05 0.1 0.15 0.2 0.25 0.3 0.35 0.4 0.45 percent
TFP to Electronic/Electrical News
4 8 12 16 20
Horizon (quarters) -0.1 0 0.1 0.2 0.3 0.4 0.5 0.6 percent
TFP to Business Services News
4 8 12 16 20
Horizon (quarters) 0 0.05 0.1 0.15 0.2 0.25 0.3 0.35 0.4 0.45 percent
Note: The blue solid lines are the estimated impulse responses to a manufacturing division patent-based news shock (left panel), an electronic/electrical industry patent-patent-based news shock (middle panel), and a business services industry patent-based news shock (right panel). The unit of the vertical axis is the percentage deviation from the situation without a shock. The responses originate from a VAR composed of the following: the manufacturing patent-based innovation index (left panel), the electronic/electrical based innovation index (middle panel), the business services patent-based innovation index (right panel), and TFP, GDP, consumption, investment, hours, inflation, the federal funds rate, consumer confidence, and the stock price index in all three panels. The time period is from 1961:Q1 to 2010:Q4. The dashed red lines represent +/- one standard deviation confidence bands obtained by drawing from the posterior.
Appendix Cpresents the responses of other macroeconomic variables to these shocks. The
responses are even more pronounced than in the case of the benchmark aggregate patent-based
news shocks, as can be seen in Figure C1. The same pattern holds with the FEV of output,
consumption, investment, and hours, as shown in Table C1. The most interesting result is
that the electronic/electrical patent-based news shock explains large portions of the FEV of
output (18% after 20 quarters), consumption (23% after 20 quarters), investment (28% after
20 quarters), and hours (12% after 20 quarters). Patenting activity in these few industries,
therefore, proves to be crucial not only for explaining future movements in TFP, but also in
other macroeconomic variables.
The most relevant subindustry within the electronic/electrical industry is Semiconductors
and Related Devices; this subindustry accounts for 25% of the total number (and 35% of the
total value) of all patents in electronic/electrical. In addition, it accounts for 70 out of top 100
valued manufacturing patents. All of these 70 patents belong to Cisco. Other companies that
Table 2 Distribution of the Forecast Error Variance of TFP
Manufacturing Electronic/Electrical Business Services Patent-Based News Patent-Based News Patent-Based News
horizon TFP TFP TFP
16% 50% 84% 16% 50% 84% 16% 50% 84% 0 0.1 0.5 1.9 0.0 0.3 1.2 1.7 4.3 7.8 4 0.4 1.3 3.9 0.4 0.2 2.5 1.7 4.8 9.4 8 2.1 6.0 12.7 2.1 4.6 9.4 4.3 10.3 18.0 16 6.8 16.7 27.4 8.4 19.4 30.7 8.8 19.3 30.2 20 8.2 19.3 30.8 11.9 25.1 38.7 9.7 21.2 32.3
Note: The table reports distribution of forecast error variance of TFP explained by the manufacturing division patent-based news shock, by the electronic/equipment industry patent-based news shock, and by the business services patent-based news shock at different horizons – namely at 0, 4, 8, 16, and 20 quarters.
dominated by EMC Corporation, while top patents in chemicals are dominated by Pfizer.
Another division that proves to be relevant for explaining movements in the aggregate TFP
is Services, with Business Services representing 93% of all services patents. In what follows we
show the results considering only business services patent-based news shocks.
The right panel of Figure 7 displays the response of the aggregate TFP to the business
services patent-based news shock, while the right panel of Table 2 displays the FEV of TFP
explained by this shock. TFP significantly increases on impact, but follows a similar shape as
in the case of manufacturing and electronic/electrical news; it slowly decreases after the initial
impact before approaching a new higher level, 0.3. The shock explains about 5% of short-run
movements in TFP and about 21% after 20 quarters.
The reason why TFP jumps on impact most likely related to the nature of patents in
this industry. In particular, the most relevant subindustry is Computer Programming, Data
Processing, And Other Computer Related Services which accounts for 80% of the total number
of patents in business services. The companies that lead the way in this subindustry are
Microsoft, accounting for 32%, and Oracle, accounting for 11% of the total value of patents.
Therefore, it is highly likely that most patents that are closely related to programming and
data processing get implemented much faster than manufacturing patents, where sophisticated
products/processes take longer to bring to the market. This result also explains why the
aggregate shock induces a mild, although barely significant, positive effect on TFP on impact,
as shown in Figure 5.
5
Discussion
In this section we investigate how our patent-based news shock compares to news shocks
identified using methods based on maximizing the variance decomposition of TFP and with
shocks to widely used forward-looking variables, consumer confidence and aggregate stock price
5.1
Relation to TFP-Based News Shocks
While patent-based news shocks are likely to represent a lower bound of the importance
of true news shocks, the shocks identified using maximum variance decomposition of TFP are
likely to represent an upper bound. It is, therefore, worth discussing the difference between
them.
As pointed out by Barsky and Sims (2011), other structural shocks that can affect
produc-tivity in the future and not immediately, such as research and development shocks,
investment-specific shocks, or re-allocative shocks, would be confounded with true news shocks when
max-imum variance decomposition of TFP is used, thus misrepresenting the importance of news
shocks in driving the business cycle. This is not the case with our identification method, as we
do not use TFP to identify the shock and only concentrate on unexpected movements in values
of patents after they are granted.
In addition, Barsky et al. (2015) andSims (2016) indicate that the variance decomposition
is likely to overstate the effects of news shocks. In particular, to isolate the independent
contribution of “pure” news shocks, one has to separate movements due solely to expected
changes in fundamentals from movements due to change in fundamentals when the anticipated
change actually occurs. For example, using a DSGE model setting as in Schmitt-Groh´e and
Uribe (2012), Sims (2016) shows that “pure” news shocks explain between 2 and 9 percent of
the variance of the level of output at business cycle frequencies, whereas “realized” news shocks
explain between 20 and 40 percent. Furthermore, using a SVAR approach,Barsky et al.(2015)
document that responses of consumption, investment, and hours are cut roughly in half when
only the “pure” news component is isolated.
Our results are less susceptible to this criticism, because the response of TFP to a
patent-based news shock unconditionally resembles a slow diffusion process. This path is in line
with the concrete examples we presented before. The slow technology diffusion induced by a
patent starts with the patent grant and public disclosure of the information contained therein,
with next movers commonly using this information and applying it to develop new products
or processes. A release of a patent, therefore, can be thought of as representing a basis for
subsequent patented and nonpatented technological improvements.
Nevertheless, it warrants to directly compare our recovered patent-based news shock with the
most commonly used TFP-based news shock – the news shock identified using the identification
proposed by Barsky and Sims (2011).
The top panel of Figure8displays the two series and they appear to be quite correlated. We
confirm this assertion in Table3(row 1): the correlation between patent-based news shocks and
Barsky and Sims news shocks is 0.61. Given that Barsky and Sims’ TFP-based identification
scheme maximizes FEV of TFP over 40 quarters, we isolate two components of the economic
cycle, a high-frequency component (fluctuations between 2 and 6 quarters) and an extended
decompo-Figure 8Patent-Based News Shocks vs TFP-Based News Shocks
1965 1970 1975 1980 1985 1990 1995 2000 2005 2010 -3
-2 -1 0 1 2 3
Unfiltered Series
1965 1970 1975 1980 1985 1990 1995 2000 2005 2010 -2
-1 0 1 2
Filtered Series: Extended Business-Cycle Frequency
Patent-Based News Shocks Barsky and Sims News Shocks
Note: The top panel displays unfiltered series of patent-based news shocks and news shocks arising from the identification proposed byBarsky and Sims(2011). The bottom panel represents the same two series filtered at extended business-cycle frequency (fluctuations between 6 and 40 quarters). The cyclical component is isolated using the band-pass filter.
sition helps us to understand the degree of comovement between the two series at different
horizons.24 In the bottom panel of Figure 8 we display the extended business-cycle frequency
component of the two series.
When cleaned from high frequency fluctuations the two series appear to be even more
cor-related. This can be more formally seen in Table 3(rows 2 and 3) where we report correlations
at different components of the cycle; the correlation between our patent-based news shocks
and Barsky and Sims news shocks at extended business-cycle frequency amounts to 0.70. This
result is quite encouraging considering that our identification strategy does not rely on any
maximization of FEV of TFP at any horizon, yet it is lower frequencies at which it seems to be
more correlated with the series that, by definition, focuses both on high and low frequencies.
These results further confirm that our procedure picks up shocks that are closely related
to future improvements in technology, but overcoming criticisms of widely used TFP-based
identification schemes at the same time.
24Instead of using business-cycle frequency as usually defined in the literature as fluctuations between 6 and
[image:24.595.166.435.92.336.2]Table 3Correlation of Patent-Based News Shocks with TFP-Based News Shocks at Different Frequencies
Frequency Barsky and Sims
News Shocks
Unconditional 0.61
High-Frequency, 2-6 quarters 0.56 Extended Business-Cycle Frequency, 6-40 quarters 0.70
Note: The table reports correlations, at different frequencies, of patent-based news shocks with news shocks arising from the identification proposed by Barsky and Sims (2011). The cyclical component is isolated using the band-pass filter.
5.2
Relation to Innovations in Forward-Looking Variables
The necessity of using forward-looking variables to capture agents’ expectations about future
developments in economic activity, and TFP in particular, has been well recognized in the news
literature. For example, Beaudry and Portier(2006) focus on a surprise shock to the aggregate
stock price index that is orthogonal to innovations in TFP, and they show that it explains
a large portion of business cycle fluctuations. Using different approaches, Barsky and Sims
(2012) and Barsky et al. (2015) claim that an innovation to consumer confidence to a large
extent represents a technological news shock.
Considering these results, we compare responses to our patent-based news shock with shocks
that explain the most impact variations in two aggregate forward-looking variables: stock prices
and consumer confidence.25 We refer to these two shocks as stock price shock and consumer
confidence shock, respectively.
Stock price index and consumer confidence are likely to reflect beliefs about economic
fun-damentals in general, and not only about future technological prospects. As discussed earlier,
movements in these two forward-looking variables, and especially in consumer confidence, might
also reflect autonomous fluctuations in beliefs not related to economic fundamentals, such as
sentiment and animal spirits.26 Below we provide some indicative evidence in support of this
assertion.
We argue that fluctuations in the stock market value of the firms in a short time period
around the patent grant date are less susceptible to this criticism and, therefore, are more likely
to reflect true beliefs about future technological prospects. To this end, the top panel of Figure
9displays responses of TFP to positive patent-based news, stock price and consumer-confidence
shocks. The bottom panel displays the share of TFP’s forecast error variance explained by these
three shocks, respectively.
25We use the same procedure explained in Section 3 to identify stock price shock and consumer confidence
shocks. Namely, we order stock price (consumer confidence) first in the VAR composed of the same 10 vari-ables as above and recover the shock that maximizes the forecast error variance of the stock price (consumer confidence).
26This literature usually views these autonomous fluctuations as having a causal effect on economic activity
and the business cycle. See, for example,Barsky and Sims(2012),Angeletos and La’O(2013),Benhabib et al.
Figure 9Response and Variance Decomposition of TFP to Patent-Based News, Stock Price and Consumer Confidence Shocks
Note: The top panel represents responses of TFP to a patent-based news shock (left), stock price shock (middle) and consumer confidence shock (right). Median responses to a patent-based news shock are represented by blue solid lines, and red dashed lines represent +/- one standard deviation confidence bands. Patent-based innovation index is ordered first in the VAR. Median responses to a stock price (consumer confidence) shock are represented by brown (yellow) dash-dotted line, while the brown (yellow) shaded area represents +/- one standard deviation confidence bands. Stock price (consumer confidence) is ordered first in the VAR. The bottom panel represents a corresponding forecast error variance share of TFP due to a patent-based news shock (left), stock price shock (middle) and consumer confidence shock (right). The time period is from 1961:Q1 to 2010:Q4.
Two observations regarding the TFP’s behavior in response to these three shocks stand out.
First, the coverage bands of the impact response to a patent-based news shock do not rule
out a zero effect, and this is almost unchanged during the first year after which TFP slowly
starts to take off. TFP raises mildly in response to a stock price shock and quite significantly in
response to a consumer confidence shock. To illustrate this point further, in Figure10we show
the whole distribution of the effect on impact on TFP after these three shocks. The median
effect of the patent-based news shock is closer to zero than the stock price and the consumer
confidence shocks. It is also clear that the distribution generated by the patent-based news
shock incorporates zero, and, in the case of the other two shocks, the zero outcome seems to
be a tail event.
Second, the forecast error variance decomposition reveals that it is the patent-based news
shock that explains the largest share of the variance of TFP after a five-year period. This
result, together with the fact that the patent-based index Granger causes TFP as documented
above, is suggestive that the information contained in the patent-based index is an important
force behind the TFP diffusion.
The responses of other macroeconomic variables that we considered previously are displayed
in Figure11. Output, consumption, investment and hours overall respond more to a stock price
shock, and to a consumer confidence shock in particular, than to a patent-based news shock.
The effect of consumer-confidence shock is the longest lasting.