Munich Personal RePEc Archive
When does Innovation Matter for
Exporting?
Blyde, Juan and Iberti, Gonzalo and Mussini, Micaela
Inter-American Development Bank
23 January 2015
Online at
https://mpra.ub.uni-muenchen.de/61574/
When does Innovation Matter for Exporting?
Juan Blyde Gonzalo Iberti Micaela Mussini
Inter-American Development Bank Chilean Ministry of Finance Inter-American Development Bank
This version: January, 2015
ABSTRACT
A growing number of studies that look at the relationship between innovation and exports find that more innovation tends to allow firms to export more. But very little is known about the heterogeneous impacts of innovation on exports. Since innovation is not a costless activity, it is important to know the specific situations in which a firm most likely needs to innovate to raise its exports. Using data from Chile, we combine information on innovation activities at the firm level with a rich dataset on exports at the transaction level. We find that the firms that engage in innovation tend to export more than other firms because they are able to sell goods and target markets that reward innovation. We show that the goods and markets in which innovative exporters outperform non-innovative exporters are those where innovation can lead to substantial differences in terms of quality. Innovative firms do not have an edge in exporting goods and in targeting markets that do not reward innovation. In particular, innovative firms do not outperform non-innovative firms when exporting goods and penetrating markets in which differentiation in terms of quality is not possible or not relevant.
JEL No. F10, F14, O30
Key words: innovation, exports, product quality
. The views and interpretations in this paper are strictly those of the authors and should not be attributed to the Inter-American Development Bank, its Board of Directors, or any of its member countries
1. Introduction
There is a growing literature on the relationship between innovation and exports. Many studies that carefully control for potential endogeneity biases find that more innovation allows firms to eventually export more (Lachenmaier and Wößmann, 2006; Aw et al., 2007; Damijan et al.., 2008; Van Beveren and Vandenbussche, 2010; Caldera, 2010; Becker and Egger, 2013). But very little is known about the heterogeneous impacts on exports when firms perform innovation. For instance, does innovation increase all the exports of the firm or only the exports of certain goods? Does the increase in exports occur in all the markets that a firm serves or only in particular markets? If the increase in exports occurs only in certain markets, do the exports of all the goods serving those markets increase, or only a subset of those goods? Until now, these questions have remained unanswered because the studies available in the literature have looked at the effect of innovation on crude measures of firm exports, either total exports or the export status. But addressing these questions can provide new insights into why innovation is relevant for exporting. For example, innovation might be important only when a firm seeks to penetrate certain markets, say high income countries. Likewise, exporting certain goods might require more innovative efforts than exporting others. Since innovation is not a costless activity, it is then relevant to analyze in detail the specific situations in which a firm most likely needs to innovate to raise its exports. This is the objective of this paper.
Using data from Chile, we combine information on innovation activities at the firm level with a rich dataset on exports at the transaction level. By merging these two datasets we identify at very disaggregated levels what type of goods innovative firms export and where. Our contribution to the literature it to analyze not only if innovative firms export more than non-innovative firms but also whether there are heterogeneous effects in terms of the type of goods that they export and the destination markets that they serve. The dataset also allows us to examine whether the potential increase in exports is channeled through a price or a quantity effect. This gives us another dimension to delve into the question of why innovation is important to export.
These results are robust to a series of tests. We show that the findings hold after controlling for potential reverse causality, after using different specifications of the econometric model, and after employing alternative definitions of the innovation variable.
Our study contributes to two different literatures. First, it extents the current body of analyses that use broad measures of exports (Lachenmaier and Wößmann, 2006; Aw et al., 2007; Damijan et al.., 2008; Van Beveren and Vandenbussche, 2010; Caldera, 2010 and Becker and Egger, 2013; Bravo-Ortega et al., 2013) to examine the impact of innovation across detailed dimensions of the export activity. Second, the study contributes to a growing literature that shows the importance of skill acquisition for exporting to high-income countries (Brambilla et al., 2012; Verhoogen, 2008; Matsuyama, 2007). Our analysis extends this notion to the role of innovation.
The rest of the paper is divided as follows. Section 2 provides a brief summary of the literature on innovation and trade and explains the contribution of our analysis to this literature. In this section we also introduce the econometric model. Section 3 describes the various datasets that we employ in the study. Section 4 discusses the empirical results while section 5 finalizes with some concluding remarks.
2. Previous studies and empirical specification
The relationship between innovation and international trade has been the subject of many studies, both theoretically and empirically. The empirical analyses that study the relationship between innovation and exports typically find a positive correlation between these two variables, but whether innovation causes exports has not always been carefully examined.
Recent contributions to the literature have started to control for the potential estimation biases that reverse causality could create when addressing the relationship between innovation and exports (Lachenmaier and Wößmann, 2006; Aw et al., 2007; Damijan et al.., 2008; Van Beveren and Vandenbussche, 2010; Caldera, 2010 and Becker and Egger, 2013). While different techniques have been used to control for this endogeneity issue, most studies find that innovation efforts tend to translate into larger exports. In the particular context of the Chilean economy, for example, Bravo-Ortega et al., (2013) find that firms that invest in R&D are more likely to export, but the reverse is not true.
Empirical specification
We consider the exports of firms at the product and market destination level and exploit variations in innovation effort across those firms. In other words, we compare the export outcomes of the firms that innovate with that of the firms that do not innovate paying particular attention to the destination markets and the types of goods that they export. We start with the following baseline specification:
𝑌𝑖𝑝𝑐 = 𝛽0+ 𝛽1𝑋𝑖+ 𝛽2 𝐿𝑖+ 𝐷𝑝+ 𝐷𝑐+ 𝜀𝑖𝑝𝑐 (1)
where 𝑌𝑖𝑐𝑝 is the exports (in logs) of firm i of product p to destination country c ; 𝑋𝑖 is a dummy variable that
takes the value of one if the firm engages in innovation and zero otherwise; 𝐿𝑖 is the employment level of the firm (in logs); 𝐷𝑝 and 𝐷𝑐 are fixed effects for product p and destination country c, respectively, and 𝜀𝑖𝑝𝑐 is an error term that is white noise. In all the regressions, we employ standard errors clustered by the firm level.
The variable 𝐿𝑖 seeks to capture firm-level factors -different from innovation- that are correlated with exporting. In the recent literature of trade, for example, firm productivity is the single attribute that
determines the firm’s ability to export successfully (e.g. Bernard et al., 2003; Melitz, 2003; Chaney, 2008;
Arkolakis, 2010). Unfortunately, the information in our dataset precludes us to construct a suitable measure of productivity. Accordingly, we use firm size instead, based on a large body of empirical analyses indicating that productivity and firm size are highly correlated (Bernard and Jensen, 1999a, b; Bernard, Jensen and Schott, 2006; Mayer and Ottaviano, 2007).1
The innovation variable in equation (1), 𝑋𝑖, captures both product and process innovations. In other words, the variable is equal to one if the firm engages in either product innovation, process innovation or both. Later in the paper we present specifications in which 𝑋𝑖 captures product and process innovations separately. Another characteristic of our innovation measure is that it captures the outcome of innovation rather than
the firm’s expenditures in R&D. The advantage of using outcome rather than input measures of innovation is
that not all the R&D expenditures of a firm necessarily materialize in actual innovations.
While our empirical analysis is a cross-section, 𝑋𝑖 measures innovations that occurred one year prior to the exports of the firm.2 This implies that the estimations will be capturing the short-run impacts of innovation.
Being an outcome variable, it is not unreasonable to expect that the innovation completed by the firm in one year might show up in the exports of the following year. It is possible; however, that some innovations might
1 In particular, most papers in this literature find that exporting firms are usually both larger and more productive than non-exporting
firms.
take longer to materialize in foreign markets, but this only increases the bar for finding a significant effect in our analysis.
One problem with equation (1) is the possible existence of endogeneity between the exports and the innovation activity of the firm. As mentioned before, the causality between these two variables can go in either direction and not controlling for this issue could introduce a bias in the estimation of 𝛽1. We address this potential endogeneity problem using an instrumental-variable (IV) estimation. In particular, we follow Lachenmaier and Wößmann (2006) and Becker and Egger (2013) and use exogenous innovation impulses taken from the innovation survey that are significantly correlated with the innovation outcome but not with the exports of the firm. These innovation impulses, which we describe in more detail in the next section, are used as instruments for the innovation measure in equation (1). In section 4 we show some formal tests that assess the validity of these variables as instruments.
3. Data description
The information on exports is taken from the Chilean National Customs Authority, Servicio Nacional de Aduanas. The data include the universe of the Chilean exports at the transaction level. Specifically, each record includes a firm identifier, the good exported (at 8-digit HS level), the destination country, the export value in US dollars, the quantity (weight) in kilograms and the unit price. We select the year 2009 from this dataset so there is at least a one year gap between the year of the innovation (described in the next paragraph) and the year of the export. There are 7430 exporters during this year.
The survey includes input measures of innovation, like R&D expenditures, and also output measures, like whether the firm successfully developed an innovation in products or in processes. We use the innovation outcome variables. In particular, we construct a dummy variable equal to one if the firm develops an innovation in products or processes or both (in any of the two years). The dummy is equal to zero if no innovation is performed. After excluding the firms in the service sectors, there are 1498 firms in this dataset.
Similar to other innovation surveys used in the literature, the Chilean survey includes information on the so called exogenous impulses and obstacles to innovation (for the case of Germany, see Lachenmaier and Wößmann, 2006; and Becker and Egger, 2013). These are questions about the relevance that a number of factors have exerted on the innovations carried by the firm. In the Chilean survey there are 6 impulses (or incentives) and 16 obstacles (impediments). The firms are asked to answer these questions with a scale from 1 (not important) to 5 (high important). From all these factors, only 3 impulses were found to have a statistically significant impact on the probability to innovate: cost reduction, quality improvement, and environmental impact reduction. Following the strategy by Lachenmaier and Wößmann (2006) of using this type of factors as instrumental variables, we employ these three impulses in our IV estimation. In the next section we provide tests that determine the suitability of these variables as instruments. While these variables enter the regressions in their original categorical form, but also present results when they are transformed into binary variables.
The innovation survey also includes additional information that is relevant for our exercise, namely, the firm size in terms of employment, the sector (at the 4 digit ISIC rev3 level) and the region where the firm is located.3
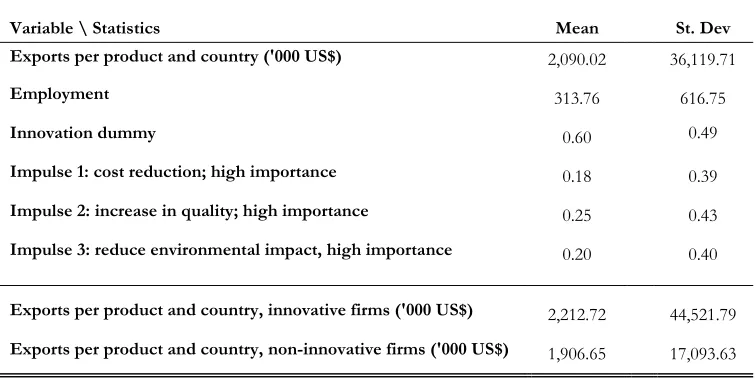
After merging the two datasets on innovation and exports, we have 469 firms. This is the group of firms that we employ in the analysis. Table 1 shows some descriptive statistics for these firms. The typical firm has an average export per product and destination equal to 2.1 million US dollars, and it employs 314 workers. About 60% of the firms in the sample introduced an innovation during the period examined. The percentages of firms indicating that cost reduction, quality increase and environmental impact reduction were highly important determinants to their innovations were 18%, 25% and 20%, respectively. Finally, the last two rows of the table indicate that the average exports per product and country were 2.2 million US dollars for the innovative firms and 1.9 million US dollars for the non-innovative firms.
4. Empirical results
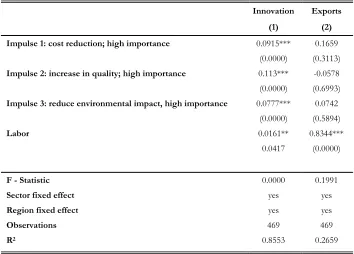
As mentioned before, we employ an IV-estimation to control for potential endegeneity between exports and innovation. In particular, we run a 2-stage least squares regression and employ the impulse variables, cost reduction, quality improvement, and environmental impact reduction, as instruments. Column (1) in table 2 shows the results of the first-stage of the estimation. The coefficients are all positive and significant at conventional levels and the F-statistic suggests that there is not a weak-instrument problem. In column (2) we show a regression in which the impulse variables are used directly as covariates in a regression on exports. In this case, the coefficients are not statistically significant. The results from both columns give support to our choice of instruments: while they affect the innovation outcome, they do not exert a direct impact on exports.
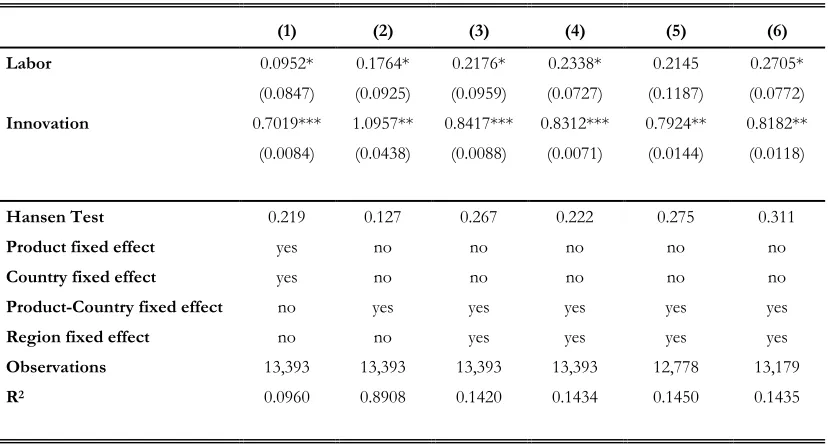
Column (1) of table 3 shows the second stage of the estimation. The Hansen test of overidentifying restrictions shows that we cannot reject the null hypothesis that the instruments are valid, providing further support to our identification strategy. As expected, there is a positive relationship between the level of employment and exports. The impact of innovation on exports is also positive and significant. The size of the effect is economically meaningful. The coefficient implies that firms that engage in innovation tend to export 101% [exp (0.70) – 1] more than the firms that do not engage in innovation. A series of robusteness checks are presented in columns (2) to (6). In particular, column (2) employs a more stringent set of product-country fixed effects instead of product and country fixed effects separately; column (3) includes a region-fixed effect to control for potential locational effects like agglomeration or proximity to other firms or markets; column (4) shows the results when the instruments enter the estimation (on the first stage) as binary variables instead of categorical variables; column (5) drops potential outlier observations, in particular, the exports above the 99th percentile and below the 1st percentile; while column (6) drops potential outlier observations in terms of
labor size, in particular, the firms with employment above the 99th percentile and below the 1st percentile. As
shown, the estimated impact of innovation on exports holds across all these robustness checks.
Heterogeneous effects
valuation for quality. What we would like to do is to explore whether the positive impact of innovation on exports that we found in table 3 is related to this hypothesis that innovative firms penetrate more successfully high income countries for which innovative efforts are more properly rewarded.
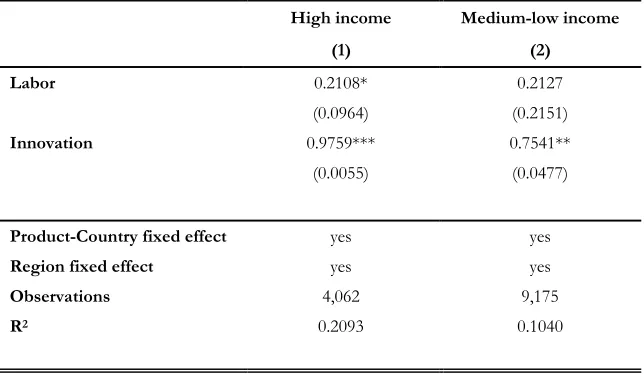
Using the same specification as in column (3) of table 3, table 4 shows the results when we separate the exports in two groups according to the income level of the destination countries. In particular we separate the high income countries from the medium-low income countries. This is done using the World Bank’s country income classification. The first group consists on the World Bank’s high-income OECD category and the second group includes the rest of the countries. The idea is that the insertion into high income countries might be especially difficult, for example, because of their high-valuation for quality, and thus any exporter would need to engage in particularly intensive innovation efforts to successfully penetrate into these markets.4
The results from table 4 show the existence of heterogeneity effects in terms of market destinations. In particular, the effect of innovation on exports is positive and significant in both markets but much more pronounced in high income countries. Specifically, firms that innovate tend to export 1.7 times more [exp(1.029)-1] than firms that do not innovative when they target high income countries, and 1.1 times more [exp(0.751)-1] when they target medium-low income countries. In other words, the edge of innovative firms over non-innovative firms is larger when they penetrate high income countries than when they penetrate the rest of the countries. This result suggests that penetrating high income markets can be particularly difficult and thus the difference in performance between innovative and non-innovative firms is much more evident in these markets than when they target less-challenging destinations. In the next section we explore whether this larger edge of innovative firms when they serve high income countries has to do with the notion that these markets have particularly high valuation for quality and thus large innovation efforts are required to penetrate them successfully.
The second dimension that we explore regarding heterogeneous impacts of innovation on exports is related to the type of goods. For example, the innovation required to develop and export successfully a computer is likely to be different than the innovation efforts required to export a cathode of copper. Accordingly, we would like to explore whether the finding that innovative firms export more is related to the hypothesis that these firms tend to export more successfully some kind of goods that reward innovation, for instance, because innovation can lead to substantial differences in the quality of the good.
It is reasonable to expect that the possibility to make a substantial difference in the quality of the good is likely to be low for raw materials and basic goods. At the extreme, for example, commodities tend to vary only slightly across markets and thus a successful penetration of foreign markets with those goods might not
4 We employ alternative classifications for separating the countries according to their level of development. The results, available from the authors
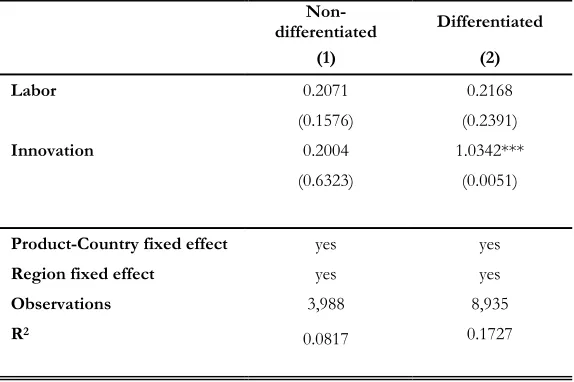
require a great deal of differentiation in terms of quality. Following this notion, we separate all the exports in two groups, differentiated and non-differentiated products, following the classification developed by Rauch (1999). This classification distinguishes among homogeneous goods that are traded in organized exchanges, reference-priced goods that have prices quoted in specialized publications, and differentiated goods that are neither traded in organized exchanges nor have reference prices (i.e., prices do not convey all the relevant information for international trade on these goods). In this analysis, we pool together homogeneous and reference-priced goods and specifically follow the liberal classification.5 The results, shown in table 5, confirm
the existence of heterogeneity in terms of types of goods. In particular, innovative firms tend to export 1.8 times more differentiated goods than innovative firms, but they do not export more of non-differentiated goods. The result suggests that innovative firms are able to sell abroad more than other firms the type of products for which innovation allows them to differentiate their varieties. In the next section we explore whether this differentiation is related to the quality of the good.
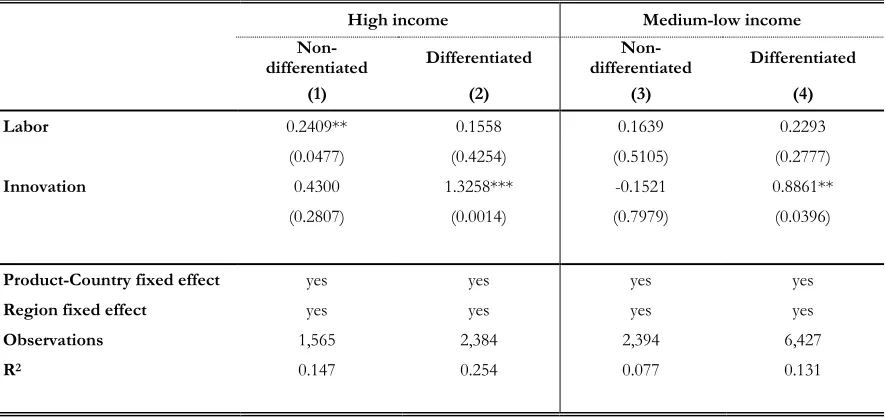
While tables 4 and 5 examined the effects of innovation on exports across goods and destination markets separately, table 6 combine both dimensions. The results show that innovative firms do not export more non-differentiated goods than non-innovative firms when they target either high income countries or the rest of countries (columns 1 and 3). However, innovative firms export more differentiated goods in both markets, with an edge that is larger when targeting high income countries (columns 2 and 4).
Channels
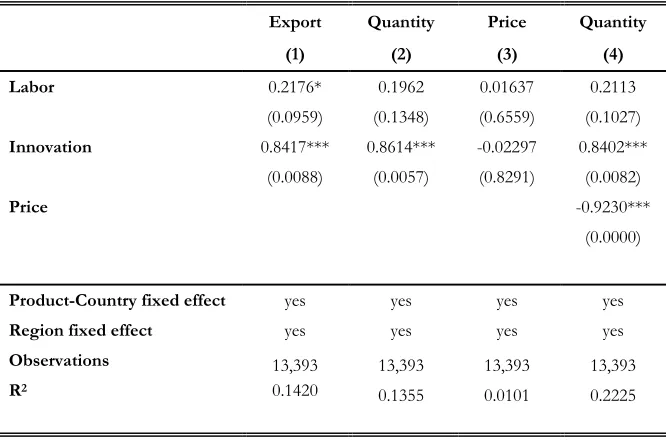
In this section we use additional information from the export database to explore the channels by which the larger exports induced by innovation are achieved. In particular, we examine whether the positive effects of innovation on exports are accrued via higher prices or higher quantities. The results are shown in table 7. For completeness, column (1) shows again the regression on exports. In columns (2) and (3) we use, respectively, the quantities and the prices of those exports as the dependent variables. As shown in the table, the coefficient for the regression on quantity is statistically significant but not the one for the regression on prices. This result indicates that more innovative firms are able to export more than non-innovative firms essentially because they sell more quantities.
If we consider the price of a good as a proxy for its quality, not finding a relationship between innovation and prices could initially be viewed as an indication that the outcome of the innovation is not a higher quality product. But the unit value of a good is not necessarily a good proxy for quality because export prices might vary for reasons other than quality, including differences in cost structures (Hallak and Schott, 2011). In the
context of a cross-country analysis, Hallak and Schott (2011) identify product quality by combining
information on the countries’ trade balances with the observed export prices. The identification strategy that
the authors employed is based on the notion that among countries with identical export prices, the country with the higher trade balance is revealed to possess higher product quality. We apply the same intuition here at the firm level. That is, among two firms with identical export prices, the firm exporting more quantities is revealed to possess a higher product quality. In terms of our estimation, this is akin to re-running the regression on quantities after controlling for differences in prices. This is done in column (4) of table 7. The result shows that innovative firms sell more quantities abroad than non-innovative firms, even after holding prices constant. This implies that innovative firms are able to penetrate foreign markets with larger quantities of exports because their exports are associated with higher quality goods.
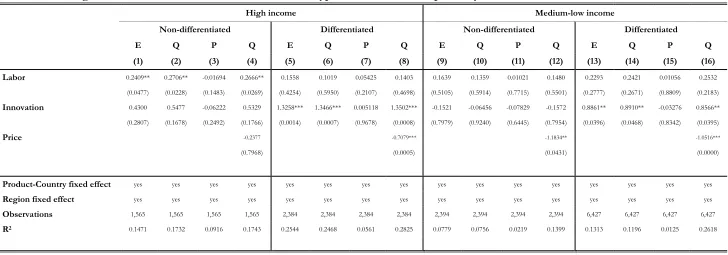
In table 8 we show that the penetration of foreign markets by innovative firms with larger quantities of high quality exports is relevant only for the case of differentiated goods (columns 8 and 16) but not when firms export non-differentiated products (columns 4 and 12). This evidence is important because it indicates that investing in innovation provides an edge in penetrating foreign markets only in goods in which innovation leads to substantial differentiation in terms of quality. The table also shows that the difference between innovative and non-innovative firms when exporting differentiated goods is even larger when targeting high income countries than when serving medium-low income countries (column 8 versus 16). This last result gives support to the idea that there is a higher valuation for quality in high income countries than in the rest of the countries.
Types of innovation
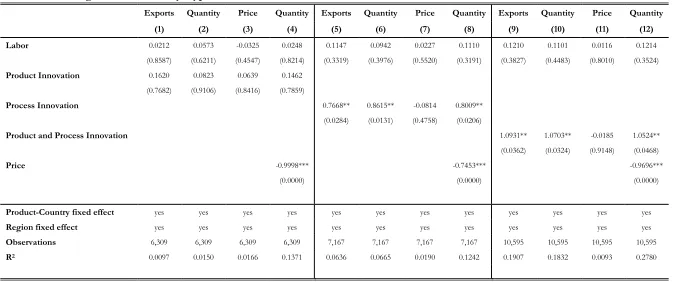
In the last part of this study we explore whether there are heterogeneous effects regarding the type of innovations that the firm performs. So far, we have lumped in the same variable the innovations in either products, processes or both; but further insights could be potentially gained by estimating separate effects for these two classes of innovations. This is done in table 9 in which we show the impacts not only for export values but also for quantities, prices and quantities after controlling for price differences (our proxy for quality). The structures of the regressions are as follows: columns (1) to (4) analyze the firms that only performed product innovation; columns (5) to (8) analyze the firms that only performed process innovation, and columns (9) to (12) analyze the firms that performed both types of innovations at the same time. In all the cases, the control group is the same, that is, the firms that did not perform any innovation.
innovation. Indeed, we find that the effect of innovation on exports is not statistically different between the non-innovative firms and the firms that only perform product innovations. The table also shows that the synergy effects -- the relatively larger edge of innovative firms over non-innovative firm when performing both types of innovation-- transpire not only in terms of the export values but also in terms of quantities as well as in the proxy for quality.
5. Concluding remarks
Innovation is not a costless activity. Therefore, firms investing in R&D expect to generate a return. Such return could be accrued, at least partially, by selling products abroad. But firms targeting foreign markets must face the competition from other exporters; therefore, the outcome of their innovation must give them an edge in those markets.
In this paper we show that the firms that engage in innovation tend to export more than other firms because they are able to sell goods and target markets that reward innovation. Innovative firms do not have an edge in exporting goods and in targeting markets that do not reward innovation. We show that the goods in which innovative exporters outperform non-innovative exporters are those where innovation can lead to substantial differences in terms of quality. Innovative firms do not export more the types of goods in which differentiation in terms of quality is not possible or not relevant. Similarly, we show that innovative firms have a larger edge over non-innovative firms in highly-developed countries where the high-valuation for quality means that the outcome of the innovation is more properly rewarded.
References
Arkolakis, C. and Muendler, M. (2010) The Extensive Margin of Exporting Products: A Firm-level Analysis, NBER Working Papers 16641, National Bureau of Economic Research, Inc.
Aw, B. Y., Roberts, M. J. and Winston, T. (2007) Export Market Participation, Investments in R&D and Worker Training, and the Evolution of Firm Productivity, The World Economy, Wiley Blackwell, vol. 30(1), pages 83-104, 01.
Becker, S. and Egger, P. (2013) Endogenous product versus process innovation and a firm’s propensity to export, Empirical Economics, Springer, vol. 44(1), pages 329-354, February.
Bernard, A. and B. Jensen (1999a): “Exceptional Exporter Performance: Cause, Effect, or Both?” Journal of
International Economics, 47, 1-25
Bernard, A. and B. Jensen (1999b): “Exporting and Productivity” NBER Working Paper No. 7135
Bernard, A. B., Jensen,J. B. and Schott, P. K. (2003) Falling Trade Costs, Heterogeneous Firms, and Industry Dynamics, NBER Working Papers 9639, National Bureau of Economic Research, Inc.
Bernard, A., B. Jensen, and P. Schott (2007): “Trade Costs, Firms and Productivity”, Journal of Monetary
Economics 53: 917-37
Brambilla, I., Lederman, D. and Porto, G. (2012) Exports, Export Destinations, and Skills, American Economic Review, American Economic Association, vol. 102(7), pages 3406-38, December.
Bravo-Ortega, C., Benavente, J. M. and González, A. (2014) Innovation, Exports, and Productivity: Learning and Self-Selection in Chile, Emerging Markets Finance and Trade, M.E. Sharpe, Inc., vol. 50(1S), pages 68-95, January.
Caldera, A. (2010) Innovation and exporting: evidence from Spanish manufacturing firms, Review of World Economics (Weltwirtschaftliches Archiv), Springer, vol. 146(4), pages 657-689, December.
Chaney, T. (2008) Distorted Gravity: The Intensive and Extensive Margins of International Trade, American Economic Review, American Economic Association, vol. 98(4), pages 1707-21, September.
Damijan, J. P., Kostevc, Č. and Polanec, S. (2010) From Innovation to Exporting or Vice Versa?, The World
Economy, Wiley Blackwell, vol. 33(3), pages 374-398, 03.
Garicano, L., Lelarge, C. and Van Reenen, J. (2012) Firm Size Distortions and the Productivity Distribution: Evidence from France, CEP Discussion Papers dp1128, Centre for Economic Performance, LSE.
Hallak, J. C. and Schott, P. K. (2011) "Estimating Cross-Country Differences in Product Quality," The Quarterly Journal of Economics, Oxford University Press, vol. 126(1), pages 417-474.
Mayer, T. and G. Ottaviano (2007) “The Happy Few: The Internationalization of European firms”, Bruegel Blueprint 3, Brussels (Belgium)
Melitz, M. J. (2003) The Impact of Trade on Intra-Industry Reallocations and Aggregate Industry Productivity, Econometrica, Econometric Society, vol. 71(6), pages 1695-1725, November.
Stefan, L. and Wößmann, L. (2006) Does innovation cause exports? Evidence from exogenous innovation impulses and obstacles using German micro data, Oxford Economic Papers, Oxford University Press, vol. 58(2), pages 317-350, April.
Sun, C. and Zhang, T. (2012) Export, Productivity Pattern, and Firm Size Distribution, MPRA Paper 36742, University Library of Munich, Germany.
Van Beveren, I. and Vandenbussche, H. (2010) Product and process innovation and firms' decision to export, Journal of Economic Policy Reform, Taylor and Francis Journals, vol. 13(1), pages 3-24.
Table 1: Descriptive statistics
Variable \ Statistics Mean St. Dev
Exports per product and country ('000 US$) 2,090.02 36,119.71
Employment 313.76 616.75
Innovation dummy 0.60 0.49
Impulse 1: cost reduction; high importance 0.18 0.39
Impulse 2: increase in quality; high importance 0.25 0.43
Impulse 3: reduce environmental impact, high importance 0.20 0.40
Exports per product and country, innovative firms ('000 US$) 2,212.72 44,521.79
Exports per product and country, non-innovative firms ('000 US$) 1,906.65 17,093.63
Table 2: First Stage Results
Innovation Exports
(1) (2)
Impulse 1: cost reduction; high importance 0.0915*** 0.1659
(0.0000) (0.3113)
Impulse 2: increase in quality; high importance 0.113*** -0.0578
(0.0000) (0.6993)
Impulse 3: reduce environmental impact, high importance 0.0777*** 0.0742
(0.0000) (0.5894)
Labor 0.0161** 0.8344***
0.0417 (0.0000)
F - Statistic 0.0000 0.1991
Sector fixed effect yes yes
Region fixed effect yes yes
Observations 469 469
R2 0.8553 0.2659
Note: Robust standard errors clustered by firms reported in parentheses
Table 3: Second Stage Results
(1) (2) (3) (4) (5) (6)
Labor 0.0952* 0.1764* 0.2176* 0.2338* 0.2145 0.2705*
(0.0847) (0.0925) (0.0959) (0.0727) (0.1187) (0.0772)
Innovation 0.7019*** 1.0957** 0.8417*** 0.8312*** 0.7924** 0.8182**
(0.0084) (0.0438) (0.0088) (0.0071) (0.0144) (0.0118)
Hansen Test 0.219 0.127 0.267 0.222 0.275 0.311
Product fixed effect yes no no no no no
Country fixed effect yes no no no no no
Product-Country fixed effect no yes yes yes yes yes
Region fixed effect no no yes yes yes yes
Observations 13,393 13,393 13,393 13,393 12,778 13,179
R2 0.0960 0.8908 0.1420 0.1434 0.1450 0.1435
Note: Robust standard errors clustered by firms reported in parentheses
Table 4: Heterogeneous Effects on Destination Markets
High income Medium-low income
(1) (2)
Labor 0.2108* 0.2127
(0.0964) (0.2151)
Innovation 0.9759*** 0.7541**
(0.0055) (0.0477)
Product-Country fixed effect yes yes
Region fixed effect yes yes
Observations 4,062 9,175
R2 0.2093 0.1040
Note: Robust standard errors clustered by firms reported in parentheses
Table 5: Heterogeneous Effects on Types of Goods
Non-differentiated Differentiated
(1) (2)
Labor 0.2071 0.2168
(0.1576) (0.2391)
Innovation 0.2004 1.0342***
(0.6323) (0.0051)
Product-Country fixed effect yes yes
Region fixed effect yes yes
Observations 3,988 8,935
R2
0.0817 0.1727
Note: Robust standard errors clustered by firms reported in parentheses
Table 6: Heterogeneous Effects on Destination Markets and Types of Goods
High income Medium-low income
Non-differentiated Differentiated
Non-differentiated Differentiated
(1) (2) (3) (4)
Labor 0.2409** 0.1558 0.1639 0.2293
(0.0477) (0.4254) (0.5105) (0.2777)
Innovation 0.4300 1.3258*** -0.1521 0.8861**
(0.2807) (0.0014) (0.7979) (0.0396)
Product-Country fixed effect yes yes yes yes
Region fixed effect yes yes yes yes
Observations 1,565 2,384 2,394 6,427
R2 0.147 0.254 0.077 0.131
Note: Robust standard errors clustered by firms reported in parentheses
Table 7: Channels
Export Quantity Price Quantity
(1) (2) (3) (4)
Labor 0.2176* 0.1962 0.01637 0.2113
(0.0959) (0.1348) (0.6559) (0.1027)
Innovation 0.8417*** 0.8614*** -0.02297 0.8402***
(0.0088) (0.0057) (0.8291) (0.0082)
Price -0.9230***
(0.0000)
Product-Country fixed effect yes yes yes yes
Region fixed effect yes yes yes yes
Observations 13,393 13,393 13,393 13,393
R2 0.1420 0.1355 0.0101 0.2225
Note: Robust standard errors clustered by firms reported in parentheses
Table 8: Heterogeneous Effects on Destination Markets and Types of Goods, Decomposed by Channels
High income Medium-low income
Non-differentiated Differentiated Non-differentiated Differentiated
E Q P Q E Q P Q E Q P Q E Q P Q
(1) (2) (3) (4) (5) (6) (7) (8) (9) (10) (11) (12) (13) (14) (15) (16)
Labor 0.2409** 0.2706** -0.01694 0.2666** 0.1558 0.1019 0.05425 0.1403 0.1639 0.1359 0.01021 0.1480 0.2293 0.2421 0.01056 0.2532
(0.0477) (0.0228) (0.1483) (0.0269) (0.4254) (0.5950) (0.2107) (0.4698) (0.5105) (0.5914) (0.7715) (0.5501) (0.2777) (0.2671) (0.8809) (0.2183)
Innovation 0.4300 0.5477 -0.06222 0.5329 1.3258*** 1.3466*** 0.005118 1.3502*** -0.1521 -0.06456 -0.07829 -0.1572 0.8861** 0.8910** -0.03276 0.8566**
(0.2807) (0.1678) (0.2492) (0.1766) (0.0014) (0.0007) (0.9678) (0.0008) (0.7979) (0.9240) (0.6445) (0.7954) (0.0396) (0.0468) (0.8342) (0.0395)
Price -0.2377 -0.7079*** -1.1834** -1.0516***
(0.7968) (0.0005) (0.0431) (0.0000)
Product-Country fixed effect yes yes yes yes yes yes yes yes yes yes yes yes yes yes yes yes
Region fixed effect yes yes yes yes yes yes yes yes yes yes yes yes yes yes yes yes
Observations 1,565 1,565 1,565 1,565 2,384 2,384 2,384 2,384 2,394 2,394 2,394 2,394 6,427 6,427 6,427 6,427
R2 0.1471 0.1732 0.0916 0.1743 0.2544 0.2468 0.0561 0.2825 0.0779 0.0756 0.0219 0.1399 0.1313 0.1196 0.0125 0.2618
Note: E (exports), P (price) and Q (quantity). Robust standard errors clustered by firms reported in parentheses
Table 9: Heterogeneous Effects by Type of Innovation
Exports Quantity Price Quantity Exports Quantity Price Quantity Exports Quantity Price Quantity
(1) (2) (3) (4) (5) (6) (7) (8) (9) (10) (11) (12)
Labor 0.0212 0.0573 -0.0325 0.0248 0.1147 0.0942 0.0227 0.1110 0.1210 0.1101 0.0116 0.1214
(0.8587) (0.6211) (0.4547) (0.8214) (0.3319) (0.3976) (0.5520) (0.3191) (0.3827) (0.4483) (0.8010) (0.3524)
Product Innovation 0.1620 0.0823 0.0639 0.1462
(0.7682) (0.9106) (0.8416) (0.7859)
Process Innovation 0.7668** 0.8615** -0.0814 0.8009**
(0.0284) (0.0131) (0.4758) (0.0206)
Product and Process Innovation 1.0931** 1.0703** -0.0185 1.0524**
(0.0362) (0.0324) (0.9148) (0.0468)
Price -0.9998*** -0.7453*** -0.9696***
(0.0000) (0.0000) (0.0000)
Product-Country fixed effect yes yes yes yes yes yes yes yes yes yes yes yes
Region fixed effect yes yes yes yes yes yes yes yes yes yes yes yes
Observations 6,309 6,309 6,309 6,309 7,167 7,167 7,167 7,167 10,595 10,595 10,595 10,595
R2 0.0097 0.0150 0.0166 0.1371 0.0636 0.0665 0.0190 0.1242 0.1907 0.1832 0.0093 0.2780
Note: Robust standard errors clustered by firms reported in parentheses