Oxidation Behavior of Au-55 mol
%
Ti High Temperature Shape
Memory Alloy during Heating in Ar-50 vol
%
O
2Environment
Hyunbo Shim
1,+, Masaki Tahara
1, Tomonari Inamura
1, Kenji Goto
2,
Yoko Yamabe-Mitarai
3and Hideki Hosoda
1,+1Precision and Intelligence Laboratory, Tokyo Institute of Technology, Yokohama 226-8503, Japan 2Tanaka Kikinzoku Kogyo K. K., Hiratsuka 254-0076, Japan
3National Institute of Materials Science, Functional Structure Materials Group, Tsukuba 305-0047, Japan
Oxidation behavior and subsequent phase decomposition of Au-55 mol%Ti high temperature shape memory alloy are investigated for heating oxidation up to 1773 K in Ar-50 vol%O2using a simultaneous thermogravimetry combined with differential scanning calorimetry
(TG-DSC). Au-55 mol%Ti powder specimen begins to be oxidized at 802 K and the oxidation reaction is most active at 1150 K. Since the oxidation start temperature is comparable to the martensitic transformation temperatures, the oxidation must be a problem for practical high-temperature long-term applications. An equilibrium phase reaction appears near 1346 K which is melting of Au produced by the reaction of AuTi+O2¼Au+TiO2. The oxidation reaction and products assessed by the TG-DSC measurement are in good agreement with those
obtained by X-ray diffraction analysis. [doi:10.2320/matertrans.M2014468]
(Received December 25, 2014; Accepted January 26, 2015; Published March 13, 2015)
Keywords: oxidation behavior, AuTi, high temperature shape memory alloy, thermogravimetry-differential scanning calorimetry (TG-DSC)
measurement
1. Introduction
High temperature shape memory alloys (HTSMAs) have attracted strong attention for aerospace applications, for example. Lots of researches have been done, and some examples reported recently are noted here such as NiTiHf,1)
NiTiZr,2) NiTiPd,3) NiMnGa,4) Ti-Ta-Al5) and PtTi.6) Our
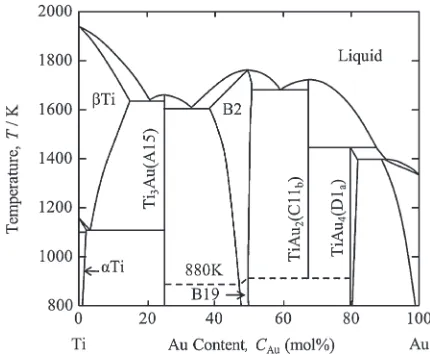
group has focused on AuTi based shape memory alloys for HTSMAs as well as biomaterials since both Au and Ti are biocompatible elements.718)The Au-Ti binary phase diagram
is shown in Fig. 1.19)AuTi is a Berthollide-type compound
and the phase region expands to Ti-rich side widely in comparison with Au-rich side. The phase transition from B2 to B19 occurs at around 880 K. The martensitic trans-formation temperatures of AuTi alloys have been firstly reported by Donkersloot and Van Vucht in 197020)and also reported by other research groups.7,21)In the high temperature structural intermetallic compounds, generally, three important properties should be satisfied for practical applications and they are (1) room temperature ductility, (2) creep resistance (high temperature strength) and (3) oxidation resistance. In this paper, the oxidation resistance is focused on AuTi HTSMA. However, very limited papers have been available on oxidation of AuTi based alloys in the literature. Declairieux and Van Vucht have investigated high temper-ature shape memory behavior in addition to oxidation, and found that AuTi alloy exhibits higher oxidation rates than TiNi, but that AuTi alloy is promising at around 700 K.22) Wadood and coworkers revealed the high temperature shape recovery behavior and oxidation of Zr-added AuTi in addition to binary AuTi using thermo-mechanical analysis, and concluded that oxidation is active at 873 K which is 100 K higher than the austenite finish temperature of Zr-added AuTi, resulting that Zr-Zr-added AuTi is promising for
practical HTSMA.16) Not only oxidation resistance but also
oxidation behavior itself is also important as a surface treatment, since a continuous, rigid and protective titanium oxide layer, which is expected to improve corrosion resistance, biocompatibility and wear resistance, can be formed at surface of Ti-based alloys. Based on the above background, the purpose of this study is quantitative understanding of the oxidation behavior and oxidation reaction of Au-55 mol%Ti powder in Ar-50 vol%O2 using a
simultaneous thermogravimetry combined with differential scanning calorimetry (TG-DSC). The powder specimen possesses larger specific surface area than bulk specimens, and the Ar-50 vol%O2is more severe oxidation environment
than air. These experimental conditions must bring clear oxidation reaction.
2. Experimental Procedure
An Au-55 mol%Ti offstoichiometric alloy was selected.
Fig. 1 The Au-Ti binary phase diagram.19)
+Corresponding author, E-mail: shim.h.aa@m.titech.ac.jp, hosoda.h.aa@
[image:1.595.318.533.344.521.2]This is partially because the alloy powder can be fabricated by mechanical crush in offstoichiometric 55 mol%Ti. Au-55 mol%Ti alloy was hard and brittle, while the stoichio-metric AuTi is ductile and difficult to produce powder by mechanical crush. Au-55 mol%Ti is expected to be B2 single phase at above 1173 K.19) Besides, the formation of Ti3Au
second phase is slow in a near-eutectoid Ti-4 mol%Au alloy; the precipitation of Ti3Au is not recognized after the heat
treatment at 1073 K for 3.6 ks but at 973 K for 86.4 ks.23)The starting materials were 99.99% Au and Ti. An alloy ingot of 8 g was prepared by arc melting method in Ar-1%H2
atmosphere using a nonconsumable W electrode. In order to homogenize the alloy, the alloy was hot-forged at 1423 K for 43.2 ks under 100 MPa in Ar atmosphere using carbon dies spray-coated by boron-nitride (BN) solid lubricant. The hot-pressed disk-shape specimen was cut, mechanically polished and solution-treated at 1173 K for 3.6 ks in Ar followed by quenching into water. Then, the specimen was crushed into powder mechanically, and 25 mg powder with the powder size of about 150 µm was used for the measurement.
Oxidation test was done using a thermogravimetry combined with differential scanning calorimetry (TG-DSC, Netzsch STA449 Jupiter) in Ar-50 vol%O2atmosphere using
high purity alumina crucibles. The heating and cooling rate was 0.33 K/s (20 K/min) and the temperature range was from room temperature (RT) to 1773 K. Ar-50 vol%O2mixed
gas was purged at a rate of 0.167 ml/s (10 ml/min). After the oxidation, ª-2ª X-ray diffraction measurement (ª-2ª XRD, Philips X’Pert-Pro Galaxy equipped with X’celerator) was performed at RT using CuK¡radiation operated at 45 kV and 40 mA. It should be noted that, by the DSC measurement in pure Ar environment, the martensitic transformation temper-atures of the Au-55 mol%Ti alloy are: Af (austenite
trans-formation finish temperature)=799 K, As (austenite
trans-formation start temperature)=775 K, Ms (martensitic
transformation start temperature)=792 K and Mf
(marten-sitic transformation finish temperature)=757 K. After the oxidation test, the specimen was observed by a scanning electron microscopy (SEM, Hitachi S-4300).
3. Results and Discussion
3.1 Mass change during oxidation
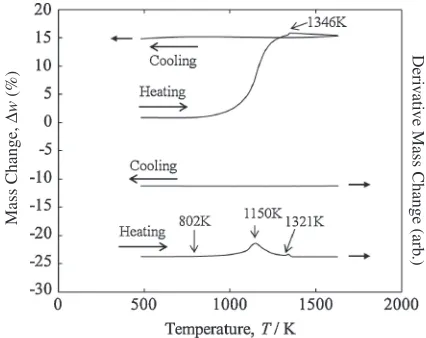
Figure 2 show TG curves for heating oxidation of Au-55 mol%Ti. The derivative mass change of TG curves was also plotted in Fig. 2. It was found that the mass increase starts at 802 K, and largely increases with increasing temperature. Then, the temperature of 802 K regards the oxidation start temperature, and it is relatively low in comparison with the reported oxidation start temperature of 930 K by Declairieuxet al.22)The difference must come from the specimen shape and atmosphere: powder of 150 µm and Ar-50 vol%O2in this study and the bulk specimen of 3 mm©
3 mm©1 mm and air in Ref. 22, respectively. This study employed more severe oxidation condition for the clear understanding of oxidation behavior by a short-time test. The maximum mass change rate in TG occurs at 1150 K. When the temperature exceeded 1300 K, a small bump is seen at around 1346 K. This corresponds to the melting point of Au (1337 K) and maybe thermal shock due to rapid melting
causes the mass change. The details of Au formation will be described in the latter. When heated above 1346 K, the mass change was very small. The final mass gain measured was 15.24% by taking into account the change of buoyancy.
It should be noted that the apparent mass increases with increasing temperature, since the force of buoyancy decreases with decreasing the density of environment (here, Ar-50%O2)
by heating. During cooling down to RT, the sample mass as well as the derivative mass change is constant regardless of temperature.
3.2 Heatflow during oxidation
Figure 3 shows simultaneous DSC curves and correspond-ing derivative heat flow curves are also plotted. During heating, a large exothermic heat appears from 820 K, and the peak temperature is 1150 K. The exothermic heat corresponds to the large mass gain in the TG curve, then, the exothermic heat stands for the oxidation. The DSC peak temperature of 1128 K is in good agreement with the maximum mass increase temperature of 1150 K. Besides, at around 1350 K, an endothermic heat was seen. As described, the small bump in TG curve was observed at this temperature. Besides, during cooling, a corresponding exothermic heat was
Mass Change,
Δ
w
(%)
Deri
v
ati
v
e Mass Change (arb
.)
Fig. 2 Mass change of Au-55 mol%Ti by TG measurement in Ar-50 vol%O2. The derivative mass change is also plotted.
Deri
v
ati
v
e Heat Flo
w (arb
.)
[image:2.595.320.533.70.239.2] [image:2.595.317.533.282.463.2]observed at 1282 K. Then, this reaction is judged to be an equilibrium phase reaction. Based on the Au-Ti binary phase diagram, these temperatures are close to the melting point of Au being 1337 K. Further cooling down to RT, no reaction heat was seen. It should be noted that the martensitic and reverse martensitic transformation was not observed. Partially because the endothermic heat by reverse martensitic trans-formation of Au-55 mol%Ti was much smaller than the exothermic heat generated by oxidation. And also, it is well known that the martensitic transformation in NiTi becomes broadened by severe plastic deformation such as cold rolling24,25) and the martensitic transformation gradually
occurs with changing temperature. This is because marten-sitic transformation is suppressed by lots of lattice defects such as dislocations. In this case, the phase reaction heat per kelvin (or per second) becomes very small and sometimes the reaction heat of largely deformed shape memory alloys is hardly detected by DSC. Then, similarly, we believe that the martensitic transformation was hardly detected in the AuTi powder specimen due to the large amount of lattice defects introduced by mechanical crush.
As summarized in the above simultaneous TG-DSC measurement, the irreversible reaction of oxidation starts around 802820 K and becomes most active at 1150 K. The oxidation start temperature is almost comparable to the martensitic transformation temperatures (Mf=757 K, Ms=
792 K,As=775 K andAf=799 K). Then, oxidation must be
a problem in AuTi for practical high temperature applica-tions, especially for long-term use. The final mass gain is 15.24%. The reversible reaction appears at the temperature
close to 1337 K, which is close to the melting point of Au. The chemical reactions during the measurement will be discussed in the later.
3.3 Chemical reaction and oxidation products
When the constituent element Ti is oxidized, titanium oxides must be formed. When Ti atoms are supplied from AuTi, Ti atoms in AuTi are consumed for oxidation and Au atoms remain. Au is not active to oxygen and no oxide is formed. Then, the formation of Au or Au solid solution is expected after the complete oxidation of AuTi. If this speculation is accepted, the equilibrium phase reaction
observed at 1328 K during heating must be the melting point of Au (1337 K). The small difference in reaction temper-atures, 1328 K in DSC and 1337 K in the literature, can be explained by small amount of solute atoms, Ti, O and/or other impurities.
For the growth of titanium oxides, several kinds of intermediate phases exist including TinO2n¹1(n=1³9) and
TiO2,26) and the formation of titanium oxides depends on
temperature and oxygen pressure.27,28) Here, it is assumed
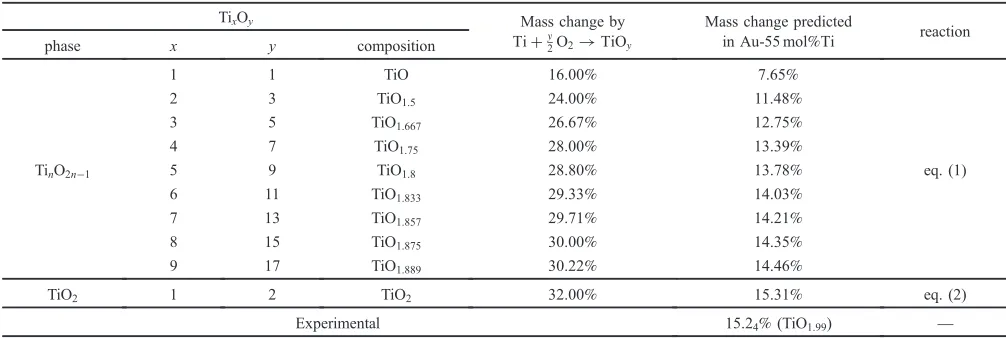
that the titanium oxides formed by oxidation possess the stoichiometric compositions and that all the mass change is caused by the oxidation only without vaporization. Then, the following chemical reactions are accepted and the corre-sponding mass changes are in Table 1.
AuTiðAu-55 mol%TiÞ þ0:55ð2n1Þ=2nO2
!0:45Auþ0:55=n TinO2n1 ð1Þ AuTiðAu-55 mol%TiÞ þ0:55O2
!0:45Auþ0:55TiO2 ð2Þ
The calculated mass gains of Au-55 mol%Ti are, for example, 14.46% when Ti9O17 (TinO2n¹1,n=9) is formed
and 15.31% when TiO2 is formed. All the mass changes
calculated are listed in Table 1. By comparing the calculated and experimental mass gain, the mass gain of 15.31%is close to the experimental value of 15.24%. Then, the titanium oxide
formed is thought to be TiO2. When small amount of
deficient oxygen is assumed in the formation of TiO2, the
mass change corresponds to TiO1.99. Then, the titanium oxide
formed here is assessed to be TiO2.
In order to confirm the reaction products after the oxidation test, ª-2ª XRD analysis was carried out using the oxidized sample, and the result is shown in Fig. 4. It is found that fcc (Au) and rutile (TiO2) coexist and that AuTi phase does not
remain at all. The results of the phase analysis are in good agreement with the estimation based on TG-DSC measure-ment. Therefore, the final oxidation products of Au-55 mol%Ti are identified to be rutile (TiO2) and fcc Au which
are the stable phases in oxygen environment. The resultant chemical reaction of AuTi during heating oxidation is simply concluded as,
[image:3.595.46.549.84.253.2]AuTiþO2!AuþTiO2: ð3Þ
Table 1 Calculated mass changes of Au-55 mol%Ti by the formation of titanium oxides TinO2n¹1(n=1³9) and TiO2during oxidation.
TixOy Mass change by
Tiþy
2O2!TiOy
Mass change predicted
in Au-55 mol%Ti reaction
phase x y composition
TinO2n¹1
1 1 TiO 16.00% 7.65%
eq. (1)
2 3 TiO1.5 24.00% 11.48%
3 5 TiO1.667 26.67% 12.75%
4 7 TiO1.75 28.00% 13.39%
5 9 TiO1.8 28.80% 13.78%
6 11 TiO1.833 29.33% 14.03%
7 13 TiO1.857 29.71% 14.21%
8 15 TiO1.875 30.00% 14.35%
9 17 TiO1.889 30.22% 14.46%
TiO2 1 2 TiO2 32.00% 15.31% eq. (2)
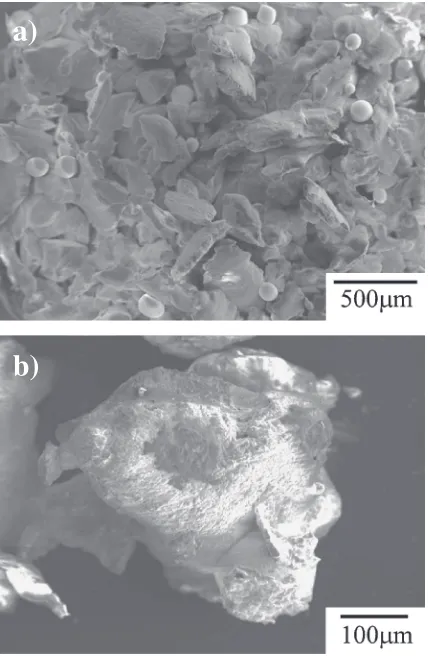
Figure 5 shows SEM images of AuTi specimen after the TG-DSC measurement. As shown in Fig. 5(a), the oxidized sample was composed of two kinds of particles. One is rough-surface particles with 10300 µm in size and the other is round-shaped particles with 10100 µm in size. The former particle is judged to be TiO2and the latter is Au. Figure 5(b)
is an enlarged picture of a rough-surface particle of TiO2.
Several grains are attached each other in the particle. This must be due to sintering progressed during the measurement
as well as grain-growth, since the maximum temperature in the TG-DSC measurement was 1773 K.
Au/TiO2 ultrafine particles are known to catalyze the
oxidation of carbon monoxide.29)Then, there is a possibility
to appear novel functions such as a catalyst in AuTi other than high temperature shape memory effect, if nano-sized particles are formed by oxidation at low temperature. And also, in order to apply AuTi for practical high temperature use, isothermal oxidation behavior around martensitic trans-formation temperatures should be revealed.
4. Conclusions
(1) The oxidation starts at 802 K in Au-55 mol%Ti alloy, and the oxidation reaction is most active at 1150 K. (2) An equilibrium phase reaction appears near 1346 K
in DSC curve which stands for the melting of Au produced by the oxidation of AuTi.
(3) The chemical reaction of oxidation is AuTi+O2¼
TiO2+Au, and the stable oxidation products are fcc
Au and Rutile TiO2. The precise chemical composition
of Rutile calculated by mass gain is TiO1.99.
(4) Since the oxidation start temperature is comparable to the martensitic transformation temperatures, the oxida-tion must be a problem in AuTi for practical high-temperature long-term applications.
Acknowledgements
This work was supported by Funding Program for Next Generation World-Leading Researchers (LR015), Grant-in-Aid of Scientific Research (Kiban S 26220907, Wakate A 24686077 and Wakate B 26870194) from JSPS, and the Advanced Low Carbon Technology Research and Develop-ment Program (JY240121) of Japan Science and Technology Agency.
REFERENCES
1) O. Benafan, A. Garg, R. D. Noebe, C. S. Bigelow, S. A. Padula, II, D. J. Gaydosh, N. Schell, J. H. Mabe and R. Vaidyanathan:
Intermetallics50(2014) 94107.
2) A. Evirgen, I. Karaman, R. Santamarta, J. Pons and R. D. Noebe:Scr. Mater.81(2014) 1215.
3) K. C. Atli, I. Karaman and R. D. Noebe:Mater. Sci. Eng. A613(2014) 250258.
4) X. Zhang, J. Sui, Z. Yang, X. Zheng and W. Cai:Mater. Lett.123
(2014) 250253.
5) P. J. S. Buenconsejo, H. Y. Kim and S. Miyazaki:Scr. Mater.64(2011) 11141117.
6) Y. Yamabe-Mitarai, T. Hara, S. Miura and H. Hosoda:Intermetallics18
(2010) 22752280.
7) H. Hosoda, R. Tachi, T. Inamura, K. Wakashima and S. Miyazaki:
Mater. Sci. Forum561565(2007) 15411544.
8) T. Kawamura, R. Tachi, T. Inamura, H. Hosoda, K. Wakashima, K. Hamada and S. Miyazaki:Mater. Sci. Eng. A438440(2006) 383386.
9) Y. Tsugane, T. Inamura, K. Wakashima and H. Hosoda: Mater. Res. Soc. Symp. Proc.980(2006) 0980-II05-51.
10) H. Hosoda, Y. Tsugane, T. Inamura, K. Wakashima and S. Miyazaki: Proc. Japan Society of Mechanical Engineering 2007 Annual Meeting,
1(2007) pp. 153154.
11) Y. Okimori, T. Inamura, H. Hosoda and K. Wakashima:Mater. Trans.
49(2008) 19982005.
12) T. Inamura and H. Hosoda:Metall. Mater. Trans. A42(2011) 111120.
a)
b)
[image:4.595.62.276.68.253.2] [image:4.595.63.277.294.622.2]13) H. Hosoda, T. Inamura, M. Tahara, K. Goto and H. Kanetaka: Mater. Sci. Technol.82(2012) 480486.
14) T. Aoki, M. Tahara, K. Goto, Y. Yamabe-Mitarai, H. Kanetaka, T. Inamura and H. Hosoda:Adv. Mat. Res.922(2014) 2530.
15) A. Wadood, H. Hosoda and Y. Yamabe-Mitarai:IOP Conf. Series Mat. Sci. Eng.60(2014) 012018.
16) A. Wadood, H. Hosoda and Y. Yamabe-Mitarai:J. Alloy. Compd.595
(2014) 200205.
17) A. Wadood and Y. Yamabe-Mitarai:Mater. Sci. Eng. A601(2014) 106110.
18) H. Shim, M. Tahara, T. Inamura, K. Goto, Y. Yamabe-Mitarai and H. Hosoda: Mater. Trans., accepted.
19) J. L. Murray:Binary Alloy Phase Diagrams, ed. T. B. Massalskiet al., (ASM Int., Metals Park, OH: ASM, 1984) pp. 324327.
20) H. C. Donkersloot and J. H. N. Van Vucht: J. Alloy. Compd. 120
(1970) 8391.
21) S. K. Wu and C. M. Wayman:Metallography20(1987) 359376.
22) C. Declairieux, A. Denquin, P. Ochin, R. Portier and P. Vermaut:
Intermetallics19(2011) 14611465.
23) Y. Matsuki, T. Inamura, K. Wakashima and H. Hosoda:Mater. Trans.
48(2007) 385389.
24) H. Matsumoto:Physica B190(1993) 115120.
25) T. Kurita, H. Matsumoto and H. Abe: J. Alloy. Compd.381(2004) 158161.
26) J. L. Murray and H. A. Wriedt:Phase Diagrams of Binary Titanium
Alloys, ed. by J. L. Murray, (ASM Int., Metals Park, OH, 1984)
pp. 211219.
27) R. F. Bartholomew and W. B. White:J. Cryst. Growth6(1970) 249 252.
28) P. Strobel and Y. Le Page:J. Mater. Sci.17(1982) 24242430.