Munich Personal RePEc Archive
Trust, Reciprocity and Rules
Rietz, Thomas and Schniter, Eric and Sheremeta, Roman
and Shields, Timothy
19 July 2017
Trust, Reciprocity and Rules
Thomas A. Rietz
Henry B. Tippie College of Business University of Iowa, Iowa City, IA
Eric Schniter
Economic Science Institute Chapman University, Orange, CA
Roman M. Sheremeta
Weatherhead School of Management Case Western Reserve University, Cleveland, OH
Timothy W. Shields
George L. Argyros School of Business and Economics Chapman University, Orange, CA
This version: 19th July, 2017 Forthcoming: Economic Inquiry.
Abstract
Many economic interactions rely on trust, which is sometimes violated. The fallout from business fraud and other malfeasance shows serious economic consequences of trust violations. Simple rules mandating minimum standards are attractive because they prevent the most egregious trust violations. However, such rules may undermine more trusting and reciprocal (trustworthy) behavior that otherwise would have oc-curred and, thus, lead to worse outcomes. We use an experimental trust game to test the efficacy of exogenously imposed minimum standard rules. Rules fail to increase trust and reciprocity, leading to lower economic welfare. Although sufficiently restric-tive rules restore welfare, trust and reciprocity never return. The pattern of results is consistent with participants who are not only concerned with payoffs, but also use the game to learn about trust and trustworthiness of others.
JEL Classification Codes: C72, C90, D63, D64, L51
Relationships based on trust are critical because most social and economic situations are
not explicitly contracted with behavior regulated by enforceable rules (Davis, 1992; Glaeser
et al., 2000). Without enforceable rules, people rely on trust. Even when rules exist, people
often rely on trust to facilitate interactions because it is cheaper than active monitoring and
enforcement: investors trust that companies act in the investors’ best interests, lenders trust
borrowers to repay loans, depositors trust bankers to behave responsibly, etc.
Trust is built by (i) taking a risk and willfully ceding resources or control to another (i.e.,
trusting) and (ii) having the other avoid purely self-interested opportunism to voluntarily
reward or reciprocate the trust (Rousseau et al., 1998). The ability to build trust depends on
the amount of risk and opportunism available. Failure to reciprocate violates trust. When
this occurs, minimum standards are often implemented. Minimum standards are used in
many areas. For example, the USDA imposes a minimum standard for meat inspection,
corporations must meet minimum standards of disclosure to investors, etc. While states
universally expect safe driving behavior and expect drivers to drive without distractions,
they only rule out specific distracting behaviors such as hand-held cell-phone use and texting.
Such rules may eliminate the most egregious trust violations, but they also restrict the ability
to demonstrate trust and reciprocity and, thus, hinder trust development.
Minimum standards rule out the worst abuses of trust relationships at lower costs than
fully mandated interactions (both from compliance and enforcement standpoints). However,
when used, such mechanisms may backfire (Bowles and Reyes, 2012), perhaps leading people
to conclude something akin to “the minimum must be good enough; otherwise it wouldn’t
be the minimum.” This can reduce reciprocity and inhibit trust development.
Consider the trust game of Berg et al. (1995) where an investor can invest any portion
of a $10 endowment by sending it to a trustee.1 The amount sent triples. The trustee can
choose (but is not obligated) to reciprocate by returning any portion of the tripled investment
to the investor and the game ends. Non-cooperative game theory predicts zero investment
1
because a self-interested trustee will keep all funds received. However, interactions in the
trust game rarely end this way. Typically, investors “trust” by sending some funds and
most trustees reciprocate by returning positive amounts, often enough to make the original
investment profitable (Camerer, 2003). Given enough reciprocation, a self-interested investor
with accurate expectations may rationally invest , creating a trust-based, mutually-beneficial
exchange relationship (Kurzban and Houser, 2005). On the other hand, many trustees return
nothing, violating the trust relationship.
To study the trade-offs that rules have on trust development and economic efficiency, we
modify the basic trust game by exogenously imposing minimum standards on trustee
behav-ior: trustees must return at least 0%, 10%, 20% or 30% of the tripled investment amount
received (depending on the treatment). Our purpose is to determine whether minimum
stan-dard rules provide best responses to trust failures, or should be avoided. In the language of
Kahan (2000), we ask whether relatively “gentle nudges” (e.g., a 10% rule) or “hard shoves”
(e.g., a 30% rule) are effective against undesirable trust violations. This question remains
relevant today as the manipulation of people’s “choice architecture” by financial and social
planners becomes increasingly popular (Thaler and Sunstein, 2008; M¨unscher et al., 2015).
Overall, we find rules inhibit trust formation. Reciprocity, measured by median
discre-tionary returns to investors, nearly disappears with rules. Further, the 10% rule reduces
reciprocity the most. This runs counter to arguments that “[undesirable] norms stick when
lawmakers try to change them with ‘hard shoves’ but yield when lawmakers apply
‘gen-tle nudges’ ” (Kahan, 2000, p. 608). In our context, the opposite holds. The most gen‘gen-tle
rule (10%) actually increases untrustworthy behavior the most. It also reduces trust along
with its associated investment and economic efficiency. Only the “hardest shove” (the 30%
rule) improves outcomes for investors and increases economic efficiency. Further, while more
restrictive rules can force the return rate up, voluntary reciprocity never recovers. While
investment levels rise under sufficiently high return rules, trust never returns.
available action spaces. Thus, changing rules can change both the possible payoffs for
par-ticipants and what parpar-ticipants can learn about each other based on their actions. This
allows us to evaluate what kinds of preferences explain behavior in trust games. Specifically,
we can differentiate between two types of interrelated preference models: (1) models that
depend only on an agent’s preferences over the distribution of payoffs across agents and (2)
models where an agent’s preferences also depend on perceptions of others learned through
the interaction. We find that gentle rules backfire (reducing trust reciprocity and economic
welfare) and that increasingly restrictive rules have differential effects on trust, reciprocity,
investment and economic efficiency. Investment and efficiency rise with sufficiently restrictive
rules, but trust and reciprocity never recover. This pattern is only consistent with
partic-ipants using their actions to both (1) affect each other’s payoffs and (2) learn about each
other’s type and/or intentions (i.e., their willingness to trust and reciprocate).
1
Prior Research
Research in several areas suggests that institutionalized structures may actually decrease the
very behavior they are designed to encourage (Bowles and Reyes, 2012). Paying people to
give blood results in less blood contributions than alternative approaches offering no financial
incentives (Titmuss et al., 1997). When a fine is imposed against late pick-ups, more parents
(not fewer) pick up children late from day care (Gneezy and Rustichini, 2000). Laboratory
studies show that imposing monitoring or close supervision by authority actually decreases
work effort (Dickinson and Villeval, 2008).
Three studies relate closely to ours. In the first, a dictator game is modified to study
effects of minimum performance requirements set endogenously by a principle for an agent
(Falk and Kosfeld, 2006). Endogenous requirements create a confound: setting a minimum
signals mistrust. In a control treatment with an exogenous minimum, production levels are
the principal’s regulation of the agent, not the rule itself, impacts investment behavior. In
any case, this game does not allow a study of trust: the principal cannot demonstrate trust
or initiate a trust-based exchange because the principle takes no action. In the second study,
a modified trust game allows investors to specify a “desired return” when sending money to
trustees and, in one treatment, set fines for trustees who reciprocate less than desired (Fehr
and Rockenbach, 2003). Return rates fall when fines are set. However, endogenously setting
fines signals intentions and distrust. Fines also create incentives by punishing poor returns.
In the last study, the setting is modified to remove the endogenous fine-setting confound by
stochastically imposing fines with a known exogenous probability (Houser et al., 2008). Only
the trustee knows whether a fine is imposed. This allows separation of the signaling and
incentive effects of fines. Incentives, but not signaled intentions, affect returns. However,
there remains a confound: investors signal expectations by endogenously setting the desired
return. Further, the design makes the study of trust and its interaction with rules impossible
because investors do not know how their actions affect trustee payoffs ex ante.2
The general idea that rules may have adverse consequences, is similar to our thesis.
However, there are important differences. (1) Our study strips away as much institutional
and contextual information as possible (e.g., we avoid using the words “rule,” “investor”
and “trustee”) so as to cleanly focus on regulations that mandate minimum standards.
(2) By setting known rules exogenously, we remove the confounds of rules, mistrust and
expectations. The investor cannot signal expectations or trust by any means other than
investing, the same as in the original trust game of Berg et al. (1995). Rules do not signal
expectations and mistrust. This contrasts with Fehr and Rockenbach (2003) and the main
treatments of Falk and Kosfeld (2006), where both expectations and mistrust are signaled
simultaneously. Further, rules in our studydo not signal expectations alone, which contrasts
with Houser et al. (2008). (3) Because there is a known meaningful relationship between
2
trust, reciprocity and payoffs, we can study trust (investor behavior) directly. Again, this
differs from Houser et al. (2008). (4) Only our study investigates the interaction between
the restrictiveness of rules and trust formation. Thus, in contrast to other studies, we study
a pure rule effect and study how trust and reciprocity change in response to different rules.
2
Experiment and Hypotheses
2.1
Description of the Experiment
We conducted the experiment at Chapman University’s Economic Science Institute (ESI).
We recruited participants, who had not participated in trust-game experiments at the ESI,
from a standard subject pool consisting primarily of undergraduate students. Subjects were
randomly assigned into one of four treatments. Participants interacted with each other
anonymously over a local computer network. We programmed and conducted the experiment
using z-Tree (Fischbacher, 2007). Each participant, visually isolated from others, could only
see their own computer screen. Sessions lasted about 35 minutes. First, an experimenter
read the instructions aloud while each participant followed along with their own printed copy
of the instructions. The instructions (available in the Appendix) explained the experimental
procedures and payoffs. After reviewing instructions, participants were given five minutes
to answer several questions to ensure they understood the instructions. After participants
completed the quiz, the experimenter distributed a printed copy of the correct quiz answers
and privately answered any questions regarding the experimental procedures.
Each participant was assigned a role, labeled “Person 1” for the investor and “Person 2”
for the trustee. The participants interacted only once in the trust game. Each participant
was paid $7 for participation and any additional payoffs from the trust game. On average
participants earned $9.75 beyond their participation payment.
We used neutral language and did not use words such as “rules.” Moreover, to avoid
trustee: “Person 2 can send back none, more than none, or all of the amount in Person 2’s
account.” In the other three treatments we used: “Person 2 can send back 10% [20%, 30%],
more than 10% [20%, 30%], or all of the amount in Person 2’s account.” In these three
treatments the trustee had to send back at least 10%, 20% or 30% of the tripled investment
amount received. A button was placed on the trustees’ screen that, if selected, would trigger
a pop-up window displaying the minimal amount in dollars that could be returned.
Subjects were randomly assigned into a single treatment. In each of the four treatments
the investor was endowed with $10 and could send any portion of it to the trustee, which
was tripled on the way. The trustee then decided how much to send back contingent upon
the minimum return rule (either 0%, 10%, 20% or 30%). In the 0% rule baseline treatment
the trustee could send back none of the amount received.
In the standard trust game, investors put all invested funds at risk because the trustee
is under no obligation to return anything. For the same reason, any funds returned by the
trustee represent (voluntary) reciprocity. Minimum return rules imply that not all investment
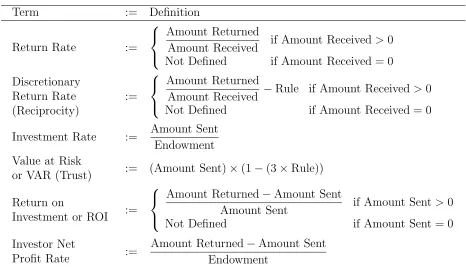
is at risk and not all returns are voluntary. Consequently, we need some terminology to
distinguish investment from the amount that is at risk and to distinguish returns mandated
by the rule from voluntary returns. Table 1 defines our terminology for the trust game with
minimum return rules. The return rate determines whether the investor profits from investing
and is the usual measure of reciprocity in trust games. Here, because the rule mandates
some return, we define the discretionary return rate (return rate minus the mandated rule)
as reciprocity. It represents the returns trustees do not have to give to investors. The
investment rate is the same as in normal trust games. However, we argue that trust is
only displayed by the amount of this investment that is at risk represented by value at risk
(VAR). Here, the trustee must return the rule percentage times the tripled amount invested.
Thus, the value at risk is the amount invested times (1-(3 x rule)). This essentially shows
how much the rule attenuates downside risk for the investors per dollar invested and, as a
definitions.
Table 1: Definitions of Terminology
Term := Definition
Return Rate :=
Amount Returned
Amount Received if Amount Received>0
Not Defined if Amount Received = 0
Discretionary Return Rate (Reciprocity) := Amount Returned
Amount Received −Rule if Amount Received>0
Not Defined if Amount Received = 0
Investment Rate := Amount Sent
Endowment Value at Risk
or VAR (Trust) := (Amount Sent)×(1−(3×Rule))
Return on
Investment or ROI :=
Amount Returned−Amount Sent
Amount Sent if Amount Sent>0
Not Defined if Amount Sent = 0
Investor Net
Profit Rate :=
Amount Returned−Amount Sent Endowment
2.2
Hypothesis Development
Minimum return rules limit investor’s losses by bounding the distribution of return rates from
below. We hypothesize that this will affect the distribution of investment levels. Further,
by restricting the action space and the value at risk to investors, rules may affect the ability
of investors and trustees to both (1) affect each other’s payoffs and (2) signal intentions. If
the investors and trustees are influenced by each other’s payoffs, then rules can affect the
distribution of returns and investment levels in other ways. To show how interdependent
preferences give rise to our hypotheses, we borrow a simple utility function from Sobel (2005).
A decision maker i who faces agent j has the utility function:
[image:9.612.71.537.117.388.2]wherexi is the decision maker’s payoff,xj is the other agent’s payoff,u(.) is the utility of the
decision maker’s own payoff,v(.) is the utility to the decision maker resulting from agentj’s
payoff, and λi,j(.) is a weighting function. The weighting function may depend on payoffs,
attributes of the decision maker and/or perceived attributes of agent j. A positive value
of the weighting function reflects altruism while a negative value reflects spite. We show
how models examining equity and reciprocity concerns advocate specific functional forms of
λi,j(.) and what effect minimum return rules would have on predicted behavior given the
specific form of this utility function.
According to classical economic theory λi,j(.) ≡ 0, as the decision maker only cares
about her own payoffs. In this case, the rules we impose should make no difference. Income
maximizing trustees would not return more than the rule imposes. For the rules we use,
even the highest value of the minimum mandated return would result in losses for investors
and, therefore, investors would not invest. However, in prior research, there is typically a
distribution of voluntary trustee return rates (Ostrom and Walker, 2003) inconsistent with
λi(.)≡0.
Several authors have proposed specific functional forms for equation (1). For example,
Fehr and Schmidt (1999) model λi,j(.) as independent of agent types (i.e., no types) and
dependent on the sign ofxi−xj, the relative differences in payoffs. This results in a decision
maker who cares not only about her own payoff, but wants to reduce the inequity in the
relationship.
Alternatively, λi,j(.) could depend on the decision maker’s type as it does in Bolton and
Ockenfels (2000). Their model has similar motivation, but proposes a different functional
form for equation (1):
Ui(xi, xj) =xi −αi
xi
xi+xj
−1/2
2
(2)
whereαi is the decision maker’s type and is independent of agentj. Heterogeneous decision
makers place different weight on inequity and therefore on agent j’s payoff. Both Fehr and
necessarily linearly) in xi, but (weakly) decreasing in inequity.
Bolton and Ockenfels (2000, p. 187) suggest a distribution of types, here denoted by
αi ∈[0,α¯]. The lowest trustee type chooses a return rate of zero. The highest trustee type
chooses to return enough so that investor and trustee payoffs are equal. In our treatments,
where the investor (i= 1) is endowed with $10, the trustee (i= 2) with $0, and the multiplier
is 3, the amount returned (s2) that generates equity of payoffs is a function of the amount
invested (s1), ¯s2 = max{0,2s1 −5}. So the highest trustee type returns s2 > 0 when the
investor invests at least $2.5. Interior values ofαi can recreate any distributional preference,
including equity, in the feasible space of the baseline treatment.
When decision makers are concerned with distributions (e.g. inequality, efficiency,
fair-ness), but not intentions (e.g., Fehr and Kirchsteiger, 1994; Fehr and Schmidt, 1999; Bolton
and Ockenfels, 2000), the weighting functions are either constants (possibly differing across
individuals), depend on the sign of xi −xj, or depend upon the decision maker’s type. In
these cases, rules will have no effect on the weighting functions.
If rules do not affect the weighting or value functions, the only effect of rules would be
to mechanically truncate the return distribution. This leads to our first hypothesis, which is
what people seem to have in mind when they propose minimum standard rules:
Truncation Hypothesis: Imposing a minimum return rule bounds the lower tail of the
possible return rate distribution and leaves higher return rates otherwise unaffected. Investors
will select the optimal investment by trading off potential returns with value at risk (VAR),
which is capped by the the minimum return rule that truncates the lower tale of the return
rate distribution. Thus, investment is weakly increasing with the rule.
Truncation alone should increase mean return rates as rules are imposed and increase.
However, up to the point that the rule surpasses the median return rate, the median should
remain unchanged. Because rules restrict the available discretionary return space,
tionary return rates will fall with increasing rules simply because less of the return is
while reducing variance and downside risk. This will increase investment levels uniformly
with increasingly restrictive rules.3 The idea that decreasing value at risk increases
invest-ment is similar to observed behavior in threshold public goods experiinvest-ments.4 If investors can,
they may choose to keep VAR unaltered until the rule is sufficiently restrictive that it
me-chanically reduces VAR. This investment behavior would result in VAR remaining constant
for less restrictive rules and falling for more restrictive rules.
The Truncation Hypothesis argues that minimum standards improve welfare by
eliminat-ing the most egregious trust violations and encourageliminat-ing trust. However, minimum return
rules may also shift the rest of the return distribution, imposing unintended effects on
in-vestment. A minimum return rule might reinforce pro-social behavior and reciprocity if it
suggests that selfish behavior is unacceptable or undesirable (Kahan, 2000). We also note
that, in threshold public goods games, higher thresholds elicit higher contribution levels (see
Croson and Marks 2000). Higher thresholds may be reinforcing contribution levels by
com-municating higher contributions are expected. Here, if investment increases due to the rule,
then return rates may also increase. This might occur through normative social influence
(e.g., experimenter demand) effects and/or conformity (e.g., social proof) effects. This is
most easily illustrated by equation (2), where in the context of our game, the highest trustee
type returns s2 = (2s1−5) for investments s1 >$2.5, yielding a return rate of (2s1−5)/s1,
which is strictly increasing in investments1. This leads to a competing hypothesis:
Reinforcement Hypothesis: When a larger minimum return rule is implemented, it will
increase non-truncated return rates. Investment and VAR will both respond to minimum
return rules. Investment will increase with the rule as the investor’s ability to put value at
risk becomes increasingly limited.
The combined effect is that rules strictly increase return rates. Mean return rates should
rise on average beyond that implied by pure truncation effects. Median return rates should
3
If investors avoid downside risks in particular (as postulated by Menezes et al. (1980) and Kimball (1990), etc.), eliminating the lower tail would create a strong incentive to invest more.
4
also rise.5 For less restrictive rules, discretionary return rates may rise, but will fall for
suffi-ciently restrictive rules because restrictive rules leave less room for discretionary returns (i.e.,
display an “inverted U-shape”). Investment will increase at a faster rate than predicted by
theTruncation Hypothesis. VAR will rise with less restrictive rules, then fall with sufficiently
restrictive rules (i.e., display an “inverted U-shape”). Overall, theReinforcement Hypothesis
predicts that return rates will increase beyond the mechanical lower-bound truncation effect
of the rule.
In contrast, Bowles and Reyes (2012) suggests that incentives, including those provided
by rules, may backfire, causing trustees to abandon their own rationale for returning cash,
substituting the rule instead.6 By reducing the opportunity for investors to take on risk and
for trustees to make discretionary returns, minimum return rules restrict the information
content about an investor’s intention to demonstrate trust and a trustee’s intentions to
demonstrate reciprocity. This requires that decision makers consider both the payoffs and
intentions of the other agent (e.g., Rabin, 1993; Dufwenberg and Kirchsteiger, 2004; Segal
and Sobel, 2007). In this case, not only does the decision maker’s weighting function depend
upon their own type, it also depends upon beliefs about the other agent’s type. For example,
Levine (1998) models the decision maker’s utility as:
Ui(xi, xj) = u(xi) +
αi+βiαj
1 +βi
v(xj) (3)
whereαi is the decision maker’s type,αj is the other’s type, andβi is the weight the decision
maker places on the other’s type. Here, the weighting parameter is a weighted average of
the decision maker’s type and the other agent’s type. Overall, the decision maker wants to
be kind (or kinder) to a kind agent. When a decision maker is uncertain about the other’s
type, she draws inferences by observing the other’s behavior.
When concern for the other’s payoffs is governed by only the decision maker’s type (or
5
This allows us to distinguish between theTruncation Hypothesis and theReinforcement Hypothesis.
6
by the sign of xi −xj, or a constant), then increasing minimum return rates can lead to
higher investment and possibly higher reciprocity as predicted by the Truncation and the
Reinforcement hypotheses. In contrast, if the decision maker incorporates beliefs about the
other’s type, then minimum return rules can have the opposite effect.
By restricting the strategy space (i.e., the discretionary amount returned), rules can
interfere with inferences about the types of others. For example, the trustee observes the
amount invested. For a given rule, trustees might believe that maximum investments are sent
by investors whose type is above some benchmark. However, as rules decrease investment
risk, this benchmark may change, creating greater pooling of investors with sufficiently high
types. This weakly decreases the trustee’s expectation of the investor’s type, which decreases
the weight the trustee places on the investor’s payoff in equation (3). Likewise, as rules
increase, the minimum amounts returned by trustees increase. Thus, lower types of trustees
are pooled together, which diminishes the investor’s ability to infer the trustee’s type, which
decreases the weight the investor places on the trustee payoff in equation (3). Thus, while
increasing minimum return rules decrease investor risk, they also obfuscate the ability of
both the investor and the trustee to infer each other’s types.7
In this case, minimum return rules reduce information about types, affecting both the
trustee’s beliefs about the investor and the investor’s beliefs about the trustee. In response
to reduced information regarding trustee types, investors may reduce investment until the
rules reduce downside risk sufficiently to restore investment levels. Similarly, trustees may
reduce return rates because of reduced information about investor types. Then, rules would
create a return trade-off: truncating the lower tail of the return rate distribution, but shifting
the rest of the distribution down. This leads to another competing hypothesis:
Replacement Hypothesis: When a minimum return rule is implemented, it not only
7
truncates the lower tail of the return rate distribution, but will decrease non-truncated return
rates, which fall toward the rule. Investors will trade off the risk reduction benefits due
to truncation of the lower tail of the return rate distribution with otherwise lower expected
returns in the non-truncated portion.
The trade-offs implied by the Replacement Hypothesis predict “U-shaped” relationships
between rules and investments and between rules and returns. For trustees, median return
rates will fall for less restrictive rules and rise back up only for sufficiently restrictive rules.
Mean return rates may also fall if the replacement effect is larger than the rule’s pure
trun-cation effect. For Investors, investment will rise for sufficiently restrictive rules because,
eventually (e.g., with the 30% rule), almost all downside risk is eliminated. However,
invest-ment may fall initially (for less restrictive rules) because of the downward shift anticipated
in the rest of the return distribution. Value at risk will fall uniformly because of the
combi-nation of lower discretionary return rates and lower information returns to placing funds at
risk.
It is important to note that all of our hypotheses are motivated by potential underlying
causes of trust formation and rule effects. In order to get a complete understanding of
investment and return behavior, we need to understand not just how agents respond to the
existence of minimum return rules, but also how they respond to different levels of these
rules. Therefore, our analysis and conclusions will depend not just on the shift in mean
behavior due to a rule, but on the relative shifts in the entire distribution of behaviors in
response to changing levels of rules (captured by median statistics). This is both a unique
and critically important contribution of our study.
As noted above, some forms of λi,j(.) suggest that investment levels themselves play a
significant role in determining return rates, with higher investments increasing return rates,
consistent with others’ observations (Ostrom and Walker, 2003). As a result, we examine
3
Results
3.1
Univariate Results
Result 1. Return rates and observed reciprocity are only consistent with the Replacement
Hypothesis. As a result, rules reduce reciprocity and can hurt investors on average.
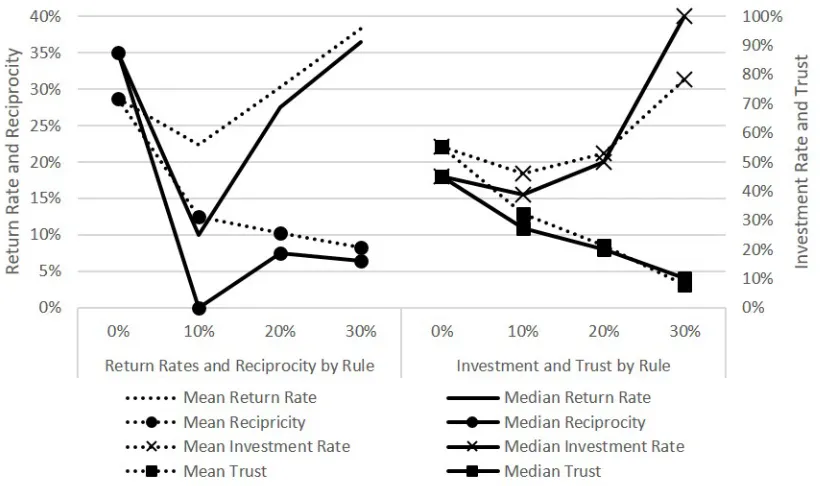
The left hand side of Figure 1 shows the mean and median return rates (as percents
of amounts received by trustees) and reciprocity (measured by the voluntary return rates
above the minimum mandated) under each rule.8 Panel A of Table 2 gives more detail and
[image:16.612.103.513.306.549.2]presents some univariate tests for treatment effects.
Figure 1: Minimum return rule effects on investment, trust, returns and reciprocity.
Return rates display the “U-shaped” pattern that is only consistent with theReplacement
Hypothesis. Under a 10% rule the return rates and voluntary reciprocity fall while the
percentage of trustee’s who returned only the minimum required increases. The drop is
dramatic. The median return rate drops from 35% to the mandated minimum of exactly
8
Table 2: Return Rates, Reciprocity, Investment Rates and Trust by Rule
Panel A: Return Rates and Reciprocity
Discretionary
% Returning Return Return Rate
within $0.01 Rate (Reciprocity)
Rule Obs. of Minimum Mean Med. Mean Med.
0% 18 16.7% 28.7% 35.0% 28.7% 35.0%
10% 21 57.1% 22.4% 10.0% 12.4% 0.0%
20% 19 42.1% 30.3% 27.5% 10.3% 7.5%
30% 24 37.5% 38.2% 36.4% 8.2% 6.4%
Kruskal-Wallis Test Stat.: 21.931** 20.153**
P-value: 0.0001 0.0002
Panel B: Investment Rates, Trust and Return on Investment
Investment Value at Return on
% that Rate Risk (Trust) Investment
Rule Obs. Invest $0 Mean Med. Mean Med. Mean Med.
0% 21 14.3% 55.4% 45.0% 55.4% 45.0% -14.0% 5.0%
10% 24 12.5% 46.0% 38.8% 32.2% 27.1% -32.7% -69.9%
20% 20 5.0% 53.0% 50.0% 21.2% 20.0% -9.1% -17.6%
30% 24 0.0% 78.3% 100% 7.8% 10.0% 14.7% 9.3%
Kruskal-Wallis Test Stat.: 10.615** 21.735** 10.920**
P-value: 0.0140 0.0001 0.0122
10%. The median level of reciprocity falls from 35% to 0% as indicated by discretionary
returns falling to 0%. For the investor, this drives the median ROI down from 5% to -70%.
Without a rule, 57% of investors who send positive amounts have a net positive ROI. The
rules drives this down to 38%. As the minimum rule increases, the mean and median return
rates are forced up, but reciprocity remains low while the percentage of trustees returning
no more than the rule remains high. Even at the 30% rule, only 50% of investors experience
positive ROI, still less than under no rule at all. Unambiguously, rules reduce reciprocity
and can hurt investors. The “U-shaped” response function is significant and only consistent
with the Replacement Hypothesis.
Result 2. Investment levels and demonstrated trust are only consistent with the Replacement
Hypothesis. As a result, rules can reduce economic efficiency and social welfare.
The right hand side of Figure 1 shows the mean and median amounts sent and trust
(measured by VAR) under each rule. Panel B of Table 2 gives more details and shows some
univariate significance testing results for treatment effects.
Like reciprocity, investment also displays the “U-shaped” pattern that is only consistent
with the Replacement Hypothesis. Investment drops under the 10% rule and rises as risk
is mitigated by more restrictive rules. Only for the 30% rule does investment rise above
the 0% rule. This is a sensible response to the pattern of returns observed. The median
return on investment (ROI) drops from 5% under no rule to -70% under the 10% rule. ROI
remains below zero (-18%) under the 20% rule and rises to 9% under the 30% rule. Rules do
mitigate downside risk, VAR falls uniformily and significantly with increasingly restrictive
rules. Eventually investment becomes sensible, but trust continues to fall as rules increase.
Thus, again, the “U-shaped” response function is significant and only consistent with the
Replacement Hypothesis.
Because there is a one-to-one direct relationship between investment rates and economic
efficiency, the same result holds for economic efficiency. The implication is that, if minimum
they may be ineffective, at least until the minimum return rate is sufficiently high.
Result 3. The interaction of investment levels and rules result in return rates that are
consistent only with the Replacement Hypothesis. As a result, (1) higher investment levels
increase return rates for a given rule, however (2) rules reduce the ability of investors to
elicit higher returns through higher investment levels.
The Replacement Hypothesis is driven by the idea that investors send money to signal
trust, learn about trustee types and elicit a return. Trustees learn about investors and reward
trust. As a result, return rates should be affected by the amount invested through value at
risk. Rules hamper that ability to signal trust through value at risk as shown by the right
hand side of Figure 1,where trust falls even through investment increases under the 20% and
30% rules. As a result, rules may degrade the ability of investors to elicit higher returns
[image:19.612.156.480.392.596.2]through higher investment.
Figure 2: Median Discretionary Return Rates and Percentage of Maximum Discretionary Return Rates for Investments above and below $5 by Rule Treatment
Figure 2 clearly shows this effect and Table 3 gives more details and does significance
investments weakly above and strictly below $5. The left hand side of Figure 2 shows the
median discretionary return rate (i.e., reciprocity) for investments above or equal to $5
and investments below $5 as the rule varies. Under the 0% rule, investors who send less
than $5 elicit a median discretionary return rate of 12% (36% of the amount sent). This
jumps to 45% (135% of the amount sent) when investors send $5 or more, a difference of
33 percentage points. Under the 10% rule, the median overall discretionary return rate falls
to zero as does the rate for investors who send less than $5. But, investors who send $5 or
more still elicit positive median discretionary returns of 27% (which is 30% of the maximum
total discretionary returns that could be given under a 10% rule as shown on the right hand
side of Figure 2). Under the 20% rule, the median discretionary return rates are 4% for
investors sending less than $5 and 10% for investors sending $5 or more, a 6 percentage
point difference. Under the 30% rule, the rates fall to 0% and 10%, respectively.
Overall, Figures 1 and 2 and Tables 2 and 3 indicate that higher investment (more trust)
leads to higher return rates and more reciprocal behavior. However, high rules significantly
reduce this effect. Compare, in particular, the differences between investments overall, for
less than $5 and for $5 or more in Tables 2 and 3. Overall investment increases with more
restrictive rules, but Trust (VAR) falls (Table 2, Panel B). Under a 30% rule, about half of
investors invest $5 or more (Table 3, Panel B). This increases to nearly 4 in 5 under a 30%
rule (Table 3, Panel B). But, these investors demonstrate less trust overall as shown by the
falling VAR (Table 3, Panel B). While rules increase return on investment significantly for
those who invest less than $5, no such effect holds for those investing $5 or more (Table 3,
Panel B). This is because reciprocity falls significantly under more restrictive rules overall
(Table 2, Panel A). However this drop is only significant for investors who invest $5 or more
(Table 3, Panel A). There is no significant effect for those who invest less than $5 (Table 3,
Panel A). Both results are consistent with the idea that demonstrating trust elicits reciprocal
behavior and that a high rule restricts demonstrations of trust. To fully understand both the
Table 3: Return Rates, Reciprocity, Investment Rates and Trust by Rule dividing by Investment weakly above and strictly below $5
Panel A: Return Rates and Reciprocity for Investments<$5 and Investments>= $5
% Returning Discretionary Return
within $0.01 Return Rate Rate (Reciprocity)
Obs. of Minimum <$5 >= $5 <$5 >= $5
Rule <$5 >= $5 <$5 >= $5 Mean Med. Mean Med. Mean Med. Mean Med.
0% 8 10 25.0% 10.0% 14.6% 12.4% 39.9% 45.3% 14.6% 12.4% 39.9% 45.3% 10% 11 10 81.8% 30.0% 14.9% 10.0% 30.8% 36.7% 4.9% 0.0% 20.8% 26.7% 20% 8 11 50.0% 36.4% 28.7% 23.7% 31.4% 30.0% 8.7% 3.7% 11.4% 10.0% 30% 5 19 80.0% 26.3% 30.7% 30.0% 40.2% 40.0% 0.7% 0.0% 10.2% 10.0%
Kruskal-Wallis Test Stat.: 11.518** 5.174 5.543 15.069**
P-value: 0.0092 0.1595 0.1361 0.0018
Panel B: Investment Rates, Trust and Return on Investment for Investments <$5 and Investments>= $5
% that Investment Rate Value at Risk (Trust) Return on Investment
Obs. Invest $0 <$5 >= $5 <$5 >= $5 <$5 >= $5
Rule <$5 >= $5 <$5 >= $5 Mean Med. Mean Med. Mean Med. Mean Med. Mean Med. Mean Med.
0% 11 10 27.3% 0.0% 23.4% 30.0% 90.5% 100% 23.4% 30.0% 90.5% 100% -56.1% -62.7% 19.6% 35.9% 10% 14 10 21.4% 0.0% 20.4% 17.5% 82.0% 95.0% 14.3% 12.3% 57.4% 66.5% -55.4% -70.0% -7.7% 10.0% 20% 9 11 11.1% 0.0% 19.5% 20.0% 80.5% 90.0% 7.8% 8.0% 32.2% 36.0% -13.8% -28.8% -5.7% -10.0% 30% 5 19 0.0% 0.0% 25.5% 30.0% 92.2% 100% 2.6% 3.0% 9.2% 10.0% -8.0% -10.0% 20.7% 20.0%
Kruskal-Wallis Test Stat.: 0.900 4.107 5.510 44.629** 11.885** 5.174
P-value: 0.8255 0.2502 0.1380 0.0001 0.0078 0.1595
**Significant at the 95% level of confidence.
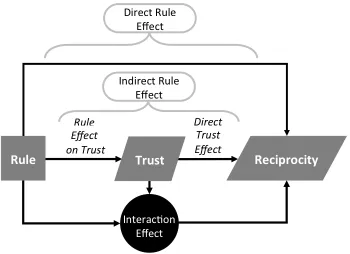
Figure 3: Direct, indirect and interaction effects of rules
show the significance of and relationships between these effects.
3.2
Regression Results
We hypothesize that results are driven by: (i) a direct effect of rules restricting the return
space; (ii) changes in investment levels conditional on rules; and (iii) how investment levels
affect reciprocity. Of course, there may be interaction effects as well. In particular, the
Replacement Hypothesis suggest an interaction between rules and investment/trust due to
rules interfering with the ability to demonstrate trust and learn about reciprocity. All of
these effects are illustrated in Figure 3. First, we estimate the effect of rules on investment
and trust, then estimate the combined effect of rules, investment, and trust on return rates
and reciprocity. We find that the results mirror the univariate analysis: the pattern of
3.2.1 Investment and Trust
Figure 1 clearly shows a non-linear relationship between rules and investment levels.
Invest-ment levels are capped at $10 and have a floor at $0. Thus, we estimate the relationship
between the rule and investment level using a censored normal regression of a quadratic
function, giving the following estimated relationship:9
Amount
Invested = $6(0..07)13 84.42∗∗∗
−$29.67Rule
(2.63) −11.30∗∗∗
+ $149.62Rule2
(10.26) 14.57∗∗∗
(4)
with 89 observations (F(2,87)=120.86). Standard errors (in parentheses) and t-statistics
are given below each coefficient, “***” denotes significance at the 99% level of confidence,
and Rule is measured as a decimal (for simplicity, we use a continuous variable rather than
categorical). The estimates show reduced investment with 10% and 20% rules with relatively
high investment under the 30% rule, where nearly all downside risk is eliminated. Again,
the “U” shape is significant and only consistent with the Replacement Hypothesis as stated
in Result 2.
While regression 4 shows how investment responds to rules, high investment does not
necessarily indicate a high degree of trust. Rules limit demonstrable trust by limiting the
total amount an investor can put at risk. We measure an investor’s level of trust according
to the value put at risk (VAR). Using VAR directly as a dependent variable in a regression
presents a problem: as part of the definition of VAR, the rule is guaranteed to affect VAR
for a given investment level and cannot appear on both sides of a regression equation. We
address this problem and ask whether investors adjust investment to affect VAR beyond
the direct rule effects by working with the log of VAR and using ln(1- 3×Rule) as the
independent variable.10 Again, a quadratic term captures non-linear effects, resulting in the
9
In this case, the censored normal regression and Tobit regression are the same because the censoring limits are the same across all observations. There are 7 observations of $0 invested and 31 observations of $10 invested. We cluster standard errors on the rule as the inter-rule variance is much higher than the intra-rule variance. We report Stata 14’s default estimates of standard errors here. Bootstrapped estimates using stratified sampling by rule also accord with these estimates.
10
following censored normal regression:11
ln(V AR) = 1.76
(0.11) 16.43∗∗∗
+ 1.77×XRule
(0.23) 7.82∗∗∗
+ 0.36×XRule2
(0.09) 4.24∗∗∗
(5)
with 82 observations (F(2,80)=219.08). XRule = ln(1 −3×Rule). Standard errors (in
parentheses) and t-statistics are given below each coefficient and “***” denote significances
at the 99% level of condfidence. The coefficient greater than one on ln(1−3×Rule) implies
that, with the imposition of the rule, investors reduce investment enough to reduce risk
beyond the pure mechanical effects of the rule. The quadratic term coefficient less than one
implies that more restrictive rules attenuate this effect. Combined, the two regression results
are only consistent with the Replacement Hypothesis as stated in Result 2.
We summarize the combined regression results as follows:
Result 4. The immediate effect of imposing a rule is to decrease the investment level and
VAR (beyond the VAR reduction resulting from the rule alone). As the rule’s restrictiveness
increases, VAR falls mechanically and the investment levels rise in response. This is exactly
the pattern predicted by the Replacement Hypothesis.
3.2.2 Return Rates and Reciprocity
Our regressions on return rates model differential truncation and distributional shifts in the
return distributions. The Truncation Hypothesis predict rules only truncate the lower tail
of the return rate distribution, increasing the conditional mean while leaving the median
unaffected. The other hypotheses change the entire distribution including the mean and
median. Therefore, to identify replacement and reinforcement effects, we run regressions
based on medians.
Obviously, return rates fall when the 10% rule is implemented (Figure 1). A direct
ln(I nvestment) + ln(1–3×Rule). This creates a fixed linear relationship between the dependent variable
and the independent variable. Then, we can move ln(1 - 3×Rule) to the right side of the regression equation.
It becomes an independent variable with a null coefficient hypothesized to be -1.
11
Here, censoring at the maximum VAR varies by rule. We note that, when we take the log of VAR we lose the 7 observations with $0 investment and, hence, zero VAR. A median regression is robust to this and gives similar positive coefficients greater than 1 on ln(1-3×Rule) and less than 1 on ln(1-3×Rule)2
regression of Rule and Rule2 on the return rate shows a significant drop in median returns
with the 10% rule and a subsequent increase as the rule mechanically forces return rates up.
However, we hypothesize a complex direct, indirect, and interaction effect between rules,
investment levels or trust, and returns. We estimate the direct trust effects at the same time
as the direct rule and interaction effects of Figure 3. To estimate the effects, we start with a
median regression, measure return rates as the percentage of funds received that are actually
returned by the trustee and use investment level as the independent variable. This results
in the following estimated relationship:
Return Rate =
−5.56%
(7.43%)
−0.75
+5.56%Inv.
(1.06%) 5.25∗∗∗
+106.34%Rule
(41.88%) 2.54∗∗
−13.97%Inv.×Rule
(5.45%)
−2.56∗∗
(6)
with 82 observations (PseudoR2 = 28.6%). Standard errors (in parentheses) and t-statistics
appear below each coefficient. “**” and “***” denote significance at the 95% and 99%
levels of confidence, respectively. Inv. is investment measured by the amount sent. Rule is
measured as a decimal.12
The overall effect of rules is positive, reflecting the forced increase in the 10% through 30%
range. The drop between 0% and 10% is picked up in the indirect investment and interaction
effects. Higher investment elicits higher returns, but we already know investment drops with
the 10% rule (see regression equation 4). This is consistent with Result 1. Further, according
to the interaction term, rules significantly dampen the ability for investors to elicit higher
returns through investment. This is consistent with Result 3 that investors are unable to
demonstrate trust by putting the full amount of their investment at risk.
The negative interaction in regression equation 6 indicates that rules dampen the ability
12
of investors to elicit reciprocal behavior through higher investment levels. We conjecture
that this arises because more restrictive rules constrain the trustees’ capabilities to take risk
(VAR) and demonstrate trust. To understand how much of the interaction effect is due to
rules reducing VAR or trust, we re-run the regression using VAR as the independent variable
representing trust directly. This results in the following estimated relationship:
Return Rate =
−5.56%
(6.27%) −0.89
+5.56%V AR
(0.97%) 5.76∗∗∗
+122.22%Rule
(25.89%) 4.72∗∗∗
−7.94%V AR×Rule
(8.48%) −0.94
(7)
with 82 observations (PseudoR2 = 27.9%). Standard errors (in parentheses) and t-statistics
appear below each coefficient. “***” denotes significance at the 99% level of confidence.
VAR is trust measured by the value placed at risk by the investor (jointly determined by
the investment level and the rule). Rule is measured as a decimal. Notice that, without
loss of explanatory power, the interaction term ceases to be significant. But, we still are not
measuring reciprocity: discretionary return rates.
To understand how much of the direct rule effect is due to the increase in minimum
man-dated returns and separate out the effects on discretionary returns, we re-run the regression
using the discretionary return rate as the dependent variable. This subtracts out the
non-voluntary component of the return rate and focuses solely on the discretionary reciprocity
voluntarily displayed by the trustee (that is, the return rate given above the mandatory
minimum). Estimation of this relationship gives:
Discretionary ReturnRate =
−5.56%
(6.27%)
−0.89
+5.56%V AR
(0.97%) 5.76∗∗∗
+22.22%Rule
(25.90%) 0.86
−7.94%V AR×Rule
(8.48%) −0.94
with 82 observations (Pseudo R2 = 28.8%).13 Notice that the only thing that changes is
the coefficient on Rule and its significance. This is because we subtract out exactly one
times the rule in each observation to arrive at the discretionary returns. All other variations
in returns are purely discretionary. The remaining direct effect of the rule on reciprocity
is not significant. That is, the entire significance of the rules’ direct effect is in the effect
on higher mandated returns, not on the discretionary behavior of trustees. In the end, the
only significant effect on reciprocity is through the amount of trust displayed in the value
at risk undertaken by the investors. (However, the amount of trust that can be displayed
is limited by the rule.) Again, this pattern is consistent with the Replacement Hypothesis,
here combined with a positive effect of trust on reciprocal behavior.
Combined, these regressions lead to the following summary result:
Result 5. The immediate effect of imposing a low minimum return rule is to decrease average
return rates. Return rates rise as increasingly restrictive rules force them up. Reciprocity falls
when rules are imposed and does not rise as rules become increasingly restrictive. Reciprocity
responds positively to trust displayed by investors through value at risk.
3.2.3 Summary of Regression Results
Combined, the regressions tell an interesting story. Investment falls when rules are imposed
and only rise with high levels of the rule. However, this rise is not due to more trust.
Trust, measured by VAR, is reduced by rules. While the amount invested increases with
the 30% rule, the rule itself prevents an overall increase in trust. This is consistent with the
Replacement Hypothesis, with trust falling when rules are exogenously imposed.
Higher return rates associated with more restrictive rules do not result from greater
reciprocity. Instead, any potential positive effects come indirectly from investors investing
more. Overall, when rules are implemented, investment and trust both fall, leading to lower
13
return rates. As rules increase the minimum mandated return, investment rates rise and,
consequentially, return rates increase. However, trustworthy reciprocity never returns.
Despite evidence that they encourage higher investment, “harder” rules hamper investors
from placing themselves at risk and demonstrating trust. The only significant factor driving
reciprocity (defined as returning more than the mandated minimum) is the amount of trust
demonstrated. But demonstrating trust is difficult under more restrictive rules. With the 0%
minimum return rule, each additional dollar invested generates 5.56% in discretionary returns
from the trustee (increasing return on investment by more than 16 percentage points). With
a 30% rule, the amount each additional dollar invested generates in discretionary returns is
cut to 1.37% (increasing return on investment by just over 4 percentage points).
4
Discussion
Interactions that require trust involve a basic social dilemma where agents have to trade off
self-interest and safety with the potential delayed benefits (both monetary and information)
that arise from trusting and reciprocal behavior. Trust is important because not all aspects
of exchange can be contracted or monitored. When trust violations harm agents, minimum
standards are attractive because they eliminate the worst trust violations while minimizing
monitoring and enforcement costs. However, rules may supplant naturally occurring trust
and, thus, cause more harm than good.
Trust based exchange systems have the advantage of not needing extensive contracting
and enforcement. However, sometimes trust is violated. To reduce the most egregious
violations, we often rely on rules that establish minimum standards. Such rules prevent the
worst abuses of trust relationships. They may also reinforce trusting and reciprocal behavior
by signaling that abusing trust is not acceptable. However, rules may also serve to calibrate
expectations about socially acceptable behaviors, indicating what return rates are “good
Therefore, the impact of rules on trust and reciprocity is ambiguous. We study trust based
exchange in a simple trust game by varying minimum standard rules.
In the trust game, trust leads to net monetary gains overall, may lead to profits for
investors, and allows participants to learn about each other through demonstrating trust
and reciprocity. Investors demonstrate trust by risking cash sent to trustees. Trustees
demonstrate trustworthy reciprocity by voluntarily giving back some money to investors.
Failure to trust eliminates potential monetary gains for both parties while the investor loses
the ability to learn about the trustworthiness of the trustee. Effectively, this is a situation
of nothing ventured, nothing gained. While minimum return rules reduce downside risk
for investors, they also limit the potential of the exchange to build trust, reciprocity, and
generate information about the exchange partner.
Overall, we find that experimentally creating and increasing a minimum standard
de-stroys reciprocal behavior and significantly reduces demonstrated trust. As rules increase,
investment increases, but trust never recovers nor do voluntary displays of reciprocity.14
Our results shed light on theory and have practical implications. First, our results
in-dicate both payoff and information effects of rules are important. Low minimum standard
rules can impose significant economic costs while driving down demonstrated trust and
reci-procity. With sufficiently restrictive rules, economic welfare may return. However, trust
and reciprocity never do. Thus, if a trust-based system functions well, imposing minimum
standards is unwise. However, if the unregulated system functions poorly, rules may bring
improvement, but only if sufficiently restrictive.
Second, our results are only consistent with agents who use the game to learn about each
other. By imposing rules on a trust based exchange, we disrupt an unambiguous
demonstra-14
tion of trust and reciprocity. Voluntary displays of reciprocity fall dramatically. Investment
also falls under a minimum return rule. Further, by increasing rules’ restriction on
discre-tionary returns, we show how demonstrated trust, investment, reciprocity, and economic
welfare respond to increasingly restrictive rules. While investment levels and economic
wel-fare rise under sufficiently restrictive rules, this does not represent a response to trust. It
reflects the simple fact that investors invest more when they have less at risk. This is only
consistent with participants who use the game to learn about their exchange partners.
Third, our findings that regulations may have adverse consequences are consistent with
the literature on crowding-out of economic incentives (Bowles and Reyes, 2012). Although
sufficiently restrictive minimum standard rules may increase economic welfare, they still
reduce demonstrated trust and reciprocity. There may also be a negative external effect
left for future research: not learning to trust because of restrictive rules in one context may
inhibit trust and reciprocal behavior in other situations where trust relationships would be
beneficial.
We study a relatively abstract and simple game that strips away many of the complexities
of face to face, business, or social context. The trust game’s simplification allows us a detailed
understanding of a simple trust based interaction. However, there are many analogs in more
complex environments and some tantalizing field evidence on the interaction between rules
and behavior that accord with our results. While imposing minimum requirement rules can
create benefits, adding rules or enforcing them can also be counter-productive, as the day
care and worker monitoring examples show.
In fact, in some situations, removing rules can improve outcomes. For example, the
“Monderman Principal” of traffic control (Clarke, 2006) shows that removing curbs, lane
markings, traffic signs, and other regulatory conventions, can improve traffic safety and
reduce congestion. As (Clarke, 2006, p. 291) puts it: “The driver. . . becomes an integral part
of the social and cultural context. As a result, behavior is controlled by everyday norms. . . ”
principal demonstrates how fewer rules can increase desirable behaviors, we show that rules
depress the desirable behaviors that trustees would otherwise demonstrate.
We believe the implications are clear: If a system based on trust is not broken or violations
of trust are infrequent, it is not wise to tamper with it by imposing minimum standards of
behavior. However, if a trust-based system is not functioning well in the absence of rules,
it might be improved with the addition of rules, but only rules that sufficiently restrict
opportunistic behavior.
References
B´enabou, R. and J. Tirole. “Incentives and Prosocial Behavior.”American Economic Review,
96(5), (2006), 1652–1678.
Berg, J. E., J. Dickhaut, and K. A. McCabe. “Trust, Reciprocity, and Social History.”
Games and Economic Behavior, 10, (1995), 122–142.
Bernheim, B. D. and M. D. Whinston. “Incomplete Contracts and Strategic Ambiguity.”
American Economic Review, 88(4), (1998), 902–932.
Bolton, G. E. and A. Ockenfels. “ERC: A Theory of Equity, Reciprocity, and Competition.”
American Economic Review, 90(1), (2000), 166–193.
Bowles, S. and S. P. Reyes. “Economic Incentives and Social Preferences: Substitutes or
Complements?” Journal of Economic Literature, 50(2), (2012), 368–425.
Camerer, C. F. Behavioral Game Theory: Experiments in Strategic Interaction. Princeton,
New Jersey: Princeton University Press, 2003.
Clarke, E. “Shared Space - The Alternative Approach to Calming Traffic.” Traffic
Croson, R. T. A. and M. B. Marks. “Step Returns in Threshold Public Goods: A Meta- and
Experimental Analysis.” Experimental Economics, 2(3), (2000), 239–259.
Davis, J. Exchange. Minneapolis, MN: University of Minnesota Press, 1992.
Dickinson, D. and M.-C. Villeval. “Does Monitoring Decrease Work Effort? The
Comple-mentarity between Agency and Crowding-out Theories.” Games and Economic Behavior,
63(1), (2008), 56–76.
Dufwenberg, M. and G. Kirchsteiger. “A Theory of Sequential Reciprocity.” Games and
Economic Behavior, 47(2), (2004), 268–298.
Falk, A. and M. Kosfeld. “The Hidden Costs of Control.” American Economic Review,
96(5), (2006), 1611–1630.
Fehr, E. and G. Kirchsteiger. “Insider Power, Wage Discrimination and Fairness.” Economic
Journal, 104(424), (1994), 571–583.
Fehr, E. and B. Rockenbach. “Detrimental Effects of Sanctions on Human Altruism.”Nature,
422, (2003), 137–140.
Fehr, E. and K. Schmidt. “A Theory of Fairness, Competition, and Cooperation.” The
Quarterly Journal of Economics, 114(3), (1999), 817–868.
Fischbacher, U. “z-Tree: Zurich toolbox for ready-made economic experiments.”
Experi-mental Economics, 10(2), (2007), 171–178.
Glaeser, E., D. L. Laibson, J. Scheinkman, and C. Soutter. “Measuring Trust.” Quarterly
Journal of Economics, 115(3), (2000), 811–846.
Gneezy, U. and A. Rustichini. “A Fine is a Price.” Journal of Legal Studies, 29(1), (2000),
Houser, D., E. Xiao, K. A. McCabe, and V. L. Smith. “When Punishment Fails: Research
on Sanctions, Intentions and Non-cooperation.” Games and Economic Behavior, 62(2),
(2008), 509–532.
Kahan, D. M. “Gentle Nudges vs. Hard Shoves: Solving the Sticky Norms Problem.”
Uni-versity of Chicago Law Review, 67(3), (2000), 607.
Kimball, M. S. “Precautionary Saving in the Small and in the Large.” Econometrica, 53–73.
Kurzban, R. and D. Houser. “Experiments investigating cooperative types in humans: A
complement to evolutionary theory and simulations.”Proceedings of the National Academy
of Sciences of the United States of America, 102(5), (2005), 1803–1807.
Levine, D. K. “Modeling Altruism and Spitefulness in Experiments.” Review of Economic
Dynamics, 1(3), (1998), 593–622.
Menezes, C., C. Geiss, and J. Tressler. “Increasing Downside Risk.” American Economic
Review, 70(5), (1980), 921–932.
M¨unscher, R., M. Vetter, and T. Scheuerle. “A Review and Taxonomy of Choice Architecture
Techniques.” Journal of Behavioral Decision Making, 29, (2015), 511–524.
Ostrom, E. and J. Walker. Trust and Reciprocity: Interdisciplinary Lessons for
Experi-mental Research. The Russell Sage Foundation Series on Trust. New York: Russell Sage
Foundation, 2003.
Rabin, M. “Incorporating Fairness into Game Theory and Economics.” American Economic
Review, 83(5), (1993), 1281–1302.
Rousseau, D. M., S. B. Sitkin, D. S. Burt, and C. F. Camerer. “Not so Different after All: A
Cross-discipline View of Trust.” Academy of Managment Review, 23(3), (1998), 393–404.
Segal, U. and J. Sobel. “Tit for Tat: Foundations of Preferences for Reciprocity in Strategic
Settings.” Journal of Economic Theory, 136(1), (2007), 197–216.
Sobel, J. “Interdependent Preferences and Reciprocity.” Journal of Economic Literature,
43(2), (2005), 392–436.
Thaler, R. and C. Sunstein. Nudge: Improving Decisions about Health, Wealth, and
Happi-ness. Yale University Press, New Haven, 2008.
Titmuss, R. M., A. Oakley, and J. Ashton. The Gift Relationship: From Human Blood to
Social Policy. New York, New York: The New Press, 1997.
A
Instructions for the R10 Treatment
This is an experiment in the economics of decision-making. Various research agencies have
provided funds for this research. The currency used in the experiment is experimental dollars,
and they will be converted to U.S. Dollars at a rate of 1 experimental dollars to 1 dollar.
At the end of experiment your earnings will be paid to you in private and in cash. It is very
important that you remain silent and do not look at other people’s work. If you have any
questions, or need assistance of any kind, please raise your hand and an experimenter will
come to you. If you talk, laugh, exclaim out loud, etc., you will be asked to leave and you
will not be paid. We expect, and appreciate, you adhering to these policies.
The participants in today’s experiment will be randomly assigned into two-person groups.
In addition to the group assignment each participant will also be randomly assigned to a
specific type in the group, designated as Person 1 or Person 2. You and the other
participant in your group will make choices that will determine your payoffs. The experiment
consists of two decision stages.
In stage 1, Person 1 receives $10 and then decides how many dollars to send to Person
by Person 1 is tripled before reaching Person 2. In stage 2, Person 2 decides how many of
the dollars they received to send back to Person 1. Person 2 can send back 10%, more than
10%, or all of the amount received back to Person 1. At that point the experiment is over.
Next we describe in detail the decisions made by both persons in each stage of the
experiment.
Stage 1
Person 1 receives $10 and then decides how many dollars to send to Person 2. Person 1 can
send none, more than none, or all of the $10. Person 1 enters the amount sent to Person 2
in the box labeled “The amount sent by Person 1” below. Person 1 keeps any amount that
is not sent to Person 2. The amount sent by Person 1 is tripled before reaching Person 2.
Decision Screen for Person 1 in Stage 1
Stage 2
After learning the amount sent by Person 1, Person 2 decides how many dollars to send back
to Person 1. Person 2 can send back 10%, more than 10%, or all of the amount in Person 2’s
account at that time. Person 2 enters the amount sent back to Person 1 in the box labeled
“The amount sent back by Person 2” below. The amount sent back by Person 2 is NOT
multiplied. Person 2 keeps any amount that is not sent back to Person 1.
Finally, at the end of the Stage 2 the total earnings are reported to each person. Person
Decision Screen for Person 2 in Stage 2
Person 2. Person 2’s earning will equal three times the amount sent by Person 1 less the
amount sent back to Person 1. Please record the decisions and your earnings on yourrecord
sheet under the appropriate heading.
Summary
The computer will assign you and one other participant to a two-person group, consisting of
Person 1 and Person 2. In stage 1, Person 1 receives $10 and then decides how many dollars
to send to Person 2. Person 1 can send none, more than none, or all of the $10. The amount
sent by Person 1 is tripled. In stage 2, Person 2 decides how many dollars to send back to
Person 1. Person 2 can send back 10%, more than 10%, or all of the amount in Person 2’s
account at that time. At the end of Stage 2 the total earnings are reported to each person.
This experiment is now over and your earnings will be part of the total you will be paid.
Numerical Examples
We list hypothetical amounts below at $0.25 intervals to illustrate how the amount sent by
If Then Person 2 Person 1 Person 2 can send back