ISSN Online: 2150-4105 ISSN Print: 2150-4091
Large Volume of Warm Water outside the Gulf
Stream
Kern E. Kenyon
4632 North Lane, Del Mar, USA
Abstract
Mixed layer depths are presented for the mid-latitude North Atlantic obtained from BT (bathythermograph) measurements for a 40 degree longitude band starting at Africa and moving west along 30 N. During February, 1959, 250 BTs were made in this region and they all show a distinct mixed layer depth greater than or equal to 85 meters. By comparing this east/west vertical tem-perature section with two other BT sections, one along 16 N and the other along 40 N taken one year earlier, but also in the cooling season (October, November), it is proposed that there was a northward drift in the surface layer between 16 N and 40 N that was cooled from above. Such a wide poleward flow of warm water, outside the Gulf Stream, is suggested to be the analogue of the permanent wide warm current off California in the North Pacific stu-died in some detail earlier.
Keywords
North Atlantic, Mixed Layer Depths, Northward Drift
1. Introduction
This manuscript’s title is taken from that of Section 141 in the classical book from the 1800s by Maury, which begins as follows [1]. “Let us return (Sec. 129) to this great expanse of warm water which, coming from the torrid zone on the southwestern side of the Atlantic, drifts along to the north on the outside of the Gulf Stream. Its velocity is slow, not sufficient to give it the name of current; it is a drift, or what the sailors call a ‘set’. By the time this water reaches the parallel of 35 or 40 degrees it has parted with a good deal of its heat…”
Maury’s remarks, based on sea surface temperatures collected and charted under his supervision, are the beginnings of an idea that did not flourish. An at-tempt is made here to build upon the idea by describing and analyzing some How to cite this paper: Kenyon, K.E.
(2017) Large Volume of Warm Water out-side the Gulf Stream. Natural Science, 9, 63-66.
https://doi.org/10.4236/ns.2017.93006
Received: February 28, 2017 Accepted: March 28, 2017 Published: March 31, 2017
Copyright © 2017 by author and Scientific Research Publishing Inc. This work is licensed under the Creative Commons Attribution International License (CC BY 4.0).
http://creativecommons.org/licenses/by/4.0/
K. E. Kenyon
64
supporting data from the 1900s of a type that was unavailable to Maury. In par-ticular, his use of the term “volume” will be justified by means of a few sets of very many BT (bathythermograph) measurements, i.e. temperature versus depth curves from the surface down to a few hundred meters.
Although Maury was undoubtedly the first to describe a wide warm surface layer drifting poleward in any ocean, the North Atlantic in his case, since then they have been uncovered in other oceans as well, starting initially and indepen-dently in the North Pacific [2] and later in the South Pacific [3].
2. BT Data
From Fuglister’s Atlantic Ocean Atlas [4] three east/west vertical temperature sections from the North Atlantic are selected for discussion; each section being composed of very many individual BT measurements. Latitudes of the sections are 16, 30 and 40 N, and they all took place in a cooling season. Results from two of the sections (16, 40) are displayed on the same page of the atlas and need not be repeated here. However, the third section is in the form of raw data making it difficult to compare with the other two. Some basic analysis of that data has therefore been carried out (Figure 1).
Sections 16 and 40 were completed consecutively in the same year; October and November of 1957. If it were not for the relatively large separation in lati-tude between them, readers might be tempted to compare temperature features of one with the other. For example, extensive regions of significant mixed layers occur in both sections. Could there be a physical connection between these two elongated mixed layer areas, a volume perhaps?
[image:2.595.209.537.462.678.2]A straightforward way to connect up the surface layers of the two sections is
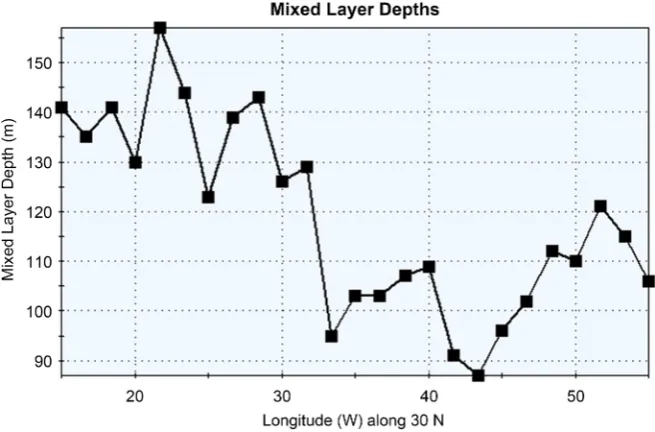
Figure 1. Mixed layer depths as a function of longitude along 30 N in the North Atlantic
suggesting that there is a broad drift of warm surface water moving north be-tween them. Consistent with this concept is the existence of the two longitudi-nally extensive mixed layers which could be produced by cooling the sea surface from above. Of course it would be nice to have had a vertical temperature sec-tion midway between 16 and 40 N. That did occur at 30 N but one year and three months later (February, 1959).
What the data along 30 N consist of is a collection of about 300 individual BT traces of temperature as a continuous function of depth that were made every hour on the hour as the ship sailed east from North America to Africa. Each trace in the atlas is roughly a square 2 mm on a side. With a magnifying glass the surface temperature and mixed layer depth were read and averaged in groups of ten (Figure 1). Readings started at Africa and proceeded west, 250 each of tem-perature and mixed layer depth; temtem-peratures were estimated to the nearest 0.1 C and mixed layer depths to the nearest 5 m.
As Figure 1 shows the averaged mixed layer depth is everywhere greater than 85 m over a longitude bandwidth of 40 degrees. On the other hand, the mixed layer depth along 16 and 40 N is generally less than 85 m but still continuous with longitude. Admittedly the BTs along 30 N were taken in a different year, but what is probably more important is that February is deeper into the cooling season than October and November are. Greater cooling from above is expected to produce greater mixed layer depths, assuming the northward drift to be a permanent large-scale circulation feature (30 years of SST data have rendered this assumption almost certainly true for the analogous wide warm surface cur-rent of the North Pacific off California).
Surface temperatures were not included in Figure 1 because they showed no obvious correlation with the mixed layer depths. Perhaps a little more effort might yield an interesting result.
3. Discussion
Unexplained is the variability in the depth of the mixed layer in Figure 1, even after each group of ten consecutive values has been block averaged. That may prove to have an intrinsic interest for a future investigation. In the present situa-tion it is enough to note that 250 BT traces in a row, crossing from Africa through the interior of the mid-latitude North Atlantic, all have a distinct mixed layer in the winter season.
K. E. Kenyon
66
Also the southwestern tropical North Atlantic, excluding the Gulf of Mexico, exhibits a remarkable SST feature similar to what the SSTs of the North and South Pacific show [5]: the highest sea surface temperatures always occur there but they are not significantly higher in summer than in winter, in spite of the self-evident truth that more solar energy per unit time and per unit area is ab-sorbed in summer than in winter. For a heat balance of the surface layer, excess heat must be exported at all times out of the tropics, and a broad northward ad-vection is the most reasonable method of doing this. It is not credible to think that the narrow Gulf Stream could do this job on its own.
Finally, the mixed layer acts like a dye to make visible the northward drift of waters at and near the surface. And in the middle of the North Atlantic, where the Bermuda-Azores high pressure cell is a permanent atmospheric feature, no prominent wind is expect to stir up the water.
4. Conclusion
There is a large volume of warm water outside the Gulf Stream, and it drifts to the north as forecast by Maury. Supporting evidence is provided by hundreds of temperature vs. depth curves from BT measurements along three latitude lines: 16, 30, and 40 N. Continuous mixed layers extending 40 degrees of longitude along all three lines in fall and winter months are consistent with warm water moving north and being cooled from above. The wide warm poleward flow of surface layer water predicted for the North Atlantic is analogous to similar flows already documented for the North and South Pacific.
References
[1] Maury, M.F. (1963) The Physical Geography of the Sea and Its Meteorology. Belk-nap Press of Harvard University Press, Cambridge, 61.
[2] Kenyon, K.E. (1981) A Shallow Northeastward Current in the North Pacific. Journal of Geophysical Research: Oceans, 86, 6529-6536.
https://doi.org/10.1029/JC086iC07p06529
[3] Kenyon, K.E. (2012) Southward Surface Flow in the Central South Pacific. Natural Science, 4, 819-824. https://doi.org/10.4236/ns.2012.411109
[4] Fuglister, F.C. (1960) Atlantic Ocean Atlas, Woods Hole Oceanographic Institution, Woods Hole, MA.
Submit or recommend next manuscript to SCIRP and we will provide best service for you:
Accepting pre-submission inquiries through Email, Facebook, LinkedIn, Twitter, etc. A wide selection of journals (inclusive of 9 subjects, more than 200 journals)
Providing 24-hour high-quality service User-friendly online submission system Fair and swift peer-review system
Efficient typesetting and proofreading procedure
Display of the result of downloads and visits, as well as the number of cited articles Maximum dissemination of your research work