ISSN Online: 2168-5444 ISSN Print: 2168-5436
Image Noise Analysis of a Large Ring PET
Scanner
M. M. Ahasan
1*, S. Akter
2, R. Khatun
2, M. F. Uddin
1, A. N. Monika
1, M. A. Rahman
1, M. N. Khanam
31Institute of Nuclear Medical Physics, AERE, Savar, Bangladesh 2Medical Physics Division, Atomic Energy Centre, Dhaka, Bangladesh 3Infertility Unit, Department of Gynae & Obs, BSMMU, Dhaka, Bangladesh
Abstract
Image noise analysis of a large ring PET scanner “macro PET” performed us-ing two different phantoms, namely a Jaszczak SPECT phantom and a uni-form cylindrical phantom. In the present work, simple 2D filtered back pro-jection was used to reconstruct all the images, and in almost all the cases a Hamming filter of cutoff frequency 0.4 and a 256 by 256 matrix with zoom factors from 1 to 4 were used in order to investigate the imaging capabilities of the new scanner and the influence of filter and cut-off frequency on the fil-tered back projected images. Results indicate that 11.1 mm cold rod in the Jaszczak phantom images can consistently be seen. The Coefficient of varia-tion (CV) results for Hann and Hamming filters are very similar and increase approximately in linear fashion with higher cutoff frequency. The value of CV for the Parsen filter is lower than the value for Hann and Hamming filters. It concludes that all filters with low cut off-frequency (<0.6) would suppress
image noise but decrease contrast.
Keywords
PET, Sinogram, Filter & CV
1. Introduction
Positron emission tomography (PET) is a powerful radiotracer imaging tech-nique, in which the distribution of radiolabelled tracer molecules in a patient is measured by detecting pairs of back-to-back gamma rays produced in posi-tron-electron annihilation. This functional imaging technique has been used for the last few decades in many clinical applications [1][2] such as the detection and diagnosis of malignant carcinoma [3], in monitoring response after therapy
[4].
How to cite this paper: Ahasan, M.M., Akter, S., Khatun, R., Uddin, M.F., Monika, A.N., Rahman, M.A. and Khanam, M.N. (2017) Image Noise Analysis of a Large Ring PET Scanner. International Journal of Me- dical Physics, Clinical Engineering and Ra- diation Oncology, 6, 208-215.
https://doi.org/10.4236/ijmpcero.2017.62019
Received: April 4, 2017 Accepted: May 23, 2017 Published: May 26, 2017
Copyright © 2017 by authors and Scientific Research Publishing Inc. This work is licensed under the Creative Commons Attribution International License (CC BY 4.0).
Figure 1. A photograph of the macro PET system [5].
The large ring PET scanner “macro PET” (Figure 1) with an inner diameter of 2.34 m was created by reconfiguring components from an original ECAT 951
[6]. The original system has 32 detector modules (“buckets”) mounted in two rings with an inner diameter of 100 cm and a 10.8 cm axial FOV.
The original system is based on bismuth germanate (BGO) block detectors. Each block consists of a BGO crystal 50 × 60 × 30 mm3, backed by four photo-multiplier tubes (PMTs). The front of the crystal is cut into an 8 × 8 array of crystal elements, each 6.25 × 6.75 mm2. The blocks are grouped into buckets each comprising four detector blocks together with their associated electronics (preamplifiers and discriminators) under the control of a microprocessor. Data from all the buckets are fed to a set of coincidence processors which identify events in which a pair of 511 keV γ-rays have been detected in two buckets within the system resolving time of 6 ns. For the new large ring system “macro-PET’’, the detector blocks have been remounted in a single horizontal ring of 128 blocks.
A delayed timing window was used to record the distribution of random coincidences. Data were initially recorded in histograms (prompt minus delayed events) appropriate to the image planes of the original geometry and were then rebinned into the correct sinograms for the new geometry. In this rebinning the gaps between blocks were allowed for by treating each large ring as if it consisted of 1152 (128 × 9) crystal elements with every ninth detector absent, and interpo-lation was used to complete the missing sinogram elements. Arc correction of the projection data was achieved by performing a further rebinning with linear weighting.
The influence of filter and cut-off frequency on the filtered back projected image noise and contrast were investigated. The noise level was investigated by computing the coefficient of variation (CV) from the reconstructed image for a uniform cylindrical phantom in no-septa configuration.
2. Materials and Method
energy window from 250 keV to 850 keV were accepted from the system. Simple 2D filtered back projection has been used to reconstruct all the images presented here, and in almost all the cases a Hamming filter of cutoff frequency 0.4 and a 256 by 256 matrix with zoom factors from 1 to 4 were used. Different filter win-dow functions and a range of cut-off frequencies were considered with filtered back projected images for this study.
2.1. Jaszczak SPECT Phantom
The Jaszczak SPECT phantom (Deluxe) is often used for assessing the image quality in nuclear medicine images. It consists of a cylinder with perspex inserts which create cold lesions when the phantom is filled with radioactive solution. In the present work, a Jaszczak SPECT phantom with interior dimensions of 21.6 cm long and 18.6 cm in diameter was used, containing six solid (perspex) spheres of different sizes located in the upper section and six different sets of cy-lindrical rods in the lower section. The cold rod dimensions are 4.8 mm, 6.4 mm, 7.9 mm, 9.5 mm, 11.1 mm, 12.7 mm.
The data were obtained in no-septa mode by filling only the lower half of the phantom with approximately 2.5 litres of water, and adding approximately 200 MBq of 18-F. Data were acquired for 600 s per image, with the phantom mounted at the centre of the field of view and at different radial offsets. Each image was reconstructed using filtered back projection and incorporating the calculated at-tenuation correction for a water-filled cylinder. Different values of cutoff fre-quency (expressed as a fraction of the Nyquist frefre-quency) were applied to each filter window function.
2.2. Uniform Phantom
Two types of uniform cylindrical phantom containing short (18-F, t1/2= 109.8 min) and long half life (68-Ge, t1/2 = 270.8 d) sources were used. In both cases, the uniformity and noise level of the reconstructed images were investigated by computing the coefficient of variation (CV).
2.2.1. Short Half Life Uniform Phantom
The short half life uniform phantom was prepared from a 20 cm diameter cylin-drical phantom with an axial length of 20 cm filled with 18-F solution only to the depth of the FOV.
2.2.2. Long Half Life Uniform Phantom
the same area with a radius of 2 cm for each case.
3. Results and Discussion
3.1. Sinograms at Different Radial Positions
Sinograms produced by imaging the Jaszczak SPECT phantom at three locations inside the system are presented in Figure 2.
The results indicate that the sinograms produced by positioning the phantom at the scanner centre are consistently good. Sinograms are distorted as radial offset increases due to the variations of LOR spacing. This distortion was com-pensated in the reconstructed images by arc correction.
[image:4.595.209.537.351.502.2]Images at the Scanner Centre
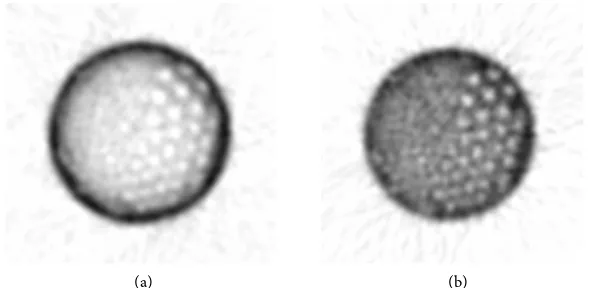
Figure 3 shows the central plane reconstructed image from the Jaszczak SPECT phantom mounted at the centre of the field of view, with and without attenua-tion correcattenua-tion. The phantom contains 6 sets of cold rods, of which the largest (12.7 mm diameter) rods are clearly visible, as are the second set (11.1 mm). The third set of rods (9.5 mm) is also just visible in the attenuation corrected image. This image corresponds to a total of 45M events (all 15 planes).
[image:4.595.226.522.556.700.2]
(a) (b) (c)
Figure 2. Sinograms produced by imaging the Jaszczak SPECT phantom at different
lo-cations in the scanner field of view. (a) At the centre; (b) At 25 cm off centre; (c) At 45 cm off centre.
(a) (b)
Figure 3. Image of the central Jaszczak SPECT phantom. (a) Without attenuation
3.2. Uniform Phantom
Two types of uniform cylindrical phantom containing short (18-F) and long half life (68-Ge) sources were used for investigating the uniformity and noise level of the reconstructed images.
3.2.1. Short Half Life Uniform Phantom
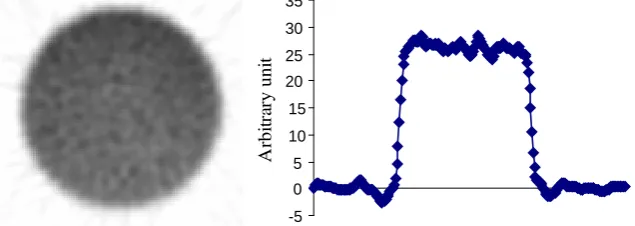
The short half life uniform phantom was prepared from a 20 cm diameter cylin-drical phantom with an axial length of 20 cm filled with 18-F solution only to the depth of the FOV. Figure 4 shows image plane from the 20 cm diameter uni-form phantom, positioned at the centre of the field of view, imaged at the value of specific activity: 100 M counts in 600 s. Also shown in each case is the hori-zontal profile across the image. The coefficient of Variation (CV) of the image was calculated as 5.7% ± 0.2% from the ratio of standard deviation (σ) to the
mean pixel counts (μ). Some of the other image planes show weak ring artefacts in the reconstructed images. The source of these artefacts and variations needs to be further investigation.
3.2.2. Long Half Life Uniform Phantom
Reconstructed images of a central slice (slice 8) of the phantom using Hann filter with cutoff frequency of 0.2 and 0.6, and the same plane reconstructed by Parsen filter with cutoff frequency of 0.4 and 0.8 are shown in Figure 5. The image (top-left) with low cut-off frequency shows ringing artefact and the image (bot-tom-left) shows a similar artefact, but suppress the noise. Conversely, the images (top- and bottom-right) with higher cut-off frequency do not show any artefact, but introduce noise.
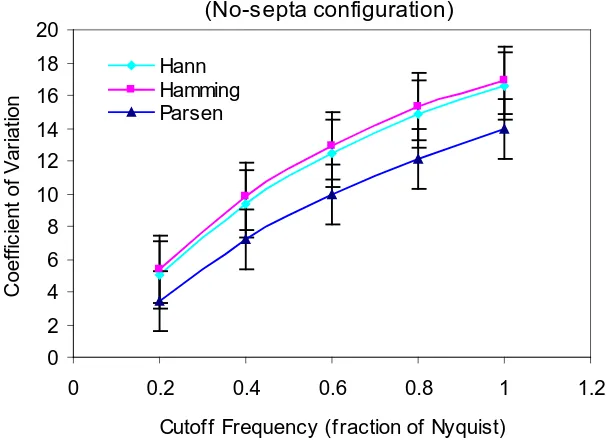
The coefficient of variation for a central slice of the uniform cylindrical source versus the filter cutoff frequency for three filters (Hann, Hamming and Parzen) is shown in Figure 6. The values of CV for Parzen filter are lower than the values for Hann and Hamming filters. The CV results for Hann and Hamming filters are very similar (slightly higher in case of Hamming filter) and are increasing approximately in linear fashion with the increase of cutoff frequency. The CV results in Figure 6 are consistent with the images in Figure 5 and are also con-sistent with other study [7] using mini PET [8].
[image:5.595.215.533.589.702.2]The coefficient of variation for all image planes of the same phantom were al-
Figure 4. Uniform phantom image and the corresponding horizontal profile across the
centre of the image.
-5 0 5 10 15 20 25 30 35
A
rbi
tra
ry uni
Hann_0.2 Hann_0.6
[image:6.595.244.506.70.348.2]
Parzen_0.4 Parzen_0.8
Figure 5. Image plane (plane 8) for a uniform 68-Ge cylindrical phantom recon structed
with Hann and Parzen filter and its different cut-off frequency.
Figure 6. Coefficient of variation (σ/μ) for a central plane (plane 8) of a 68-Ge uniform
cylinder as a function of cutoff frequency for three filters.
so computed for different filters using a cutoff frequency of 0.2 as shown in Fig-ure 7. The Parsen filter consistently gives lower CV values than the other filters and also gives less variation in CV between planes. The Hann and Hamming fil-ters give indistinguishable results for all planes. In all cases planes 4 - 6 and 11 - 13 have lower CV values than the other planes.
(No-septa configuration)
0 2 4 6 8 10 12 14 16 18 20
0 0.2 0.4 0.6 0.8 1 1.2
Cutoff Frequency (fraction of Nyquist)
C
oef
fic
ient
of
V
ar
iat
ion
[image:6.595.220.523.394.614.2]Figure 7. Coefficient of Variation (σ/μ) for a 68-Ge uniform cylinder as a function of image plane number for different filters.
4. Conclusion
The Jaszczak SPECT phantom contains 6 sets of cold rods, of which the largest (12.7 mm diameter) rods are clearly visible, as are the second set (11.1 mm). The third set of rods (9.5 mm) is also just visible in the attenuation corrected image. For uniform phantom images, the coefficient of variation increases with cutoff frequency as expected. All filters with low cut off-frequency (<0.6) would
sup-press image noise but decrease contrast. The value of CV for the Parsen filter is lower than the value for Hann and Hamming filters.
Acknowledgements
The authors express their thanks to Professor David J. Parker, Director of the Birmingham University Positron Imaging Centre, UK for giving technical sup-port in this work. The authors are also grateful to the Islamic Development Bank (IDB) for giving necessary financial support to continue this research.
References
[1] Das, C., Kumar, R., Balakrishnan, V.B., Chawla, M. and Malhotra, A. (2008) Disse-minated Tuberculosis Masquerading as Metastatic Breast Carcinoma on PET-CT.
Clinical Nuclear Medicine, 33, 359-361.
https://doi.org/10.1097/RLU.0b013e31816a858e
[2] Couto, P.J. and Milis, R.M. (2015) PET Imaging of Epigenetic Influences on Alz-heimer’s Disease. International Journal of Alzheimer’s Disease, 2015, 1-11.
https://doi.org/10.1155/2015/575078
[3] Bridges, R.L., Wiley, C.R., Christian, J.C. and Strohm, A.P. (2007) An Introduction to Na18F Bone Scientigraphy: Basic Principles, Advanced Imaging Concepts, and
Case Examples. Journal of Nuclear Medicine Technology, 35, 64-76.
https://doi.org/10.2967/jnmt.106.032870
[4] Weber, W.A. (2005) Use of PET for Monitoring Cancer Therapy and for Predicting Outcome. Journal of Nuclear Medicine, 46, 983-995.
(No-septa Configuration)
0 9 18 27
0 4 8 12 16
Image Plane Number
C
oef
fi
c
ient
of
V
ar
iat
ion
Hann Hamming
[5] ECAT 951, 953 (1985) Service Manual. Siemens Medical System, Testing & Diag-nostics.
[6] Ahasan, M.M. and Parker, D.J. (2009) Design and Initial Performance Evaluation of a Prototype Large Ring PET Scanner. In: Ao, S.I., et al. Eds., Advances in Electrical Engineering and Computational Science, Springer, Vol. 14, 161-172.
https://doi.org/10.1007/978-90-481-2311-7_14
[7] Ahasan, M.M., Khanam, M.N., Awal, M.A., Khatun, R., Akter, S. and Atikue Ullah, A.K.M. (2013) Image Noise Analysis of a 0.2 m Field of View PET Camera. Bangla-desh Journal of Nuclear Medicine, 16, 32-35.
[8] Ahasan, M.M. and Parker, D.J. (2009) Design and Coincidence Issues of a Small Ring PET Camera. Bangladesh Journal of Nuclear Medicine, 12, 138-141.
Submit or recommend next manuscript to SCIRP and we will provide best service for you:
Accepting pre-submission inquiries through Email, Facebook, LinkedIn, Twitter, etc. A wide selection of journals (inclusive of 9 subjects, more than 200 journals)
Providing 24-hour high-quality service User-friendly online submission system Fair and swift peer-review system
Efficient typesetting and proofreading procedure
Display of the result of downloads and visits, as well as the number of cited articles Maximum dissemination of your research work
Submit your manuscript at: http://papersubmission.scirp.org/
![Figure 1. A photograph of the macro PET system [5].](https://thumb-us.123doks.com/thumbv2/123dok_us/7758183.711672/2.595.275.475.70.223/figure-a-photograph-of-the-macro-pet-system.webp)