rspa.royalsocietypublishing.org
Research
Cite this article:Guan G, Hirsch M, Syam WP, Leach RK, Huang Z, Clare AT. 2016 Loose powder detection and surface characterization in selective laser sintering via optical coherence tomography.Proc. R. Soc. A472: 20160201.
http://dx.doi.org/10.1098/rspa.2016.0201
Received: 22 March 2016 Accepted: 17 June 2016
Subject Areas:
materials science, mechanical engineering
Keywords:
optical coherence tomography, selective laser sintering, additive manufacturing,in situ monitoring, part integrity
Author for correspondence: Adam T. Clare
e-mail:[email protected]
Loose powder detection and
surface characterization in
selective laser sintering via
optical coherence tomography
Guangying Guan
1
, Matthias Hirsch
1
,
Wahyudin P. Syam
1
, Richard K. Leach
1
,
Zhihong Huang
2
and Adam T. Clare
1
1
Advanced Manufacturing Technology Research Group, Faculty of
Engineering, University of Nottingham, University Park,
Nottingham NG7 2RD, UK
2
School of Engineering, Physics and Mathematics, University of
Dundee, Dundee DD1 4HN, UK
ATC,0000-0001-7359-3693
Defects produced during selective laser sintering (SLS) are difficult to non-destructively detect after build completion without the use of X-ray-based methods. Overcoming this issue by assessing integrity on a layer-by-layer basis has become an area of significant interest for users of SLS apparatus. Optical coherence tomography (OCT) is used in this study to detect surface texture and sub-surface powder, which is un-melted/insufficiently sintered, is known to be a common cause of poor part integrity and would prevent the use of SLS where applications dictate assurance of defect-free parts. To demonstrate the capability of the instrument and associated data-processing algorithms, samples were built with graduated porosities which were embedded in fully dense regions in order to simulate defective regions. Simulated in situ measurements were then correlated with the process parameters used to generate variable density regions. Using this method, it is possible to detect loose powder and differentiate between densities of ±5% at a sub-surface depth of approximately 300µm. In order to demonstrate the value of OCT as a surface-profiling technique, surface texture datasets are compared with focus
2
rspa.r
oy
alsociet
ypublishing
.or
g
Proc
.R
.S
oc
.A
47
2
:2
0160201
...
variation microscopy. Comparable results are achieved after a spatial bandwidth-matching procedure.
1. Introduction
Process monitoring and process control methodologies are commonplace for established machining processes, but are not currently applied in additive manufacturing (AM) methods [1]. The high-integrity applications which justify the use of AM require a step-change in the control that users have over the machine technology in order to effect a repeatable and verifiable sintering regime. Defects in selective laser sintering (SLS) have been well catalogued [2]. There has been significant effort to control feedstock, indirectly monitor sintering and control machine processes, which is reported in [3–5] and in Evertonet al.’s review on the subject [6]. Despite this effort, assurance cannot be provided through current technologies for the success of an operation. Optical coherence tomography (OCT) is proposed here as an excellent method for detecting sub-surface defects in components fabricated by SLS.
OCT has been used in a wide range of applications where the material properties of the object being measured permit sufficient transmission of the incident laser light. There continues to be significant interest in the use of OCT in the biomedical sector for ophthalmic diagnosis [7] and more recently for the identification of near-surface defects in multiple tissue types [8–10]. With respect to applications in manufacturing technology, OCT has also been explored for use in composites manufacture [11,12]. Dunkerset al. [13] used OCT to characterize defects that are apparent in the preparation of glass fibre composites, which offered new insight into the material integrity. The data that are captured by OCT when deployed in a manner specific to the process and application are of significant value to manufacturers of high-value parts.
In this study, OCT is used to interrogate the SLS processex situ. In order to classify sub-surface regions of un-melted and partially melted powder, specimens were prepared by varying incident energy density. Intensity profiles are investigated as a tool to measure interface effects and identify simulated failings in the sintering process. OCT has also been compared with a focus variation microscope to assess its capability to measure the surface texture of AM build layers; this demonstrated that OCT is a viable technique for inclusion in future SLS systems where in-build defects cannot be tolerated.
2. Material and methods
(a) Optical coherence tomography arrangement
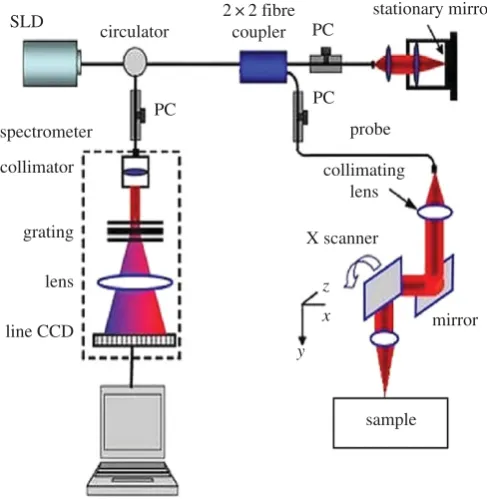
In this work, a spectral domain phase-sensitive OCT (PhS-OCT) system, detailed elsewhere [14], is employed to capture cross-sectional structural images. A simplified schematic diagram of the PhS-OCT system is shown infigure 1. The PhS-OCT system employs a super-luminescent diode (SLD) as the light source, with a peak wavelength of 1310 nm and a bandwidth of approximately 110 nm, implemented in a spectral domain configuration. The sample arm uses an objective lens of 30 mm focal length to deliver the light to the test sample. The OCT system provides an axial resolution of 7.2µm and a lateral resolution of 15µm in air. The acquisition rate was determined by the spectrometer employed in the system, which had a maximum rate of 92 000 A-scans (an A-scan is a routine type of diagnostic test which provides data on the length of the eye) per second and generated a frame rate of 180 frames s−1when the A-lines were set to 512 per frame.
3
rspa.r
oy
alsociet
ypublishing
.or
g
Proc
.R
.S
oc
.A
47
2
:2
[image:3.493.123.367.43.293.2]0160201
...
SLD
PC
PC
probe
collimating lens
X scanner
z
x
y
mirror
sample PC
spectrometer
collimator
grating
lens
line CCD
circulator
2 × 2 fibre coupler
stationary mirror
Figure 1.Schematic of the typical spectral domain PhS-OCT system set-up used in this study. (Online version in colour.)
directed to the sample via a two-dimensional (2D) scanning galvo-mirror. The reflected light from the reference arm and the backscattered light from the sample arm are sent to a high-speed spectrometer, which is capable of detecting the interference pattern. The spectrometer consists of a 30 mm focal length collimator, a 1200 lines mm−1transmission grating, a 100 mm focal length achromatic lens and a 14-bit, 1024 pixel InGaAs line-scan camera.
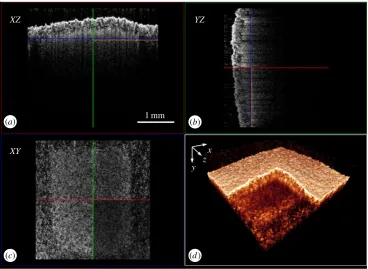
The method for the acquisition of a cross-sectional 2D structural image in AM specimens is described elsewhere [2]. OCT performs cross-sectional imaging by measuring the magnitude and echo time delay of backscattered light. Cross-sectional images are generated by performing multiple axial measurements of echo time delay (axial scans or A-scans) and scanning the incident optical beam transversely. Images, or B-scans, were generated by multiple A-scans; in this study, one B-scan consists of 512 A-scans. Three-dimensional (3D) volumetric datasets can be achieved by multiple B-scans, which are controlled by the 2D scanning galvo-mirror system. A typical 512 B-scan dataset collection takes less than 3 s.Figure 2dshows the 3D structural image of an SLS specimen with the top corner cropped for observation of sub-surface features.Figure 2a–cshows one B-scan from three planes and an isometric visualization.
(b) Sample preparation
4
rspa.r
oy
alsociet
ypublishing
.or
g
Proc
.R
.S
oc
.A
47
2
:2
0160201
...
XZ
XY
z y
x YZ
1 mm
(b)
(a)
[image:4.493.63.432.40.309.2](c) (d)
Figure 2.A typical 3D volumetric OCT structural image of a specimen with stark density variation: (a)XZ-plane view, (b)YZ -plane view, (c)XY-plane view and (d) 3D view with the top corner cropped. (Online version in colour.)
3. Results
(a) Surface texture measurement by optical coherence tomography and focus variation
microscopy
An SLS sample was measured by two different optical instruments: focus variation microscopy (FVM) [15–17] and the OCT system developed here for use with AM specimens. The main goal was to compare the capability of OCT in measuring surface texture (both profile and areal) with that of FVM. For surface texture measurement, the optical instrument is traced to a stylus (contact) instrument. The stylus (contact) instrument measurement result is well understood because mechanical contact between the stylus tip and a measured surface can be well modelled. Owing to this well-understood result, the stylus instrument is used as the reference measurement. Hence, the FVM instrument is verified by comparing it with the stylus instrument. The comparison is carried out by measuring a Rubert 529X reference standard. Comparison data are shown in table 1. These data demonstrate that the results from FVM are in good agreement with the stylus instrument’s results.
Comparing the profile or areal surface texture data acquired from two different instruments is not a straightforward process and a specific procedure should be followed that accounts for variations in instrument characteristics. Specifically, the measurement and data-processing conditions should be as similar as possible [18].
5
rspa.r
oy
alsociet
ypublishing
.or
g
Proc
.R
.S
oc
.A
47
2
:2
[image:5.493.135.361.41.193.2] [image:5.493.55.443.273.488.2]0160201
...
1
2
3
Figure 3.Measurement locations on the SLS sample with sub-surface regions of semi-consolidated powder. (Online version in colour.)
Table 1.Summary of comparison results for Alicona and Talysurf 50.
profile texture
vertical original downsampling sampling L(evaluation resolution sampling multiplier distance length)
description instrument (nm) distance (µm) (×) (µm) (mm) λs (µm) Rubert 529X
stylus (2µm tip)
Talysurf 50 16 0.5 1 0.5 1.25 2.5
. . . . Rubert 529X
(20×)
Alicona 30 0.44 1 0.44 1.25 2.5
description instrument λc (mm) Ra(µm) Ra(µm) Ra(µm) mean (µm) σ(µm) Rubert 529X
stylus (2µm tip)
Talysurf 50 0.25 0.0826 0.0805 0.0813 0.081 0.001
. . . . Rubert 529X
(20×)
Alicona 0.25 0.0812 0.0865 0.0866 0.085 0.003
. . . .
correspond to the area with sub-surface powders not scanned by the laser or 0 W energy; 2 is the area scanned by 6 W laser energy.
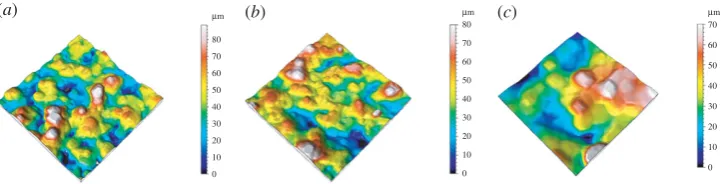
The measurement results from the OCT are in the format of sliced 2D images. For this reason, image processing has to be carried out to extract the profiles from every 2D image in the image stack and combine them into 3D surface data. The sample data were levelled before analysis, by least-squares fitting to a line or plane. The sampling distance (i.e. distance between data points) of the OCT is 6.8µm, whereas, for FVM, the sampling distance is 1.75µm. To match the sampling distances, the data from the FVM measurement is numerically resampled, giving a new effective sampling distance of 7µm. The measurement area for SLS 11 and SLS 21 is 800×800µm and for SLS 31 it is 400×400µm. The evaluation lengthsLfor SLS 11 and SLS 21 are 800µm and for SLS 31Lis 400µm.Figure 4shows the surface topography data obtained by OCT. Data obtained by FVM after resampling are presented infigure 5.
6
rspa.r
oy
alsociet
ypublishing
.or
g
Proc
.R
.S
oc
.A
47
2
:2
0160201
... 150 mm 140 130 120 110 90 80 100 70 60 50 40 30 20 10 0 mm mm 140 130 120 110 90 80 100 70 60 50 40 30 20 10 0 90 80 100 70 60 50 40 30 20 10 0(b)
(a) (c)
Figure 4.Surface topography data obtained from the OCT instrument. (a) SLS 11, (b) SLS 21 and (c) SLS 31. Note that the area of SLS 31 (c) is 400×400µm. (Online version in colour.)
mm 80 70 60 50 40 30 20 10 0 mm 80 70 60 50 40 30 20 10 0 mm 70 60 50 40 30 20 10 0
(b)
(a) (c)
Figure 5.Surface topography data obtained from FVM after resampling. (a) SLS 11, (b) SLS 21 and (c) SLS 31. Note that the area of SLS 31 (c) is 400×400µm. (Online version in colour.)
Table 2.Summary of profile and areal texture with filter parameters.
profile texture
original sampling sampling L(evaluation λs λc Ra(¯y±2σ) sample instrument distance (µm) distance (µm) length) (mm) (µm) (mm) (µm)
SLS 11 FVM 5× 1.75 7 0.8 12 0.8 10.17±1.74
. . . .
OCT 6.8 6.8 0.8 12 0.8 11.81±2.68
. . . .
SLS 21 FVM 5× 1.75 7 0.8 12 0.8 11.03±1.33
. . . .
OCT 6.8 6.8 0.8 12 0.8 12.72±3.7
. . . .
SLS 31 FVM 5× 1.75 7 0.4 12 0.4 9.49±2.31
. . . .
OCT 6.8 6.8 0.4 12 0.4 10.48±1.54
areal texture
original sampling sampling L(evaluation S-filter L-filter Sa(¯y±σ) sample instrument distance (µm) distance (µm) length) (mm) (µm) (mm) (µm)
SLS 11 FVM 5× 1.75 7 0.8 12 0.8 14.18±0.72
. . . .
OCT 6.8 6.8 0.8 12 0.8 15.34±1.47
. . . .
SLS 21 FVM 5× 1.75 7 0.8 12 0.8 12.32±0.63
. . . .
OCT 6.8 6.8 0.8 12 0.8 14.67±0.98
. . . .
SLS 31 FVM 5× 1.75 7 0.4 12 0.4 11.56±1.32
. . . .
OCT 6.8 6.8 0.4 12 0.4 10.77±1.67
7
rspa.r
oy
alsociet
ypublishing
.or
g
Proc
.R
.S
oc
.A
47
2
:2
[image:7.493.70.430.42.219.2]0160201
...
Alicona 5X OCT
Alicona 5X OCT
SLS 11 SLS 21
SLS sample measurement area SLS 31
18 17 16
15 14 13
Sa
(
m
m)
12 11 10
9 8 7
SLS 11 SLS 21
SLS sample measurement area SLS 31 18
17 16
15 14 13
Ra
(
m
m)
12 11 10
9 8 7
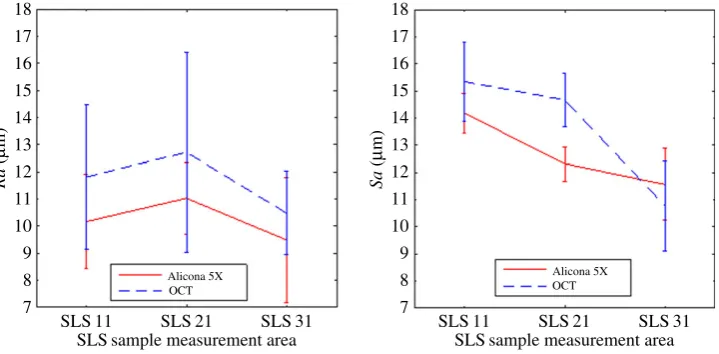
Figure 6.Plot of the calculatedRa andSa from FVM and OCT. The bar indicates the calculated statistical standard deviation (σ). (Online version in colour.)
remove high spatial frequency noise, and to avoid any effects due to the finite sampling distance and optical resolution. Finally, high-pass filtering is applied to the data to ensure matching spatial bandwidths for the two instruments. Owing to the limited evaluation length, only one sampling length was used in the profile analysis (not the default five stipulated in ISO 4287 [20]).Table 2 summarizes the measurement results along with their processing parameters. For each profile and areal texture, five measurements at different positions on the surface were carried out. The mean values and standard deviations were calculated and are displayed intable 2. Plots of the texture results along with their standard deviations are presented infigure 6. From these results, it can be concluded that OCT and FVM can achieve comparable results when measuring the profile and areal texture within the variation across the surface.
(b) Sub-surface powder density measurement
(i) Measurements based on intensity density analysis
The specimens produced were first non-destructively evaluated by OCT and then sectioned for characterization by scanning electron microscopy (SEM). The specimens were designed to have a smooth surface texture and a solid top layer of approximately 100µm, as described in §2b. However, some surface deformation (bellying) was observed, as shown infigure 7, and the depth of solid varied for each processing area. This is typical for current additive layer methods, where fine feature deformation upon cooling is observed. Furthermore, owing to standard processing parameters used for the top surface, the melting laser power will consolidate more than the currently added material of the layer. In solid, this would be considered re-melting. Precise control of the laser power to only melt a single layer is not given by the commercial manufacturing process.Figure 7a–cshows the OCT cross-sectional structural images at the central sections of SLS 11, SLS 21 and SLS 31, respectively, which are marked by 1, 2 and 3 as infigure 3.Figure 7ashows the controlled area, which was not subject to laser melting, with a solid top layer of approximately 244µm;Figure 7bshows an area treated with 6 W laser power with a top layer of approximately 316µm; andFigure 7cis the area containing both treatments with an uneven depth of the top layers in one frame. The suspected region of un-melted/insufficiently sintered area, which is filled with loose powder, is indicated by the dashed line.
8
rspa.r
oy
alsociet
ypublishing
.or
g
Proc
.R
.S
oc
.A
47
2
:2
[image:8.493.66.428.40.251.2] [image:8.493.66.429.308.560.2]0160201
...
244 mm
0W 6W
316 mm
500 mm
(b)
(a)
(c)
Figure 7.OCT cross-sectional structural images of areas with different loose powder density caused by shifting laser energy: (a) area with no laser melting, (b) area with 6 W, (c) no laser interaction and 6 W side-by-side. (Online version in colour.)
3 W 0 W
4 W
1 W 2 W
5 W
6 W 7 W 8 W
9 W 10 W 11 W
1 mm
(b)
(a) (c)
(h)
(g) (i)
(k)
(j) (l)
(d) (e) (f)
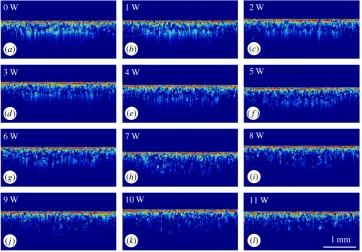
Figure 8.Panels (a–l) are the normalized OCT cross-sectional structural images of areas ramping up from no laser interaction to 11 W. (Online version in colour.)
9
rspa.r
oy
alsociet
ypublishing
.or
g
Proc
.R
.S
oc
.A
47
2
:2
[image:9.493.64.432.44.191.2]0160201
...
3.0
2.5
2.0
1.5
density (×10
4 pixels)
laser power (W) 1.0
0.5
0
0.45
0.40
0.35
0.30
loose powder ratio
0.25
0.20
0.15
0.10
–2 0 2 4 6 8 10 12
laser power (W)
0 2 4 6 8 10 12
(b)
(a)
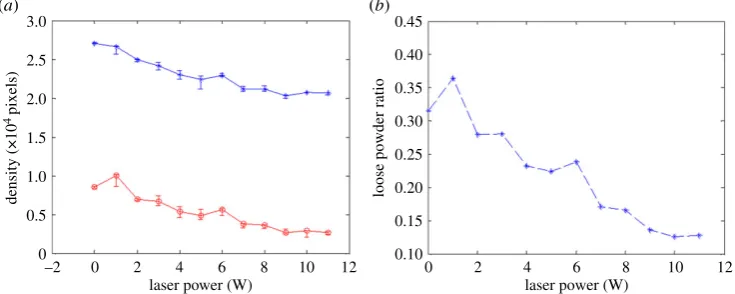
Figure 9.Relationship between (a) laser energy and (b) loose powder density; standard deviation was calculated from five datasets. (Online version in colour.)
density. It can be observed fromfigure 8a–lthat the apparent sub-surface loose powder density is reduced gradually when the laser energy is increased. This is to be expected as the degree of sintering is significantly affected by the power delivered to the powder bed. Quantitative analysis of the density change is shown in figure 9. The blue curve in figure 9a shows the total pixel number, as the density of the whole sample, from each structural image infigure 8and the red curve shows the pixel numbers of loose powder areas, as the density of loose powder. It can be observed fromfigure 9athat both loose powder density and whole sample density reduced gradually as the laser power was increased. The relationship between the laser power and the averaged density ratio of the loose powder and the whole sample density is shown infigure 9b. This method can easily distinguish the sample density change when the laser power increases to 9 W; however, the density or density ratio change is difficult to detect once the power is greater than 9 W. The OCT signal pixel numbers reduced when the laser power was increased, which is due to the increase in the sufficiently sintered area, less backscattering and hence reduced light penetration depth.
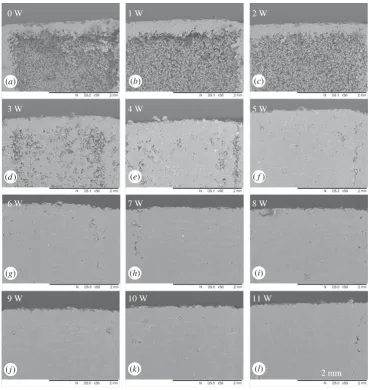
Figure 10shows SEM images of the areas corresponding to laser powers from 0 W to 11 W. Loose powder is liberated infigure 10aafter cutting, because there was insufficient incident power to cause even mild sintering. Significant density and melt status changes can be observed from 0 W to 5 W, which are shown infigure 10a–f, respectively. However, it is difficult to distinguish a difference when the incident laser power exceeded 6 W, which indicates that OCT may be a better analysis tool for post-build investigations than cross sectioning. It is probably in the preparation of sections that some porosity is obscured by smearing of the polished surface. This is a common problem that occurs in specimen preparation of AM cross-sections.
(ii) Measurements based on intensity attenuation analysis
It can be observed from figures 7and 8that the intensity attenuation coefficient throughout the depth for the solid and loose powder areas varies significantly as a result of the variation in processing parameters. This is due to more specular reflection from the melted area when compared with the diffuse reflection from the loose powder area. This difference in reflection type and the detection of loose powder with open surfaces have been reported elsewhere [2]. In this study, the focus was on sub-surface loose powder detection and image reconstruction for automatic defect detection by OCT.
10
rspa.r
oy
alsociet
ypublishing
.or
g
Proc
.R
.S
oc
.A
47
2
:2
[image:10.493.62.431.39.430.2]0160201
...
0 W 1 W
3 W 4 W
6 W 7 W
9 W 10 W
2 W
5 W
8 W
11 W
2 mm
(b)
(a) (c)
(h)
(g) (i)
(k)
(j) (l)
(d) (e) (f)
Figure 10.Panels (a–l) are SEM images of areas corresponding to laser power from no laser interaction to 11 W.
of 6.8µm. A mean of 10 adjacent A-lines from each section has been calculated in order to enhance the signal-to-noise ratio.
11
rspa.r
oy
alsociet
ypublishing
.or
g
Proc
.R
.S
oc
.A
47
2
:2
0160201
...
1.0 0.9 0.8 0.7 0.6 0.5
intensity (arb.
units)
0.4 0.3 0.2 0.1 0
1.0 0.9 0.8 0.7 0.6 0.5
intensity (arb.
units)
0.4 0.3 0.2 0.1
depth (mm) 0
0 0.5 1.0 1.5 2.0 2.5 3.0
0 0.5 1.0 1.5 2.0 2.5 3.0
(a)
(b)
intensity versus depth fit 3
fit 4
intensity versus depth fit 1
fit 2
Figure 11.Panels (a) and (b) are the averaged intensity change throughout the depth from the 0 W and 6 W areas, respectively. The attenuation coefficients for fit 1 to fit 4 are−8.821,−4.565,−12.4 and−6.027, respectively. (Online version in colour.)
An algorithm for automatically detecting sub-surface loose powder area was also developed based on the intensity attenuation coefficient. This method is similar to previous studies of optical coherence elastography [14,21]. Results fromfigure 11state that the absolute attenuation coefficient value at full melt area is higher than that at the un-melted/insufficiently sintered area, however this value is not sufficient for comparison between different B frames (sample areas).
12
rspa.r
oy
alsociet
ypublishing
.or
g
Proc
.R
.S
oc
.A
47
2
:2
[image:12.493.58.437.43.241.2]0160201
...
140
0 20 40 60 80 100 120
140
0 20 40 60 80 100 120
140
0 20 40 60 80 100 120
0 W area 6 W area 500 mm
(b)
(a)
(c)
(h)
(g)
(i)
(d)
(e)
(f)
Figure 12.Panels (a–c) are the structural images of the sample area treated with 0 W, 6 W and both energy values in one B frame, respectively. Panels (d–f) are the calculated loose powder mappings for the three samples and the colour bars are shown in arb. units; panels (g–i) are overlaid images. (Online version in colour.)
4. Discussion
Surface texture measurements were carried out by means of OCT and FVM, as described in §3a, and comparable results were obtained. The advantage of OCT is that it can evaluate the sub-surface structure alongside evaluating the upper sub-surface similar to other non-contact (optical) instruments. For FVM, as the objective lens used is 5×, which has a low NA, it is difficult to measure a much higher slope surface. To increase the level of confidence in the surface texture measurement results obtained by FVM, they have been compared with the results obtained by a stylus (tactile) instrument (reference instrument).
In §3b, two methods were used to detect sub-surface loose powder areas. First, the OCT signal intensity density was used to evaluate the specimen density. Once PA2200 particles are fully melted and sintered together, the specular reflection increases while the backscattering decreases, which reduces the OCT signal points and penetration depth. Using the pixel numbers with a positive intensity value as a sample density, a linear relationship can be observed between the laser power and the loose powder density. The sensitivity of this method is limited above an incident laser power of over 9 W. However, the performance of this method is still superior to SEM evaluations of cross-sections. The other method makes use of intensity attenuation-level analysis. Previous work has proven that the OCT intensity attenuation coefficient is distinct for the solid and exposed loose powder area and the ratio of the coefficient is quite constant [2]. In this study, a similar phenomenon is found for sub-surface loose powder areas. The reconstruction algorithm is developed for automatic detection of loose powder defects. The algorithm is based on exponential fitting of a selected window of pixel numbers, which limited the resolution of the functional image.
13
rspa.r
oy
alsociet
ypublishing
.or
g
Proc
.R
.S
oc
.A
47
2
:2
0160201
...
offering a 5.4 times faster scan rate than the current system. In addition, selective sampling could be undertaken to reduce the scanning area in order to match the ‘write’ speed of the SLS system. The rapid development of optical sensor and computing technology makes real-time monitoring and control through dynamic feedback a distinct prospect. One solution is to combine OCT with other detectors, such as a high-speed camera to perform the rough scan. Once the area of interest is located, the OCT can apply a higher resolution scan and provide detailed evaluation of the sub-surface.
One of the most attractive attributes of OCT is its ability to provide depth-resolved cross-sectional images. This means that it has the capability of providing layer-by-layer information for use in defects analysis. Should penetration depths also be increased this will serve to further reduce the time penalty for using OCT instrumentation in SLS systems.
5. Conclusion
This study has demonstrated the feasibility of using OCT for surface texture measurement and sub-surface loose powder detection of polymeric parts manufactured using SLS. Experiments reported here indicate that:
— the results of the surface texture measurement, after the bandwidth matching procedure, show that the surface texture measurement results obtained by OCT are comparable with those obtained by FVM;
— from the results of surface and sub-surface loose powder detection, OCT shows a promising capability to distinguish loose powder defects in a solid specimen. Also, this is the first time that an automatic loose powder defects detection algorithm has been developed based on OCT technology; and
— this technique presents itself well as a potential method forin situanalysis of SLS parts for ensuring part integrity and verifying process stability.
Data accessibility. All data are contained within the paper.
Authors’ contributions. G.G. and M.H. carried out the SLS sample design and manufacture work. G.G. and Z.H.
carried out the OCT scanning and participated in data analysis, carried out sequence alignments, participated in the design of the study and drafted the manuscript; W.P.S. and R.K.L. carried out the FVM data collection and analysis; A.T.C. coordinated the study and helped draft the manuscript. All authors gave final approval for publication.
Competing interests. We have no competing interests.
Funding. The authors acknowledge the grants gratefully received from the UK Engineering and Physical
Sciences Research Council (EPSRC), references EP/L017016/1 and EP/L01713X/1.
Acknowledgements. The authors acknowledge Joseph White and Mark East from the Additive Manufacturing
and 3D Printing Research Group at the University of Nottingham.
References
1. Bi G, Sun C, Gasser A. 2013 Study on influential factors for process monitoring and control in laser aided additive manufacturing. J. Mater. Process Tech. 213, 463–468. (doi:10.1016/j.jmatprotec.2012.10.006)
2. Guan GY, Hirsch M, Lu ZH, Childs DTD, Matcher SJ, Goodridge R, Groom KM, Clare AT. 2015 Evaluation of selective laser sintering processes by optical coherence tomography.Mater. Des.88, 837–846. (doi:10.1016/j.matdes.2015.09.084)
3. Berumen S, Bechmann F, Lindner S, Kruth JP, Craeghs T. 2010 Quality control of laser-and powder bed-based additive manufacturing (AM) technologies.Phys. Proc.5, 617–622. (doi:10.1016/j.phpro.2010.08.089)
14
rspa.r
oy
alsociet
ypublishing
.or
g
Proc
.R
.S
oc
.A
47
2
:2
0160201
...
5. Chivel Y, Smurov I. 2010 On-line temperature monitoring in selective laser sintering/melting. Phys. Proc.5, 515–521. (doi:10.1016/j.phpro.2010.08.079)
6. Everton SK, Hirsch M, Stravroulakis P, Leach RK. 2016 Review of in-situ process monitoring and in-situ metrology for metal additive manufacturing.Mater. Des.95, 431–445. (doi:10.1016/j.matdes.2016.01.099)
7. Wang RK, An L, Francis P, Wilson DJ. 2010 Depth-resolved imaging of capillary networks in retina and choroid using ultrahigh sensitive optical microangiography.Opt. Lett.35, 1467– 1469. (doi:10.1364/OL.35.001467)
8. Grieve K, Dubois A, Simonutti M, Paques M, Sahel J, Le Gargasson JF, Boccara C. 2005 In vivo anterior segment imaging in the rat eye with high speed white light full-field optical coherence tomography.Opt. Express13, 6286–6295. (doi:10.1364/OPEX.13.006286)
9. Li C et al. 2015 Detection and characterisation of biopsy tissue using quantitative optical coherence elastography (OCE) in men with suspected prostate cancer. Cancer Lett. 357, 121–128. (doi:10.1016/j.canlet.2014.11.021)
10. Yonetsu T, Bouma BE, Kato K, Fujimoto JG, Jang I-K. 2012 Optical coherence tomography—15 years in cardiology.Circ. J.77, 1933–1940. (doi:10.1253/circj.CJ-13-0643.1)
11. Makishi P, Shimada Y, Sadr A, Tagami J, Sumi Y. 2011 Non-destructive 3D imaging of composite restorations using optical coherence tomography: marginal adaptation of self-etch adhesives.J. Dent.39, 316–325. (doi:10.1016/j.jdent.2011.01.011)
12. Braz AK, Kyotoku BB, Braz R, Gomes AS. 2009 Evaluation of crack propagation in dental composites by optical coherence tomography. Dent. Mater.25, 74–79. (doi:10.1016/ j.dental.2008.04.011)
13. Dunkers JP, Parnas RS, Zimba CG, Peterson RC, Flynn KM, Fujimoto JG, Bouma BE. 1999 Optical coherence tomography of glass reinforced polymer composites.Composites Part A: Appl. Sci. Manufacturing30, 139–145. (doi:10.1016/S1359-835X(98)00084-0)
14. Guan GY, Li CH, Ling YT, Yang Y, Vorstius JB, Keatch RP, Wang RKK, Huang ZH. 2013 Quantitative evaluation of degenerated tendon model using combined optical coherence elastography and acoustic radiation force method. J. Biomed. Opt. 18, 111417. (doi:10.1117/1.Jbo.18.11.111417)
15. Leach R. 2011Optical measurement of surface topography. Berlin, Germany: Springer.
16. Saxton W. 1994 What is the focus variation method? Is it new? Is it direct?Ultramicroscopy55, 171–181. (doi:10.1016/0304-3991(94)90168-6)
17. Danzl R, Helmli F, Scherer S. 2011 Focus variation—a robust technology for high resolution optical 3D surface metrology.J. Mech. Eng.57, 245–256. (doi:10.5545/sv-jme.2010.175) 18. Leach R, Haitjema H. 2010 Bandwidth characteristics and comparisons of surface texture
measuring instruments.Meas. Sci. Technol.21, 032001. (doi:10.1088/0957-0233/21/3/032001) 19. Leach R. 2014 Fundamental principles of engineering nanometrology. Amsterdam, The
Netherlands: Elsevier.
20. British Standards Institution. 1997 ISO 4287. Geometric product specifications (GPS). Surface texture: profile method. Terms, definitions and surface texture parameters. London, UK: British Standards Institution.
21. Guan GY, Reif R, Huang ZH, Wang RKK. 2011 Depth profiling of photothermal compound concentrations using phase sensitive optical coherence tomography.J. Biomed. Opt.16, 126003. (doi:10.1117/1.3659211)