Abstract--Active islanding detection methods are generally employed for grid-connected inverter-based Distributed Generation (DG). However, there might be mutual influences and power quality issues caused by the disturbance signal when multiple inverters are involved. To address those problems, this paper analyzes the potential failure mechanism of the f-Q (frequency-reactive power) drifting active method in multiple-DG situations. Then, a novel high frequency transient injection based islanding detection method that is suitable for both single and multiple-DGs is proposed. Compared with the conventional injection methods, a high frequency impedance model for DG is provided for better theoretical analysis. By means of the intermittent Time Domain Low Voltage Condition (TDLVC) injection control, this method can achieve good accuracy and reduce disturbances to power system.
Index Terms--Islanding detection, active injection method, high frequency impedance estimation, multi-inverter-based DG.
I. INTRODUCTION
HE demand of efficient energy utilization and the development of power electronic technology are urging large amount of distributed generation (DG), such as photovoltaic (PV) and wind power, to connect to the grid [1]-[2]. However, an unintentional islanding operation can be formed by the DGs and local loads when grid faults or circuit breaker misoperation occurs [3]-[4]. The islanding system causes potential threats to field operators, the system equipment, line restoration and the circuit breaker reclosing operations. Therefore, it is important to detect the system islanding operating situations effectively [5].
Islanding detection methods can be classified into two categories: the communication-based methods [6]-[9] and the local measurement-based methods that are further divided into the active methods and the passive methods. The communication- based method involves remote-end measurement [6]-[7] and wide-area phasor estimation [8]-[9] that relies on real time data transmission. This could increase the system investment and might cause relay mal-function due to communication failures. The passive methods analyze the change of/rate of change of (ROCO) electrical quantities at the relay location, caused by mismatching of the DG output and local loads [10]-[20]. The basic theory of the passive method is straightforward and easy for practical utilization. Lately,
This work was supported in part by the National program on key basic
research project (973 Program, No. 2012CB215206), by the NSFC project under Grant 51407067, the “111” Project under Grant B08013 and FRFCU 2016ZZD01.
researches on this method mainly focus on the smart signal processing algorithms. The estimation of signal parameters via rotational invariance techniques (ESPRIT)[11], fast Gauss-Newton algorithm (FGNWA)[12], Tufts–Kumaresan (TK)[15], autoregressive (AR)[16] and wavelet[17] are used to pick out the useful signal from noises and distortions. And then, the pattern recognition algorithms such as Decision Trees (DTs)[10], Naive-Bayes classifiers (NBC)[14], support vector machine (SVM)[13] and classification and regression trees (CART)[18] are used for islanding detection. Applying smart data processing to multiple measured variables, the non-detection zone (NDZ) can be reduced. However, the theoretical NDZ might still exist when the DG output power matches with the local loads and the complicated data processing could make the passive method less favorable for industry application.
At present, active methods are mainly adopted by the inverter-based DGs. These methods modify the inverter control loops (include the phase-lock loop) or the control reference values to induce small power [19]-[22], voltage amplitude [23]-[24], phase [25] and frequency [26]-[30] errors to the inverter outputs. When islanding occurs, these errors will be enlarged for accurate detection. However, for multi-inverter-based DGs, it is possible that disturbance signals produced by this active method could be amplified (jeopardizing the power quality and the system stability) or could counteract each other (causing failure of islanding detection). For multi-inverter situation, in order to avoid the mutual influences, the master-slave injector is classified [31]. The master inverter continuously [32]-[33] or intermittently [34]-[35] injects a high frequency current harmonic (normally in the range from 300Hz to 700Hz) through the “q” or “d” current control loops. The islanding can be detected by measuring the system impedance variations (or voltage response). Applying this injection method for multi-DG system, the common drawbacks are: 1) the measured impedance (or voltage response) cannot be theoretically explained due to the fact that the harmonics will not only flow to the main system but also to the other inverters and the inverter models in high frequency domain are not provided; 2) the master inverter has to inject a relative large distortion to maintain an accurate measurement (especially in the high frequency range) and this might cause system power quality problems.
According the two drawbacks of the current injection methods, this paper proposes a centralized high frequency
Ke Jia, Hongsheng Wei, Tianshu Bi, David Thomas and Mark Sumner
An Islanding Detection Method for Multi-DG
Systems Based on High Frequency Impedance
Estimation
transient injection method for multi-DG systems to avoid the mutual influences of the inverters. The failure mechanism of the conventional active method is analyzed. The dynamic high frequency impedance model for inverter-based DG is proposed. This model is irrelevant to the control algorithm and source characteristics and is suitable for all the inverter-based DGs. By means of intermittent Time Domain Low Voltage Condition (TDLVC) injection, good estimation accuracy and the system power quality can be achieved for correct islanding detection.
II. FAILURE MECHANISM OF CONVENTIONAL ACTIVE METHOD
BASED ON INVERTER DISTURBANCE
A. Frequency-reactive power Drift Method
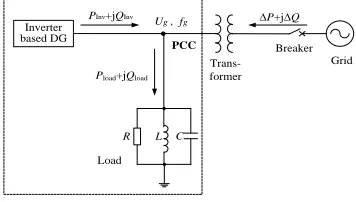
The frequency-reactive power (f-Q) feedback drifting method is one of the conventional inverter-based active islanding detection. It is based on the relationship between frequency of the DG’s output voltage and the reactive power. The frequency drift is accelerated by an f-Q feedback control strategy after the islanding occurs. This will enlarge the frequency differences even if the local loads’ consuming power matches with the DGs’ output power [22]. A typical grid connected inverter-based DG system with local paralleled loads is simplified and shown in the Fig.1. According to the amplitude and frequency variations of inverter’s output voltage, the islanding situation can be detected. The inverter, as shown in the Fig.1, is controlled for maximum real power output while the reactive power is set to be zero for normal operation.
Inverter based DG
Grid Breaker
Trans-former
PInv+jQInv
Pload+jQload
∆P+j∆Q
R L C
PCC
Load
[image:2.612.83.261.413.514.2]Ug , fg
Fig. 1. The equivalent circuit of a grid-connected inverter system.
For the grid-connected situation, there will be: 2
3 g
load inv
U
P P P
R
(1)
2 1
3 2
2
load g g inv
g
Q U f C Q Q
f L
(2)
Whereby, Pload and Qload are the active and reactive power
consumed by loads in normal operation; Pinv and Qinv are the
inverter’s active and reactive power outputs; ΔP and ΔQ are the active and reactive power supplied by the grid; Ug and fg
are the amplitude and frequency of the inverter’s output voltage.
In islanding situation, Uisland and fisland denote the amplitude
and frequency of the terminal voltage of the local loads, P’load
and Q’load are the active and reactive power consumed by the
local loads. When the inverter operates on constant power control mode, there will be:
2
' 3 island
load inv
U
P P
R
(3)
' 3 2 1 2
2
load island island inv
island
Q U f C Q
f L
(4)
The terminal voltage of the local loads in islanding operation can be calculated by (5):
3
inv island
P R
U (5) When the inverter works in unity power factor mode, which means Qinv=0, the inverter won’t supply reactive power to the
loads after islanding. Thus, the frequency of the terminal voltage can be represented by (6):
1 2 island f
LC
(6)
Therefore, the relationship between ∆Q (the mismatching reactive power) and fisland , can be expressed as:
2
g island g
f
inv island g island
U f f
Q
Q
P U f f
(7)
where f
C Q R
L
is the quality factor of the load
As shown in (7), the reactive power difference between inverter’s output and the local load will result in frequency variation during islanding.
Therefore, the grid-connected inverter system’s islanding operation can be detected by the enlarged frequency drifting which is caused by reactive power disturbance. In order to obtain sufficient reactive power disturbances from a small change in the frequency and improve the detection speed, a frequency feedback is employed in the reactive power control loop. The feedback is set as (8) and the control block diagram is shown in Fig.2.
inv a g
Q k f f (8) Where k is the frequency feedback coefficient, fa is the
frequency of the voltage at the point of common coupling (PCC), fg is the rated frequency of the main grid (50Hz).
Over/ under frequency threshold?
Pulse blocking of
islanding protec tion Yes fa
+
-fg k
block-ing signal PWM
ωL
ωL
PI
PI abc/ dq
divide divide
abc/ dq
PLL
θ
Udpcc Uqpcc
iq id
-+ i*q
i*d +
- Udpcc
P*
Uqpcc Q*
Uqpcc
Udpcc
+
++
-Uq
Ud
θ
abc dq
S1˜S6
Uga
Ugb Ugc
Udc
L RL
[image:2.612.316.562.601.716.2]Load
As shown in the Fig.2, both the active and reactive power of the inverter’s output are constant due to the constant P-Q control. Voltage at PCC of the DG system, clamped by the main grid, is the rated voltage and the corresponding values
Udpcc, Uqpcc in d-q coordinate system. Accordingly, reference
current i*
q and i*d can be calculated from the outer power
control loops. The current state feedback values, ωLid and ωLiq, are introduced to achieve decoupling. The inner current
loop outputs the reference voltages Ud and Uq which generate
Pulse-Width Modulation (PWM) signals after the dp/abc conversion.
The frequency at the PCC changes very little after islanding if local loads matches with the power output of the inverter. However, by introducing the feedback loop, the reactive power offset will be magnified and this would make the frequency rise/fall out of the allowable range for accurate islanding detection.
B. Failure Mechanism of f-Q Feedback Method
To study on the performances of the f-Q feedback method in the islanding detection, the simulation model is built in Matlab/Simulink according to the system structure introduced in the Fig.1 and control strategy presented in the Fig.2. Detailed simulation parameters are: the inverter’s output is stepped up via transformers to a 220kV system of infinite capacity. The active power output of the inverter is 300kW and the reactive power output is determined by the frequency difference, that is Qinv=k(fa−50) Var, where the feedback factor
is k=-3802. The RLC parallel load is connected to the 10.5kV bus and the load consumed active and reactive power are
Pload=300kW, Qload.L=150kVar and Qload.C=−152kVar
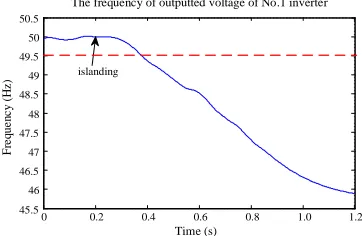
respectively. This power is set to create a match between the DG output and the load. This paper is trying to describe the advances of the proposed method compared with the conventional active method and for the power mismatching situations even the passive methods work fine. All the islanding simulations investigated in this paper are in the “power matching” condition. Islanding is set at 0.2s and the simulation duration is 1.2s. Without the f-Q feedback method, the frequency will remain about 50Hz after islanding because of the high-degree matching between the inverter output and the power consumed by the load.
Applied with the three-phase f-Q feedback method, the results are shown the in Fig.3 with the same simulation conditions.
0 0.2 0.4 0.6 0.8 1.0 1.2
45.5 46 46.5 47 47.5 48 48.5 49 49.5 50 50.5
Time (s)
F
re
q
ue
n
c
y
(
Hz
)
The frequency of outputted voltage of No.1 inverter
[image:3.612.310.531.339.613.2]islanding
Fig. 3.Frequency measured at the outlet of the inverter with f-Q control
It Fig.3, due to the f-Q feedback algorithm, the reactive power increases and the frequency drops after islanding. Therefore, the change of the system operating state can be detected within 200ms (the threshold is set to be 49.5Hz[36]). However, in multi-DG systems, reactive power disturbances produced by different inverters may interfere or counteract each other. This could make it hard to form the continuous f-Q feedback to accelerate the frequency drift and the islanding detection might fail.
In view of the analysis above, the simulation of three paralleled inverters connected to a 220kV bus via step-up transformers is carried out. The active power output of each inverter is 100kW. The reactive power output is determined by the frequency difference, that is Qinv=ki(fa−50) Var. In
practice, considering the relay sensitivity and the system power quality, the feedback factor varies for different manufactures. To demonstrate that variable feedback factors can result in a dead zone of the conventional active islanding detection method, factors of the three inverters are set as: for the inverter “1”, “2” and “3” are k1,2=-3802, and k3=2*3802 respectively. The simulation conditions and parameters are the same with each of the single-inverter as shown in Fig.3 above. The simulation results of multi-DG system are shown in the Fig.4.
0 0.2 0.4 0.6 0.8 1.0 1.2 45.5
46 46.5 47 47.5 48 48.5 49 49.5 50 50.5
Time (s)
F
re
que
nc
y
(Hz
)
The frequency of outputted voltage of No.1 inverter
islanding
a) The frequency of voltage at the outlet of No.1 inverter
0 0.2 0.4 0.6 0.8 1.0 1.2 -2
-1.5 -1 -0.5 0 0.5 1 1.5
2 x 10 4
Time (s)
Re
a
ct
ive
pow
er
(V
ar
)
The outputted reactive power of No.1 inverter
islanding
b) The output reactive power of No.1 inverter
Fig. 4. The frequency and reactive power curves in multi-inverter system derived using the f-Q feedback method.
[image:3.612.81.262.604.722.2]active islanding detection method based on inverter disturbance will not work.
III. ISLANDING DETECTION FOR MULTI-DGSYSTEM A. Rationale of Impedance Estimation Method
The external injection based method can be used for all the DGs (directly grid connected and the inverter grid interfaced) [31]. Equivalent schematic of impedance estimation method using external centralized disturbances is shown in the Fig.5. It applies independent centralized injection at the PCC, other than conventional inverter-based injections.
Disturbance injection
Breaker PCC
ZDG
Zload
ZGrid
Zislanding
[image:4.612.82.267.198.293.2]Coupli ng ind uctor
Fig. 5. Schematic of equivalent system impedance under external centralized disturbances.
The measured impedance characteristics at the injection point and the basic principle of islanding detection are summarized as follows:
Usually, the equivalent impedance of grid is much smaller than that of DG and load in a grid-connected distributed generation system because of their capacity differences.
Grid DG
Z Z ,
Grid load
Z Z (9)
DG load
Ιslanding Grid
DG load
Z Z
Z Z
Z Z
(10)
where ZGrid, ZDG and Zload are the equivalent grid impedance,
DG impedance and the load impedance in the high frequency.
Zislanding is the measured islanding impedance in the high
frequency. Before islanding, the measured impedance Zmeas at
PCC is:
Grid Ιslanding
meas Grid
Grid Ιslanding
Z Z
Z Z
Z Z
(11)
After islanding, the measured impedance Z’meas at PCC is:
Z
meas
Z
Ιslanding
Z
Grid
Z
meas(12)
Equations (11)-(12) indicate that the measured impedance shows DG impedance, load impedance and the grid impedance in parallel during normally operation and this value after islanding (load impedance and the DG impedance in parallel) will be larger than normal operation. This can be utilized for islanding detection. Due to the fact that only one disturbance is employed, the mutual interferences of multiple inverters can be avoided.
B. Impedance Model of Grid-connected Inverter under External Disturbance Signals
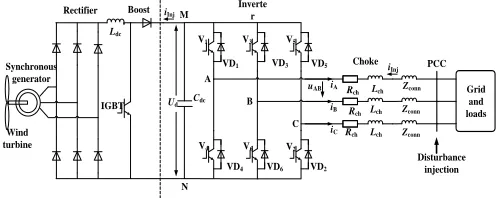
The inverter-based DGs normally have a DC boost circuit and a three-phase Insulated Gate Bipolar Transistor (IGBT) bridge. The Permanent Magnetic Synchronous Generator (PMSG) is one of the typical inverter-based DGs. Using PMSG as a representation, this paper investigates the high frequency impedance model of inverter-based DGs under external disturbances.
Fig.6 shows the configuration of a GE PMSG connected to grid via an inverter. The three-phase AC voltage generated by the synchronous generator is firstly converted into DC voltage (at Cdc) through an uncontrolled rectifier and a boost circuit, and then into three-phase AC voltage in the PWM form through a 3-phase fully controlled inverter [27]-[37].
Cdc A
B
C
iA
iB
iC
Rch Inverte
r
Choke i
Inj V5
VD5 V3
VD3 V1
VD1
V4
VD4 V6
VD6 V2
VD2
uAB
Ldc
Synchronous generator
Wind turbine
Boost M
N
Ud Rectifier
Grid and loads
Zconn
Zconn
Zconn PCC
Disturbance injection IGBT
iInj
Rch
Rch
Lch
Lch
Lch
Fig. 6. Model of PMSG connected to grid through an inverter.
The external disturbance-generating device injects transient disturbance signal into the system from the PCC. The signal flows through all branches of the system as: the main grid, loads and PMSGs. For the PMSG, the disturbance signal goes through the Choke filter and the inverter into the inner part of the PMSG (left side of the dashed line). The uAB is the voltage between phase A and phase B of the inverter output. iA and iB are the currents of phase A, B respectively, whose positive directions are set to be going out of the inverter. The iInj is the disturbance signal deriving from the PCC. Its positive direction is set to be entering the inverter as the dashed arrow shown in Fig.6.
Within the interested frequency range (several kHz), it is assumed that the injected current signal is small (compared with the large inherent system current) and superimposes upon the inherent current without influencing the actual direction of the inherent current. The power electronic devices are regarded as ideal device whose on-state is viewed as short circuit and off-state as open circuit in the kHz range. According to the PWM modulation, the inverter output voltage (uAB) is a tri-level PWM wave equivalent to the sine-modulating wave. The inverter’s output currents (iA, iB) are approximately sine waves (include a certain amount of harmonics) with a 120° phase difference.
[image:4.612.315.565.240.339.2]is negative, the bridge arm 4 is on. Then based on iA, the on-off state of detailed elements in bridge arm can be further concluded. When iA is positive, V1 (the IGBT) or VD4 (the diode) will be on; and when iA is positive, V4 or VD1 will be on.
According to the single phase analysis above, combination of on/off states of all bridge elements of phase A and B can be concluded: the high voltage level of uAB (+Ud) corresponds to the on-state of bridge arm 1,6 and the V1,V6 are controlled at its on-state at this time. Furthermore, utilizing the combination of iA and iB’s directions, it can be worked out whether the
current go through the IGBT or its freewheeling diode. Similarly, the low voltage level of uAB (-Ud) corresponds to the on-state of bridge arm 3,4 and the zero voltage level of uAB (0) means the on-state of bridge arm 1,3 or 4,6.
Based on all the analyses above, the on-off states of all bridge arms and their elements in the whole inverter can be concluded from the PWM voltage and current output waveforms. There are totally 16 kinds of paths through which the disturbance signals enter into the inverter in terms of the injection mode referred above (not all 16 paths exist within a cycle, depending on the relative phase relation of iA, iB and
uAB). In the light of the combination of iA, iB’s
positive/negative directions within a cycle, the paths of the injection transient can be classified into four groups:iA positive and iB negative,iA positive and iB positive,iA negative and iB positive,iA negative and iB negative. Each group contains four signal paths. The Fig.7 shows the four signal paths of group 1 (when iA is positive and iB negative). The other twelve signal paths can be analyzed in the similar way. The rest of the 12 paths are provided in the Appendix.
+ C
A
B
C M
N
Ud
iC
R L
R L
R L
Disturbance current
signal
Inverter
Choke Impedance
iInj V5
VD5
V3
VD3
V1
VD1
V4
VD4
V6
VD6
V2
VD2 iA
iB
:Signal channel 1
:Signal channel 2
:Signal channel 3
[image:5.612.315.556.138.393.2]:Signal channel 4
Fig. 7. Channel analysis of external disturbance (when iA is positive and iB
negative).
The four injection signal paths are shown in Fig.7 using dashed lines. The injected signal, superimposed upon the large inherent system current, may flow in accordance with the direction of system current or opposite to it, bringing no change to direction of inherent system current.
In terms of the external impedance characteristics, all paths can be summarized into two categories: a short circuit path and a path with the DC capacitor of PMSG as shown in Fig.8. The results of all 16 paths can come to the similar conclusion.
As shown in the Fig.8 b), part of the injected signal can flow further into the PMSG (the left part of the dashed line in
Fig.6) due to the capacitor impedance. When the IGBT of the boost circuit is on and the diode in the boost circuit is off, the signal will flow directly through the capacitor Cdc and then out of the inverter. When the IGBT of the boost circuit is off and the diode will be on, a small portion of the injected signal will go through the diode rectifier to the synchronous generator as shown in Fig.9.
+
C
A
B
C M
N
iA
iB
iC
R L
R L
R L
1 3 5
4 6 2
Inverter
Choke Impedance
iInj
Disturbance current
signal
Ud
a) Paths that creates a short circuit.
+
C
A
B
C M
N
iA
iB
iC
R L
R L
R L
1 3 5
4 6 2
Inverter
Choke Impedance
iInj
Disturbance current
signal
Ud
b) Paths with DC capacitor in the loop.
Fig. 8. Two categories paths of the injection signal.
Cdc
Ldc
in high frequency
XL> >XC Cdc
LSG
LSG
[image:5.612.321.556.418.517.2]Resultant current
Fig. 9. Equivalent impedance when the IGBT of Boost circuit is off.
The arrows in Fig.9 show the direction of the injecting signal and direction of the resultant current composed of disturbance current and the inherent DC charging current. LSG is the single-phase equivalent inductor of the synchronous generator; Cdc is the DC link capacitor; Ldc is the boost circuit inductor. In the interested high-frequency range (kHz), for a typical setting of the PSMG, the reactance of the capacitor can be 103~104 times smaller than the reactance of the inductors and can be ignored for practical utilization. In this case, the high frequency equivalent impedance circuit is shown in the right part of the Fig.9.
[image:5.612.49.302.440.570.2]alternately in a high frequency (the same frequency level with switching frequency).
However, under the interested high-frequency range, in the view of the considerable capacitance (Cdc), the capacitor reactance(XC=1/ωCdc) will be comparable to the short circuit.
The high frequency impedance model of the PMSG actually shows the short circuit impedance characteristics of an inverter plus the Choke filter impedance regardless the generator output variations and the control loop designs. This model can be suitable for PV and any other inverter-based DGs.
C. Injection Control and Wide-band High-frequency Reactance Calculation
The proposed transient current injection device is realized by utilizing the principle and structure of single-phase full-bridge inverter circuit as shown in the Fig.10.
In the Fig.10, a capacitor (charged by a rectifier)provides constant DC voltage to the single-phase full-bridge inverter. The inverter is connected to phase A and B of the system at PCC, via a considerable coupling inductor (L) whose inductance value is set according to the magnitude of injection current and a grid connection IGBT switch. By controlling of IGBTs, a square pulse voltage can be produced, forming a triangular current ‘spike’ through the coupling inductor L. Width and amplitude of the injection current spike is controlled to realize intermittent injections which can reduce the distortions to the healthy system.
C
VAIE
L iInj
uPCC uInj
[image:6.612.68.275.383.480.2]Grid-connection switch
Fig. 10. Schematic of independent disturbance generating device.
In terms of injection strategy, this paper proposes a Time Domain Low Voltage Condition (TDLVC) injection. It detects TDLVC of the voltage at PCC and injects a current spike (iInj) into the system at TDLVC and measures the PCC voltage uPCC in the meantime for impedance calculation. The uPCC consists of the inherent system voltage which is viewed as a noise component and the voltage response to the injected current. Because of a short injection duration (0.1ms) and a small data capturing window, the proposed method can provide good signal to noise ratio (SNR) due to the fact that little system noise and distortion waveforms are involved for impedance estimation. For practical applications, the injection takes place when the voltage is within a threshold that is close to zero. Within this threshold, the voltage is low and only small injection signal is required for correct measurement. The TDLVC detection algorithm is overridden during the injection. The amplitude of injection current can be modified by justifying UAIE and ∆t as shown in the equation (13). The
current pulse is injected into the system through a coupling inductor or an existing transformer.
AIE
1
L
i U dt
L
(13) In addition, the grid-connection IGBT is only switched on at the TDLVC where the injection takes place and then be off after the injection is finished. In this case, the VAIE just need to be higher than the maximum value of voltage limited within the short injection duration. This reduces the size of the DC capacitor and brings more benefit for practical utilization.
IV. SIMULATION RESULTS
The system model similar as shown in Fig.5 is built and tested in the simulation to verify the proposed method. The PMSG employed in the system is the typical type4 wind turbine detailed model provide by Matlab (with GE control algorithm) and contains a DC link (synchronous generator, diode rectifier and boost circuit) and a DC/AC IGBT based PWM converter [28],[37].
The PMSG capacity is 2MW and the RLC load capacity is 2MW as well (to make the PMSG power match with the load demand and this leads to failure of the passive method). Power source of the grid side is an ideal voltage source connected to an 110kV transmission line and then a 35kV distribution line. The π equivalent circuit model is used for all lines (parameters of the transmission and distribution lines are set referring to the actual power system). The capacity of the transformer on the grid side is 50MVA and the capacity of the transformer for wind turbine is 6MVA.
A. Simulation Analysis for Single-PMSG Condition
The Fig.11 shows the waveforms of the injected current and voltage measured at PCC using the intermittent TDLVC injection control. Peak value of the injected current is set to be 22.5A that is far smaller than inherent system operation current. It produces only a small and short disturbance to system voltage. The 22.5A peak is chosen to have an accurate impedance measurement when system noise is considered and add little extra distortions to the system.
0 2 4 6 8 10 12 14 16 18 20
-4 -2 0 2 4x 10
4 Waveform of voltage measured at PCC and injected current
Time (ms)
V
ol
ta
ge
m
ea
sur
ed
at
P
C
C
(V
)
0 2 4 6 8 10 12 14 16 18 20
-10 0 10 20 30
Time (ms)
Inj
ec
te
d
cur
re
nt
(A
)
Fig. 11. Waveform of current disturbance injected and voltage measured at PCC (the cycle in which disturbance is injected).
[image:6.612.344.524.543.657.2]islanding) are shown in the Fig.12. The dashed red line stands for system impedance result in theory and solid line in blue shows the estimated impedance using the model proposed in this paper. Compared with the resistance results, the estimated reactance results show good consistency and keep a small error with theoretical impedance, especially in the high-frequency range. Due to a relative less accurate small value for the resistance estimation, only the high frequency reactance value is used for the proposed islanding detection.
0 500 1000 1500 2000 2500 3000 3500 4000 4500 5000 0
10 20 30 40
Estimated impedance in frequency domain
R
(
Ω
)
Estimated value Theoretical value
0 500 1000 1500 2000 2500 3000 3500 4000 4500 5000 0
100 200 300
Frequency (Hz)
X
(
Ω
)
Estimated value Theoretical value
islanding state
steady state
islanding state
[image:7.612.72.276.165.296.2]steady state
Fig. 12. Impedance estimation result in frequency domain in steady state and islanding state.
According to the reactance curve in frequency domain after islanding, noted with arrow in the Fig.12, no matter in islanding state or steady state, the reactance estimation keeps a good accuracy. For islanding detection, the system reactance value at 4kHz is continuously monitored. This frequency is chosen to a) get good SNR, b) be within the bandwidth of standard instruments used for this type of operation, c) to restrict sample frequencies to those used by standard data acquisition equipment. The impedance characteristic in time domain is shown in Fig.13.
4
20 30 40 50
Resistance curve in time domain
Estimated value Theoretical value
0 1 2 3 5 6 7 8 9 10
R
(
Ω)
Time (s)
a) Change of resistance before and after islanding
150 200 250
0 1 2 3 4 5 6 7 8 9 10
X
(
Ω
)
Reactance curve in time domain
Estimated value Theoretical value
Time (s)
b) Change of reactance with random injection
140 160 180 200 220
0 1 2 3 4 5 6 7 8 9 10
X
(
Ω
)
Reactance curve in time domain
Time (s)
Estimated value Theoretical value
[image:7.612.68.279.446.712.2]c) Change of reactance with TDLVC injection
Fig. 13. On-line impedance characteristic quantity curve in time domain (the islanding occurs at 5s).
As shown in the Fig.13, islanding occurs at 5s. The measured resistance and reactance for each sampling window is plotted in the time domain. As expected, the measured resistance changes after islanding but with large calculation errors due to a poor frequency response in the high frequency domain. The Fig. 13 b) and c) demonstrates the reactance derived by random injection and the proposed TDLVC injection respectively, step change occurs within 0.2s and islanding status is detected quickly and effectively. Comparing with the results derived using random injection, the reactance estimation with TDLVC injection gives more accuracy due to less system noise is involved in each of the measuring windows. This would lead to improvement in the sensitivity of the islanding detection. The proposed injection method takes place at TDLVC (about every 10ms) and uses the average value of several injection results for islanding detection. This can avoid the influence of the system “mode transition transients”.
B. Simulation for Multi-PMSG Condition and Analysis of Signal Noise and Power Quality
The proposed algorithm is further verified in a multi-DG (three PMSGs) situation where the f-Q active islanding detective method does not work as presented in the Section II. The settings of the three DGs are the same as those introduced in the part B of the Section II. Fig.14 a) and b) show the estimated reactance result of the system with 3 PMSGs and 1 PMSG using different control strategies (different Kp and Ki parameters) and different rated output powers. Compared with the theoretical value, the estimated results are good enough for islanding detection.
110 120 130 140
X
(
Ω
)
0 1 2 3 4 5 6 7 8 9 10
Estimated value Theoretical value
Time (s)
Reactance curve in time domain reduced to 4kHz
a) Reactance of 3 PMSGs reduced to 4kHz
150 160 170 180 190 200 210
X
(
Ω
)
0 1 2 3 4 5 6 7 8 9 10
Time (s)
Reactance curve in time domain reduced to 4kHz
Estimated value Theoretical value
b) Reactance of 1 PMSG with 1% white noise reduced to 4kHz
Fig. 14. On-line impedance characteristic in time domain in the case of 3 PMSGs and 1 PMSG with 1% white noise.
[image:7.612.335.535.453.632.2]system noises, 1% white noise is added for the results derived in the Fig.14. Comparing results in the Fig.14 b) with the Fig.13 c) (using the same DG but without noise added), the estimated reactance under 1% white noise maintains a very small error. This is attributed to TDLVC injection and high frequency impedance estimation, by which the inherent system voltage components (including fundamental-frequency component, noises and harmonics) in voltage measured at PCC are reduced to minimum.
For modeling a DG at the system frequency, the DG source output equations (such as the PV battery models) and the control logic equations are considered. For different control algorithms and source output characteristics, the equations vary and it is impossible to build a common model that is suitable for all the designs. However, in the high frequency range, the injected high frequency transient is bypassed by the inverter due to the DC link capacitors (act as short circuit in the high frequency) and the model of the DG can be simplified by the modeling of the inverters. The other advantage of using the high frequency model is that the control algorithm is not considered due to the fact that control response time which is about several tens to hundreds millisecond is much longer than the high transient. Due to this fact, the high frequency model of the DG is suitable for DGs with different control settings and power ratings.
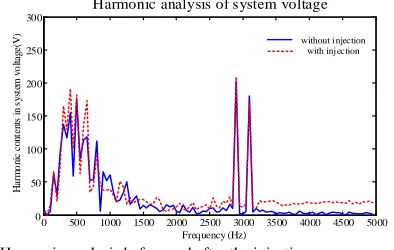
Active islanding detection usually brings about bad influence to the system power quality. The power quality analysis is carried out to prove that the proposed method actually bring minimum distortions. The harmonic analysis results with and without injection are shown in the Fig.15. The solid line in blue stands for harmonic contents of the voltage measured at PCC before disturbance injection and dashed line in red stands for harmonic contents of voltage with injections. For the convenience of observation and comparison, the fundamental frequency (50Hz) has been removed (by doing this, the detailed changes in the high frequency domain can be clearly presented).
0 500 1000 1500 2000 2500 3000 3500 4000 4500 5000 0
50 100 150 200 250 300
Frequency (Hz)
H
arm
o
ni
c
co
nt
en
ts
i
n
sy
st
em
vo
lta
ge
(V
)
Harmonic analysis of system voltage
[image:8.612.75.272.509.634.2]without i njection with inj ection
Fig. 15. Harmonic analysis before and after the injection.
As shown in the Fig.15, for a non-injection situation, harmonics of the system voltage are mainly distributed in the low-frequency range and around the switching frequency (3kHz). Compared with the solid line without injection, the dashed line indicates that disturbance injections bring about only a slight rise of harmonics contents in low-frequency range (around 500Hz) and high-frequency range (above
3.5kHz). This would cause a little increase to total harmonic distortion (THD) of the system. The THDs (up-to 50th harmonic) before and after the injection are 1.42% and 1.57% respectively and within the 5% THD standard requirement [38].
V. CONCLUSIONS
As distributed generation system with multiple DGs develops, conventional islanding detection methods which mainly aim at single-DG system are facing challenges. The existing methods using centralized injection method normally has challenges explaining the system impedance responses and this might lead to large error for practical utilization. This paper proposed an islanding detection method based on high frequency impedance estimation using external centralized transient injections. The high frequency impedance model for inverter-based DG (represented by PMSG in this paper) is provided. The simulation results show good accuracy of the proposed model regardless of operating conditions and control strategies.
Using TDLVC injection and wide-band high-frequency reactance calculation, a good islanding detection accuracy is achieved for multi-DG systems. Moreover, the intermittent TDLVC injection control of short tiny current spikes can cause little distortions to the healthy power system.
REFERENCES
[1] H. G. Far, A. J. Rodolakis, and G. Joos, "Synchronous distributed generation islanding protection using intelligent relays," IEEE Trans.
Smart Grid, vol. 3, no.4, pp.1695-1703, Dec. 2012.
[2] P. S. Georgilakis, and N. D. Hatziargyriou, "Optimal distributed generation placement in power distribution networks: models, methods, and future research," IEEE Trans. Power Systems, vol. 28, no.3, pp. 3420-3428, Aug. 2013.
[3] Chun Li, J. Savulak, and R. Reinmuller, "Unintentional islanding of distributed generation—operating experiences from naturally occurred events," IEEE Trans. Power Delivery, vol. 29, no.1, pp. 269-274, Feb. 2014.
[4] W. R. Issa, M. A. Abusara, and S. M. Sharkh, "Control of transient power during unintentional islanding of microgrids," IEEE Trans.
Power Electronics, vol. 30, no.8, pp. 4573-4584, Aug. 2015.
[5] D. Salles, W. Freitas, J. Vieira, and B. Venkatesh, "A practical method for nondetection zone estimation of passive anti-islanding schemes applied to synchronous distributed generators," IEEE Trans. Power
Delivery, vol. 30, no. 5, pp. 2066-2076, Oct. 2015.
[6] H. Laaksonen, “Advanced islanding detection functionality for future electricity distribution networks,” IEEE Trans. Power Delivery, vol. 28, no. 4, pp. 2056-2064, Oct. 2013.
[7] Z. Z. Lin, T. Xia, Y. Z. Ye, Y. Zhang, L. Chen, Y. L. Liu, K. Tomsovic, T. Bilke, and F. S. Wen, “Application of wide area measurement systems to islanding detection of bulk power systems,” IEEE Trans.
Power Systems,vol. 28, no. 2, pp. 2006-2015, May 2013.
[8] R. Sun and V. A. Centeno, “Wide area system islanding contingency detecting, and warning scheme,” IEEE Trans. Power Systems,vol. 29, no. 6, pp. 2581-2589, Nov. 2014.
[9] M. Al Hosani, Z. H. Qu and H. H. Zeineldin, “Development of dynamic estimators for islanding detection of inverter-based DG,” IEEE Trans.
Power Delivery, vol. 30, no. 1, pp. 428-436, Feb. 2015.
[10] K. El-Arroudi and G. Joos, "Data Mining Approach to Threshold Settings of Islanding Relays in Distributed Generation," IEEE Trans.
Power Systems, vol. 22, no. 3, pp. 1112- 1119, Aug. 2007.
[12] M. Padhee, P. K. Dash, K. R. Krishnanand, and P. K. Rout, “A fast gauss-newton algorithm for islanding detection in distributed generation,” IEEE Trans. Smart Grid, vol. 3, no. 3, pp. 1181-1191, Sep. 2012.
[13] M. R. Alam, K. M. Muttaqi, and A. Bouzerdoum, “A multifeature-based approach for islanding detection of DG in the subcritical region of vector surge relays,” IEEE Trans. Power Delivery, vol. 29, no. 5, pp. 2349-2358, Oct. 2014.
[14] O. N. Faqhruldin, E. F. El-Saadany, and H. H. Zeineldin, “A universal islanding detection technique for distributed generation using pattern recognition,” IEEE Trans. Smart Grid, vol. 5, no. 4, pp. 1985-1992, July 2014.
[15] M. Bakhshi, R. Noroozian, and G. B. Gharehpetian, “Anti-islanding scheme for synchronous DG units based on Tufts–Kumaresan signal estimation method,” IEEE Trans. Power Delivery, vol. 28, no. 4, pp. 2185-2193, Oct. 2013.
[16] B. Matic-Cuka, and M. Kezunovic, “Islanding detection for inverter-based distributed generation using support vector machine method,”
IEEE Trans. Smart Grid, vol. 5, no. 6, pp. 2676-2686, Nov. 2014.
[17] A. Samui, and S. R. Samantaray, “Wavelet singular entropy-based islanding detection in distributed generation,” IEEE Trans. Power Delivery, vol. 28, no. 1, pp. 411-418, Jan. 2013.
[18] N. W. A. Lidula, and A. D. Rajapakse, "A Pattern Recognition Approach for Detecting Power Islands Using Transient Signals—Part I: Design and Implementation," IEEE Trans. Power Delivery, vol. 25, no. 4, pp. 3070-3077, Oct. 2010.
[19] H. H. Zeineldin, and M. M. A. Salama, “Impact of load frequency dependence on the NDZ and performance of the SFS islanding detection method,” IEEE Trans. Industrial Electronics,vol. 58, no. 1, pp. 139-146, Jan. 2011.
[20] A. H. K. Alaboudy, and H. H. Zeineldin, “Islanding detection for inverter-based DG coupled with frequency-dependent static loads,”
IEEE Trans. Power Delivery, vol. 26, no. 2, pp. 1053-1063, Apr. 2011.
[21] E. Kamyab, and J. Sadeh, “Islanding detection method for photovoltaic distributed generation based on voltage drifting,” IET Generation, Transmission & Distribution, vol. 7, no. 6, pp. 584-592, Jan. 2013. [22] V. Menon, and M. H. Nehrir, "A hybrid islanding detection technique
using voltage unbalance and frequency set point," IEEE Trans. Power
Systems, vol. 22, no. 1, pp. 442-448, Feb. 2007.
[23] A. Samui, and S. R. Samantaray, “New active islanding detection scheme for constant power and constant current controlled inverter-based distributed generation,” IET Gene, Transmission & Distribution, vol. 7, no. 7, pp. 779-789, Feb. 2013.
[24] S. K. Kim, J. H. Jeon, H. K. Choi, and J. Y. Kim, “Voltage shift acceleration control for anti-islanding of distributed generation inverters,” IEEE Trans. Power Delivery, vol. 26, no. 4, pp. 2223-2234, Oct. 2011.
[25] H. Samet, F. Hashemi, and T. Ghanbari, “Islanding detection method for inverter-based distributed generation with negligible non-detection zone using energy of rate of change of voltage phase angle,” IET Generation, Transmission & Distribution, vol. 9, no. 15, pp. 2337-2350, Jul. 2015. [26] X. L. Chen, and Y. L. Li, “An islanding detection algorithm for
inverter-based distributed generation inverter-based on reactive power control,” IEEE
Trans. Power Electronics, vol. 29, no. 9, pp. 4672-4683, Sep. 2014.
[27] J. Zhang, D. H. Xu, G. Shen, Y. Zhu, N. He, and J. Ma, “An improved islanding detection method for a grid-connected inverter with intermittent bilateral reactive power variation,” IEEE Trans. Power Electronics, vol. 28, no. 1, pp. 268-278, Jan. 2013.
[28] A. Yafaoui, B. Wu, and S. Kouro, “Improved active frequency drift anti-islanding detection method for grid connected photovoltaic systems,”
IEEE Trans. Power Electronics, vol. 27, no. 5, pp. 2367-2375, May
2012.
[29] D. Dong, B. Wen, P. Mattavelli, D. Boroyevich, and Y. S. Xue, “Modeling and design of islanding detection using phase-locked loops in three-phase grid-interface power converters,” IEEE Journal of Emerging and Selected Topics in Power Electronics, vol. 2, no. 4, pp. 1032-1040, Dec. 2014.
[30] S. H. Lee, and J. W. Park, “New islanding detection method for inverter-based distributed Generation considering its switching frequency,” IEEE
Trans. Industry Applications, vol. 46, no. 5, pp. 2089-2098, Apr. 2010.
[31] D. Reigosa, F. Briz, C. Blanco, P. Garcia, and J. M. Guerrero, “Active islanding detection for multiple parallel-connected inverter-based
distributed generators using high-frequency signal injection,” IEEE
Trans. Power Electronics, vol. 29, no. 3, pp. 1192-1199, Mar. 2014.
[32] J. H. Kim, J. G. Kim, Y. H. Ji, Y. C. Jung, and C. Y. Won, “An islanding detection method for a grid-connected system based on the goertzel algorithm,”IEEE Trans. Power Electronics, vol. 26, no. 4, pp. 1049-1055, Apr. 2011.
[33] G. H. Gonzalez, and R. Iravani, “Current injection for active islanding detection of electronically-interfaced distributed resources,” IEEE Trans.
Power Delivery, vol. 21, no. 3, pp. 1698-1705, Jul. 2006.
[34] D. Reigosa, F. Briz, C. Blanco, and J. M. Guerrero, “Islanding detection in three-phase and single-phase systems using pulsating high-frequency signal injection,” IEEE Trans. Power Electronics,vol. 30, no. 12, pp. 5659-5666, Dec. 2015.
[35] D. Reigosa, F. Briz, C. Blanco, and J. M. Guerrero, “Islanding detection in grid-connected power converters using harmonics due to the non-ideal behavior of the inverter,” in Proc. 2013 IEEE Energy
Conversation Congress and Exposition, pp. 2649–2656.
[36] IEEE Standard for Interconnecting Distributed Resources with Electric
Power Systems, IEEE Standard 1547TM-2003(R2008), Jul. 2003.
[37] R. Gagnon, and J. Brochu, “Wind farm-full scale converter (Type 4) detailed model,” Matlab, 2012.
[38] Test procedure of islanding prevention measures for
utility-interconnected photovoltaic inverters, IEC 62116-2008, Sep. 2008.
[39] Test procedure of islanding prevention measures for
utility-interconnected photovoltaic inverters, BS EN 62116:2011, Mar.
2011.
APPENDIX
+
C A
B
C M
N
Ud
iC
R L
R L
R L
Inverter
Impedance
iInj
V5 VD5 V3
VD3 V1
VD1
V4 VD4
V6 VD6
V2 VD2
iA
iB
:Signal channel 1
:Signal channel 2
:Signal channel 3
:Signal channel 4
Disturbance current
signal
[image:9.612.330.553.473.586.2]Fig. A1 Channel analysis of external disturbance entering inverter(when iA is positive and iB positive)
+
C A
B
C M
N
Ud
iC
R L
R L
R L
Inverter
Impedance
iInj
V5 VD5 V3
VD3 V1
VD1
V4 VD4
V6 VD6
V2 VD2
iA
iB
:Signal channel 1
:Signal channel 2
:Signal channel 3
:Signal channel 4
Disturbance current
signal
[image:9.612.330.546.622.733.2]Fig. A2 Channel analysis of external disturbance entering inverter(when iA is negative and iB positive)
+
C A
B
C M
N
Ud
iC
R L
R L
R L
Inverter
Impedance
iInj
V5 VD5 V3
VD3 V1
VD1
V4
VD4 V6
VD6 V2
VD2
iA
iB
:Signal channel 1
:Signal channel 2
:Signal channel 3
:Signal channel 4
Disturbance current
signal
Fig. A3 Channel analysis of external disturbance entering inverter(when iA is negative and iB negative)
BIOGRAPHIES
Ke Jia (M’ 2012) was born in China in 1986. He received MSc and the Ph.D. degree in electrical engineering from Nottingham University, U.K., in 2008, and 2011, respectively and then worked as a Research Fellow until 2013. He is currently an Associate Professor at the North China Electric Power University. His research interests include power system protection and fault location, micro-grid and renewable energy conversion. Email: [email protected]
Tianshu Bi (M’1998, SM’09) received her Ph.D. degree at the Department of EEE in the University of Hong Kong in 2002. She is currently a professor at North China Electric Power University. Her research interests include power system protection and control, synchronized phasor measurement technique and its application.
Zhefeng Ren was born in China in 1992. He received Bachelor's degree in electrical engineering from North China Electric Power University, Beijing, in 2014. He is currently a master candidate in Electrical Engineering at North China Electric Power University. His research interests include power system protection and control, fault location and renewable energy.
David W. P. Thomas (M’94–SM’09) received the
B.Sc. degree in physics from Imperial College of Science and Technology, London, U.K., the M.Phil. degree in space physics from Sheffield University, Sheffield, U.K., and the Ph.D. degree in electrical engineering from Nottingham University, Nottingham, U.K., in 1981, 1987, and 1990, respectively. In 1990, he joined the Department of Electrical and Electronic Engineering, University of Nottingham, as a Lecturer, where he is currently a Professor of Electromagnetic. His research interests include power system transients, power system protection, electromagnetic compatibility, and electromagnetic simulation. Dr. Thomas is a member of CIGRE and a Convenor for CIGRE JWG 4.207. He is also vice-chair for IEEE EMC Technical committee 7 “Low frequency EMC”.