Avoiding lodging in irrigated spring wheat. I. Stem and root structural requirements
1
F. J. Piñera-Chavez1,2*, P. M. Berry3, M. J. Foulkes1, M. A. Jesson4and M. P. Reynolds2
2
1Division of Plant and Crop Sciences, The University of Nottingham, Sutton Bonington Campus,
3
Loughborough, Leicestershire LE12 5RD, UK
4
2CIMMYT, Int. Apdo. Postal 6-641, 06600 Mexico, DF, Mexico
5
3
ADAS High Mowthorpe, Malton, North Yorkshire YO17 8BP, UK
6
4School of Civil Engineering, The University of Birmingham, Edgbaston, Birmingham B15 2TT, UK
7
8
*Corresponding author:[email protected],[email protected]
9
10
11
12
13
14
15
16
17
18
19
20
21
22
23
Abstract
25
A model of the lodging process has been successfully adapted for use on spring wheat grown in North-West
26
Mexico (NWM). The lodging model was used to estimate the lodging-associated traits required to enable
27
spring wheat grown in NWM with a typical yield of 6 t ha-1and plant height of 0.7 m to achieve a lodging
28
return period of 25 years. Target traits included a root plate spread of 51 mm and stem strength of the
29
bottom internode of 268 N mm. These target traits increased to 54.5 mm and 325 N mm, respectively, for a
30
crop yielding 10 t ha-1. Analysis of multiple genotypes across three growing seasons enabled relationships
31
between both stem strength and root plate spread with structural dry matter to be quantified. A NWM
32
lodging resistant ideotype yielding 6 t ha-1would require 3.93 t ha-1of structural stem biomass and 1.10 t
33
ha-1of root biomass in the top 10 cm of soil, which would result in a harvest index (HI) of 0.46 after
34
accounting for chaff and leaf biomass. A crop yielding 10 t ha-1would achieve a HI of 0.54 for 0.7 m tall
35
plants or 0.41 for more typical 1.0 m tall plants. This study indicates that for plant breeders to achieve both
36
high yields and lodging-proofness they must either breed for greater total biomass or develop high yielding
37
germplasm from shorter crops.
38
Keywordsspring wheat, lodging-proof ideotype, stem strength, anchorage strength, root plate spread, grain
39
yield, stem biomass
40
Introduction
41
Lodging is defined as the permanent displacement of plant stems from their vertical position as a result of
42
wind acting on the shoot and rain or irrigation weakening the soil and reducing anchorage strength (Berry et
43
al. 2004). Lodging grain yield reductions of wheat can be in the range of 7 to 80% (Acreche and Slafer,
44
2011; Berry and Spink, 2012; Easson et al., 1993; Fischer and Stapper, 1987; Tripathi et al., 2005; Weibel
45
and Pendleton, 1964) and commonly are accompanied by reductions of bread making quality (Berry et al.
46
2004). In fact, as Pinthus, (1974) indicated, these reductions can be at least as great as that resulting from
47
crypotogamic diseases and insect pests in high yielding environments. Lodging affects all cereal species
48
and many other crops, such as oilseed rape and sunflowers, throughout the world. In wheat, lodging can
49
increase susceptibility to pests and diseases (Berry et al., 2004; Pinthus, 1974), induce negative effects on
50
crop development (decreasing grain per m2and average grain weight) (Acreche and Slafer, 2011; Fischer
51
and Stapper, 1987) and complicate harvest (Berry et al., 2004; Fischer and Stapper, 1987; Pinthus, 1974).
52
Widespread lodging affects from 15 to 20% of the UK wheat growing area once every three or four years
(Berry, 1998), although, Griffin, (1998) indicated a lodging incidence of 10% every year. For the Yaqui
54
Valley, a survey conducted during 1981 to 1991 (80 farmers’ fields each year) indicated occurrence of
55
lodging from 18 to 40% of the growing area in several years (Tripathi et al., 2004). Yield potential of the
56
Yaqui Valley (NW Mexico) (irrigated environment) has been estimated at 9 t ha-1and 10.4 t ha-1for the UK
57
(rainfed environment) (Fischer and Edmeades, 2010). Yield potential losses due to lodging can be
58
estimated from 0.63 to 7.2 t ha-1for the Yaqui Valley and 0.73 to 8.3 t ha-1in the UK in the affected area.
59
Peake et al., (2014) estimated a lodging yield potential loss of 1.7 t ha-1of irrigated spring wheat in
sub-60
tropical Australia (yield potential of 9 t ha-1). In economic terms it has been reported that in a severe
61
lodging year the cost for the farming industry would be around US$188 million in the UK alone (Berry,
62
1998). For the Yaqui Valley this cost would be US$29 million (assuming 40% of area affected from 76 000
63
ha (SIAP, 2016), 50% yield loss and US$215 wheat price per tonne (Lantican et al., 2016)). If we assumed
64
1.0 t ha-1of yield loss due to lodging in 10% of the world wheat growing area, which was 222 million ha in
65
2014 (Lantican et al., 2016), then there will be a grain yield loss of around 22 million tonnes every year
66
(equivalent to US$4.7 billion assuming a global wheat price of US$215). This would add an extra 3% to the
67
700 million tonnes produced in average worldwide every year (FAO, 2014). A wheat crop that would lodge
68
once in 25 years would add an extra 72% to the total worldwide wheat production across those 25 years. In
69
a scenario where the primary objective is to increase grain yield to fulfil global food demands (Reynolds et
70
al., 2012, 2011) and research initiatives such as International Wheat Yield Partnership are investing in this,
71
maintaining lodging resistance will be of paramount importance to protect the increased productivity.
72
Plant breeders have historically reduced lodging risk by introducing dwarfing genes to produce shorter
73
varieties. Additional plant height reduction has been possible through the use of plant growth regulators or
74
PGRs that helped to reduce further lodging risk (Berry et al., 2004; Crook and Ennos, 1995; Pinthus, 1974;
75
Tripathi et al., 2004; Webster and Jackson, 1993). Optimizing crop management also helped farmers to
76
reduce lodging risk and examples are reduced seed rate, delayed sowing, reduced and delayed
77
nitrogen(Berry et al., 2004; Webster and Jackson, 1993) and rolling the soil (Berry et al., 2004). Lodging
78
resistance must be continually improved to counter the escalating lodging risk arising from continued yield
79
increases. However, there may now be limited potential to continue improving lodging resistance through
80
further decreasing plant height because the minimum height that is compatible with high yield (0.7 to 1.0 m
81
(Allan 1986; Kertesz et al. 1991; Richards 1992; Balyan and Singh 1994; Miralles and Slafer 1995a;
82
Flintham et al. 1997; Berry et al. 2014)) has now been reached in many environments. Miralles and Slafer
(1995b) suggested that dwarfing genes may have a direct effect to reduce the final grain weight. Dwarfing
84
genes have also been associated with a reduction of water soluble reserves storage capacity (Cossani and
85
Reynolds, 2012) and leaf extension rate (Keyes et al. 1989) that might reduce grain weight. Thus, a
86
reduction of the soluble reserves in the stem (particularly in dry environments) (Borrell et al. 1993) or
87
reduction of final leaf area (McCaig and Morgan, 1993; Daniel J Miralles and Slafer, 1995) and radiation
88
use efficiency at pre-anthesis (Miralles and Slafer, 1997) are possible reasons why extreme dwarfism could
89
significantly reduce grain yield.
90
It therefore seems that reducing height to below 0.7 m might not be the best mechanism to improve
91
lodging resistance in modern high yielding wheat. If we consider that the two types of lodging are due to
92
the bending/buckling of the stem base (stem lodging) or the over-turning of the anchorage system (root
93
lodging), then greater lodging resistance in wheat can be achieved by strengthening these structures (Berry
94
et al. 2003b). In the past, stem strength and anchorage strength have been proposed as key properties of
95
cereal crops for lodging resistance (Crook and Ennos, 1994, 1993; Easson et al., 1995, 1992; Ennos, 1991a,
96
1991b; Graham, 1983; Pinthus, 1974). Large genetic variation has been identified for the anchorage and
97
stem strength of winter wheat in the UK (Berry et al. 2003a; Berry et al. 2007). However, breeding to
98
improve these traits in high yielding wheat requires more understanding about how they develop and
99
possible trade-offs with yield-forming processes in different environments.
100
Baker et al. (1998) developed a model of lodging that has been validated by Berry et al. (2003b) for
101
winter wheat in the UK. The model was based on the interaction of plant, soil and wind characteristics and
102
calculates the stem and root lodging risk according to the wind speed required to over-turn the root
103
anchorage system or to buckle the stem base of a plant. A preliminary attempt to quantify the stem strength
104
and anchorage strength required by winter wheat to withstand 1 in 25 year wind gusts in the UK has been
105
made by Berry et al. (2007) using this lodging model. This indicated that substantial amounts of dry matter
106
may need to be invested in the stem and anchorage system to make plants lodging-proof for a period of 25
107
years, which were estimated at 7.9 t ha-1of stem biomass and 1.0 t ha-1surface root biomass (roots in the
108
first top 10 cm of soil) (Foulkes et al. 2011). This would mean that the maximum harvest index (ratio of
109
grain dry matter to total above-ground dry matter) for a 0.7 m tall crop yielding 8 t ha-1would only be 0.42,
110
rising to 0.50 for a crop yielding 16 t ha-1, which is significantly less than the theoretical maximum harvest
111
index 0.62 estimated by Austin, (1980). Additionally it is possible that the investment in dry matter for the
112
stem and anchorage system during stem elongation which is the critical phase for determination of grain
number (Fischer, 1985) may compete for resources with grain yield determination. The implications of
114
Berry et al. (2007) are that the dual requirements of breeding for greater yield and greater lodging resistance
115
will be challenging. However, parts of the analysis were based on limited datasets for winter wheat and it
116
was not possible to distinguish between the structural dry matter and water soluble carbohydrate in the
117
stem, which may mean that the estimate of stem structural dry matter to avoid lodging was over-estimated.
118
The aims of this paper were to 1) investigate the relationship between stem strength and anchorage
119
strength and the dry matter requirements of these structures for spring wheat in North-West Mexico
120
(NWM), 2) adapt an existing model of lodging for winter wheat for spring wheat and calculated lodging
121
risk, 3) estimate the structural dry matter requirements to enable spring wheat to avoid lodging in this
122
particular environment, and 4) consider to what extent the development of structural characteristics may
123
compete with yield-forming processes and grain yield.
124
Experimental methods
125
Experiments
126
Four field experiments were established during the field seasons 2010-2011, 2011-2012, 2012-2013 and
127
2013-2014 (referred to hereafter as 2011, 2012, 2013 and 2014, respectively) in the experimental station of
128
CENEB (Campo Experimental Norman E. Borlaug) located in the Valle del Yaqui, Sonora, Mexico
129
(27.9°N and longitude 109.9°W). The soil type at the experimental station is a coarse, sandy clay, mixed
130
montmorillonitic typic caliciorthid, slightly alkaline (pH 7.7) in nature (Sayre et al. 1997), bulk density of
131
1.32 g cm-3and organic matter of 0.7 % approximately (CIMMYT internal records). Detailed information
132
about experiments and cultivars (CIMMYT Mexico Core Germplasm Panel or CIMCOG consisting of 58
133
T. aestivumand twoT. durum anddescribed in Table S1) is given in a companion paper by (Piñera-Chavez
134
et al., (2016). The whole CIMCOG panel was established during 2011 and a subset of 30 cultivars were
135
used for 2012 and 2013 (as indicated in Table S1). Experiments were managed under a conventional
136
agricultural management but maintaining yield potential conditions. The average seed rate for all plots in
137
experiments 2011, 2012 and 2013 was 10.6 g m-2 which gave a range 213-292 seeds m-2. For the
138
experiment in 2014 a subset of five cultivars with contrasting values for stem strength, anchorage strength
139
and stem wall material strength (cultivars 7, 19, 24, 57 and 60, see Table S1) was established using seed
140
rates of 75, 125 and 175 seeds m-2to evaluate the effect of low plant populations on lodging traits. The
141
irrigation schedule included five to six flood irrigation events (including one at sowing) during the cycle
and the fertilization was 200 kg ha-1ofN(25 % before sowing and 75 % before first irrigation event) and 50
143
kg ha-1of P (before sowing). Plant growth regulators were not applied in any of the experiments. Plant
144
emergence dates (at 50 % of plants emerged) were recorded at 15 of December 2010, 16 of December 2011,
145
02 of December 2012 and 01 of December 2013 for experiments 2011, 2012, 2013 and 2014, respectively.
146
Measurements
147
Plant measurements were done at GS65 + 20 days (Zadoks et al. 1974) during 2011, 2012 and 2013 as was
148
described in (Piñera-Chavez et al., 2016) (detailed key information of measurements is given in Table S2).
149
Additionally, during 2013 and 2014 main shoot measurements of the length and breaking strength
150
following removal of the leaf-sheath of the internodes 1 to 5 were determined for five cultivars with
151
contrasting performances in stem strength, material strength and anchorage strength (Table 1). Internode 1
152
in the main shoot was identified, defined as the first internode of more than 10 mm, originating at or just
153
below the ground surface and without crown roots emerging from its upper node. Subsequent internodes
154
ascending the stem were numbered two, three, four etc., with the uppermost internode referred to as the
155
peduncle. Also, dry weight and the following determination of the water soluble carbohydrates content
156
(WSC) was made on these internodes. WSC content was also determined for the whole main shoot in all
157
cultivars used for experiments 2011, 2012 and 2013. These analyses were carried out in the Maize Nutrition
158
Quality and Plant Tissue Analysis Laboratory from CIMMYT (El Batan, Mexico) using the Anthrone
159
method (Galicia et al. 2008).
160
Table 1Cultivars from CIMCOG used for 2014 experiment
161
Cultivar Character of interest
BACANORA T 88a Lowest stem and
anchorage strength
CMH79A.955/4/AGA/3/4*SN64/CNO67//INIA66/5/NAC/6/RIALTOa Highest anchorage
strength
CROC_1/AE.SQUARROSA (205)//BORL95/3/PRL/SARA//TSI/VEE#5/4/FRET2a Highest material strength
WBLL1*2/KURUKU*2/5/REH/HARE//2*BCN/3/CROC_1/AE.SQUARROSA(213)//PGO/4/HUITESa Highest stem strength
YAV_3/SCO//JO69/CRA/3/YAV79/4/AE.SQUARROSA(498)/5/LINE1073/6/KAUZ*2/4/CAR//KAL/B
B/3/NAC/5/KAUZ/7/KRONSTAD F2004/8/KAUZ/PASTOR//PBW343a
Lowest material strength
162
Calculations
A validated model of lodging for winter wheat (Baker et al. 1998; Berry et al. 2003b) was used to calculate
164
the stem failure moment (stem strength at the point of failure), anchorage failure moment (anchorage
165
strength at the point of failure), the wind-induced base bending moment (leverage force) of the shoot and
166
plant, and overall risk to stem and root lodging on spring wheat (stem and anchorage failure wind speed).
167
This model included stem base bending model estimation using Baker, (1995) method and a simplified
168
version of the root strength model of Crook and Ennos, (1993).
169
The stem failure moment (Bs) was calculated from the breaking strength (Fs) and length (ℎ) of the
170
internode (Eq. 1).
171
ܤ௦= ଵସܨ௦ℎ (1)
172
Anchorage failure moment (ܤோ) was calculated from the root plate spread (݀), the shear strength of the
173
surrounding soil (ݏ) and a constant of 0.43 (݇ଷ) taken from Baker et al. (1998) (Eq. 2). The surrounding soil
174
was assumed to be at field capacity with a shear strength of 6 kPa (Baker et al. 1998).
175
ܤோ=݇ଷݏ݀ଷ (2)
176
The shoot base bending moment (B) was obtained from the density of air (ρ= 1.2 kg m-3), the projected
177
ear area (A), the shoot’s height at centre of gravity (X), the wind gust speed (Vg), the shoot’s natural
178
frequency (n), the acceleration due to gravity (g = 9.81 m s-2), the shoot’s damping ratio (ξ = 0.08) and the
179
drag coefficient of the ear (Cd= 1.0). The base bending moment of the whole plant was calculated by
180
multiplyingBby the number of shoots per plant (Baker et al. 1998):
181
ܤ= ଵଶߩܣܥௗܸܺଶቀ1 + (ଶగ)మቁቀ1 +݁ିగஞ ୱ୧୬గ(గ/ସ/ସ)ቁ (3)
182
Natural frequency is considered a parameter of major importance of the wind-induced leverage (base
183
bending moment) (Baker et al., 1998), although, height at centre of gravity and ear projected area have also
184
a great influence (Berry et al., 2003b). Assuming the wind-induced leverage decreases linearly for
185
progressively higher positions up the stem (Berry et al. 2006), bending moment at the base of subsequent
186
internodes 2 to 5 was calculated by multiplying the leverage exerted at the base of internode 1 with the ratio
187
of the distance between the base of internodes 2, 3, 4 or 5 and the mid-point of the ear with the total stem
188
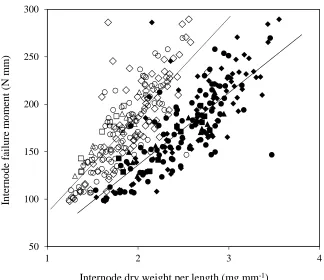
height at the mid-point of the ear (Berry et al. 2007). These ratios were measured in spring wheat at 0.84 for
189
the base of internode 2, 0.70 for internode 3, 0.50 for internode 4 and 0.19 for internode 5. Ratio at the
mid-190
point of the length internode 5 or peduncle was used to calculate the bending moment (19%) due to
uniform geometric properties (Berry et al. 2007). This means that the leverage exerted at the base of
192
internodes 2, 3, 4 and the peduncle should be 84, 70, 50 and 19 %, respectively, of the leverage exerted at
193
the base of internode 1.
194
The stem failure wind speed (VgS) and the anchorage failure wind speed (VgR) were calculated by
195
combining and re-arranging equations (1) and (2), with equation (3) (Berry et al., 2003b). Letter N in
196
equation (5) indicates the number of shoots per plant.
197
ܸௌ= (2ܤ௦).ହ ×ቆߩܣܥௗܺ ቀ1 + (ଶగ)మቁ൫1 +ܭஞ൯ቇ
ି.ହ
(4)
198
ܸோ= (2ܰܤோ).ହ ×ቆߩܣܥௗܺ ቀ1 + (ଶగ)మቁ൫1 +ܭஞ൯ቇ
ି.ହ
(5)
199
Statistical analysis
200
Simple linear and non-linear regression analysis and simple linear regression analysis with groups were
201
used to investigate relationships between traits. Analysis of variance using a general linear model was used
202
to test for differences between years, cultivars and leaf sheath removal treatments together with treatment
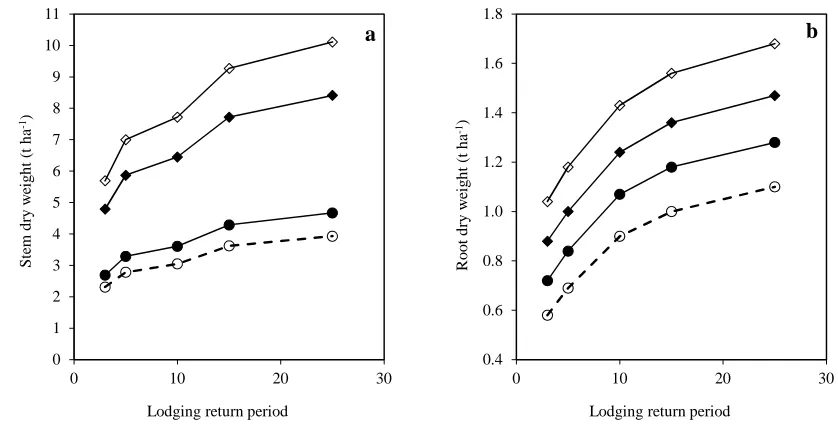
203
interactions. All the analyses were carried out by GENSTAT 15thEdition (VSN International, 2012).
204
Wind speed characterisation
205
Daily wind run data was sourced from a local meteorological station within the wheat growing area of the
206
Valle del Yaqui, Sonora, Mexico (grid reference 27.3°N and 109.1°W, 38 m asl) spanning a 40-year period
207
from 1973 to 2013. The weather station was located within 10 km from the experiments. The daily wind run
208
data were converted to the maximum hourly mean wind speed for each day by multiplying by a factor of
209
1.606 (Berry et al. 2003b). The hourly mean values were each converted to hourly gust values, for gusts of
210
durationτ= 0.3 s, using the empirical equation described by Berry et al. (2003b):
211
ܷ௨௦௧=ܷ ቀ1 + 0.42ቀఙቁsinቀଷఛ ቁቁ (6)
212
whereσ/Umis the turbulence intensity (TI). A value ofσ/Um= 0.5 was used, again following the work of
213
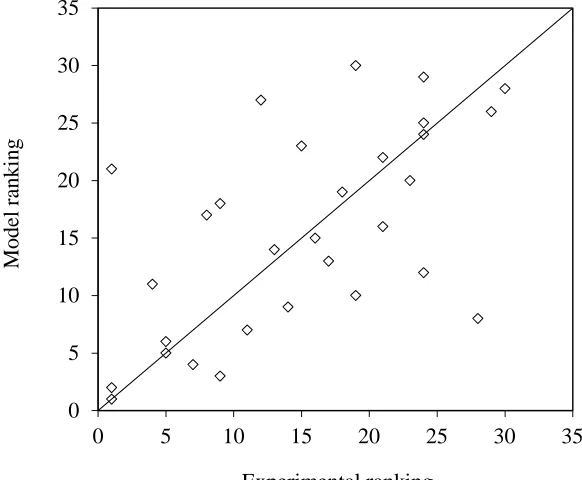
Berry et al. (2003b) who used the value determined by Finnigan (1979) for wind over a wheat crop. These
214
values were then corrected for differences in the roughness,z0, at the airport weather stations and the crop
215
locations, and also for the difference in height above ground,z, of the airport anemometers (10 m), the met
station anemometer (1.5 m) and the pertinent wind speed height for crop lodging of 2 m (Baker et al. 1998;
217
Berry et al. 2003b). This correction takes the form:
218
ܷ=ܷ௪
୪୬ቀషబቁ
୪୬ቀషబቁ
ೢ
(7)
219
where subscriptscandwrefer to the crop and weather station locations, respectively.z0over the crops has
220
been estimated asz0 = λ(h – d), whereλ= 1/3,h= 1 m andd= 0.75h, giving a value ofz0= 1/12 m, withz0
221
= 0.01 m at the weather station (Berry et al. 2003b). Finally, an altitude correction has been applied to the
222
gust wind speed using theV99correction factor of (1 + 0.009h) specified in Baker et al. (1998). The
223
correction is taken as the ratio (1 + 0.009hc)/ (1 + 0.009hw) wherehcandhware the crop and weather station
224
altitudes respectively. As stated in Berry et al. (2003b), these methods were developed based on UK
225
Meteorological Office data and should therefore be applied with care in other locations. In particular, these
226
methods are only applicable where synoptic (non-convective) winds are expected.
227
In order to allow the analysis to concentrate on the period when lodging risk is possible, the hourly gust
228
values were split by month (i.e. 12 groups of data were formed from the 40 years of data, each
229
corresponding to a particular month). The probability of the gust speed exceeding a certain value was
230
calculated for each month on a per day basis. At each scale, probabilities of the gust speed being within a
231
certain range were calculated by sorting the values into 0.5 m s-1wide “bins”, with the probability of gusts
232
within the range covered by each bin calculated simply from the number of values in that bin divided by the
233
total number of values. Probabilities of exceeding a certain value were calculated as the sum of the
234
probabilities for the bins whose ranges exceeded the required value. The probability of experiencing any
235
particular wind gust during the lodging risk period was then calculated using daily gust speed probabilities
236
for the months during which lodging is possible and assuming a stem lodging risk period of 50 days in
237
March and April (assuming one wheat cycle per year) (window between cultivars with earliest flowering
238
and the latest maturity was 52 days). Root lodging risk increases when the soil surface is wet (Easson et al.
239
1995; Berry et al. 2003a), typically when the first 50 mm of soil is at field capacity (Baker et al. 1998). This
240
can be attributed to the movement of the plant crown in a saturated soil surface after flood irrigation in
241
irrigated environments (Fischer and Stapper, 1987) or after precipitation in rainfed environments (Crook
242
and Ennos, 1994), Moreover, Sterling et al. (2003), using a portable wind tunnel in the field, found that root
243
lodging occurred only when the soil was saturated. Additionally, it is well known that water supply most
244
spring wheat worldwide is given by flood irrigation in flat beds. It therefore seems sensible to consider the
root lodging risk when the soil surface is moist. For our purposes, we estimated the root lodging risk period
246
for the NWM environment to be 10 days, based on the number of days when the first 60 mm of soil depth
247
(maximum root plate depth exceeded 50 mm in CIMCOG panel) was at 50% of plant available water
248
during the 50 day lodging risk period. At lower soil moisture content, the soil is usually too strong to permit
249
root lodging. Spring wheat in this region typically receives three flood irrigation events during the 50 day
250
lodging risk period, each delivering approximately 73 mm water (0 – 120 cm soil core depth). Windy
251
conditions often occur post-anthesis which may coincide with irrigations indeed in that period in 2014 and
252
2016 windstorms affected the area. Farmers pay special attention whether to apply the last irrigation or not
253
(normally at mid grain filling) because of the intensity of the windy season. This is a difficult decision to
254
make because avoiding the last irrigation sometimes ends in grain yield losses. Using internal records of
255
field capacity and permanent wilting point from CENEB and evapotranspiration data from nearest weather
256
station it has been estimated that the top 150 mm of soil dries to 50 % of plant available water after 8 days
257
of irrigation. The soil tends to dry from the top downwards which indicates that the top 60 mm of soil will
258
be dried to 50% plant available water within about 3.2 days, giving about 10 days when the top 60 mm of
259
soil may be moist and weak enough to permit root lodging. A review of rainfall data over the past 40 years
260
showed that the chance of more than 10 mm of rain (enough to bring the top 60 mm of soil to field
261
capacity) falling in one day during March or April was very small.
262
Lodging model development
263
This section describes how for spring wheat the lodging model was further developed to estimate the key
264
plant characteristics that determine base bending moment (shoot height at centre of gravity, shoot natural
265
frequency and ear area) from plant characteristics that are more commonly measured by crop physiologists
266
(grain yield, grain harvest index, plant height and shoots m-2). This process was carried out for winter wheat
267
by Berry et al. (2004), however spring wheat has fundamental differences which may affect how the plant
268
characteristics described above are related. One key difference is the presence of awns on the spring wheat
269
varieties. Theoretically, shoot height at centre of gravity (X) can be calculated from stem length (SL), stem
270
and leaf fresh weight (SW), ear fresh weight (EW) and ear length (EL) following the Eq. (8) which assumes
271
uniform weight of shoot and ear (Berry et al. 2004).
272
ܺ= (ௌಽௌೢାଶௌಽாೈାாಽாೈ)
ଶ(ௌೈ ାாೈ) (8)
The components of Eq. (8) can be calculated from physiological crop traits measured commonly: grain
274
yield (Y, g m-2), the number of ears per metre square (En), the ratio of chaff dry weight to total ear dry
275
weight (), the harvest index (HI) and the crop height to the tip of the ear (h, m) (Eqs. 9 – 11).
276
ܧௐ =
(ଵିఈ) ൗ
ா (9)
277
ܵௐ =ாೈ(ுூଵିఈ)−ܧௐ (10)
278
ܵ= ℎ −ܧ
279
(11)
280
Equation 8 was tested using measurements ofSWandEWat GS65 + 7 d in a random sample of 20 plants
281
per plot, andX,SL, En and ELatGS65 + 20 d in 10 plants per plot in all the plots during 2012 and 2013
282
experiments. Fig. 1 shows that Eq. 8 accounted for a substantial proportion of the differences in height at
283
centre of gravity, but over-predicted the measurement by about 6% on average. The most likely explanation
284
for the overestimate is non-uniform distribution of the dry matter along the shoot, with more at the base
285
than the top (Berry et al. 2004).
286
287
Fig. 1Predicted and measured height at centre of gravity at GS65 + 7 days and GS65 + 20, respectively, for
288
plot means of 2012 (closed squares) and 2013 (open squares). () 1:1 line. Best fit line, y = 0.70x + 0.15;
289
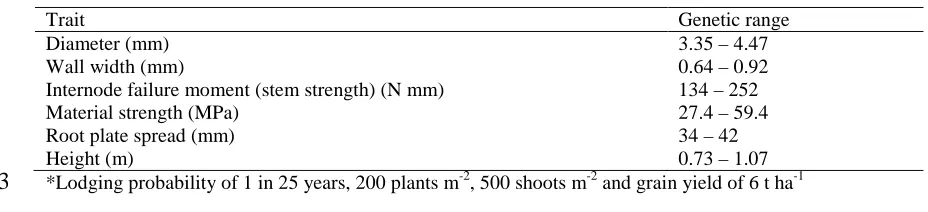
R2=0.64 (P< 0.001)
290
0.40 0.45 0.50 0.55 0.60 0.65 0.70
0.40 0.45 0.50 0.55 0.60 0.65 0.70
Predicted height at centre of gravity (m)
M
ea
su
re
d
h
ei
g
h
t
at
ce
n
tr
e
o
f
g
ra
v
it
y
(m
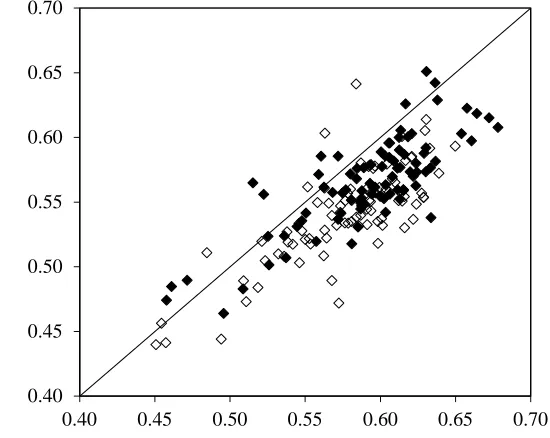
[image:11.595.116.391.431.650.2]Regression analysis performed with data from all plots measured in 2012 and 2013 showed an inverse
291
correlation between the natural frequency (nn) of the main shoot with the measured height at centre of
292
gravity (Fig. 2a) resulting in equation 12. The ear area (including awns) was shown to correlate with the
293
fresh weight of the ear resulting in equation 13 (Fig. 2b).
294
݊= 0.7ݔିଵ.ସ+ 0.3
295
(12)
296
ܣ= 9.95 + 1.02ܧௐ (13)
297
298
Fig. 2(a) Height at centre of gravity at GS65 + 20 plotted against natural frequency for plot means of 2012
299
(closed squares) and 2013 (open squares). Regression line: y = 0.67x-1.4(R2=0.38;P< 0.001). (b) Ear fresh
300
weight plotted against ear area at GS65 + 20, for plot means of 2012 (closed squares) and 2013 (open
301
squares). Best fit line: y = 1.02x + 9.95 (R2=0.44;P< 0.001)
302
Hence, the further developed equations 8 to 13 for spring wheat have demonstrated how plant height,
303
harvest index, shoots per square meter and yield can be used to calculate lodging model inputs; height at
304
centre of gravity, natural frequency and ear area. Successively, these parameters can be used in equation 3
305
to estimate the effect of changes to plant height, harvest index and yield on the base bending moment of a
306
single shoot and the whole plant on spring wheat genotypes.
307
Results
308
Wind gust speed probabilities
309
0 5 10 15 20 25 30
0 2 4 6 8 10 12 14 16
Ear fresh weight (g)
E
ar
ar
ea
(c
m
2)
b
0.5 1.0 1.5 2.0 2.5
0.40 0.45 0.50 0.55 0.60 0.65 0.70
Height at centre of gravity (m)
N
at
u
ra
l
fr
eq
u
en
cy
(H
z)
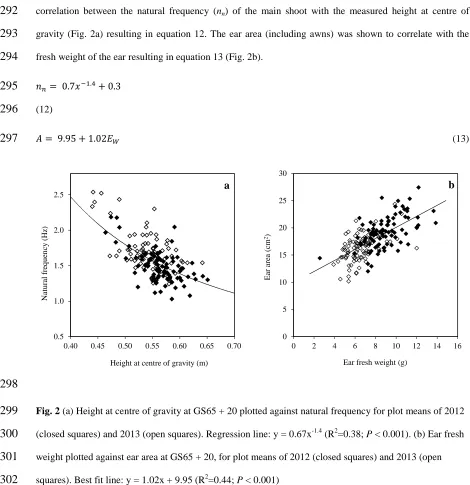
[image:12.595.54.524.90.575.2]The probabilities for experiencing wind gust speeds at the height of the crop during stem and root lodging
310
risk periods at NWM are summarised in Fig. 3.
311
312
Fig. 3North-West Mexico seasonal maximum wind gust probabilities for 50 days of high stem lodging risk
313
(○) and for 10 days of high root lodging risk (when surface soil horizon is moist) (×)
314
Annual wind gust speed return periods for the NWM environment (Table 2) show that the plant must
315
withstand a wind gust of 22 m s-1to have a stem lodging return period of 25 years, and it must withstand a
316
wind speed of 18 m s-1to have a root lodging return period of 25 years. For a return period of 10 years the
317
critical wind speeds that must be withstood fall to 19 m s-1and 16 m s-1for stem and root lodging,
318
respectively. Considering lodging return period as the period of time between lodging events or the period
319
of time between two wind gust peaks of 22 m s-1(stem lodging) and 18 m s-1(root lodging) if we use a
320
lodging return period of 25 years (comparable with the UK lodging resistant ideotype). Berry et al., (2004)
321
defined lodging proofness as: “the structure that can withstand the strongest wind likely to occur over a
322
cereal crop once every generation”.
[image:13.595.97.410.130.406.2]323
Table 2Seasonal wind gust speed return period for Obregon
324
Wind gust return period Wind gust speed (ms-1)
(years) stem lodging risk root lodging risk
5 18 14
10 19 16
15 21 17
0.0 0.2 0.4 0.6 0.8 1.0
0 5 10 15 20 25 30
A
n
n
u
al
p
ro
b
ab
il
it
y
[image:13.595.63.444.148.628.2]25 22 18
325
Calculating the lodging-proof ideotype
326
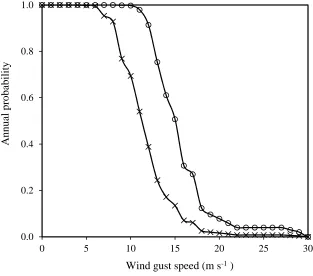
The maximum wind induced shoot and plant leverages for crops with a range of crop height and yield have
327
been calculated for lodging return periods of 1 year in 5 to 1 year in 25 (Fig. 4) using equations 3 and 6-11.
328
The wind-induced shoot base bending moment (leverage) (N mm) calculated for the maximum wind speed
329
expected during the entire 50 day stem lodging risk period represent the minimum failure moment (stem
330
strength) of the stem base (N mm) for supporting the shoot. The wind induced plant leverage calculated for
331
the wind speeds expected during the 10 day root lodging period represent the minimum strength of the
332
anchorage for supporting all the shoots of a single plant. To carry out these calculations it was assumed that
333
the crops had 500 shoots per plant and 200 plants m-2which are typical for the Yaqui Valley near Obregon.
334
The ideotype crop with the current average on farm yield of 6 t ha-1(at 12% moisture) for the NWM
335
environment (Fischer and Edmeades, 2010), and minimum crop height of 0.7 m that has been observed to
336
be compatible with high yield, must have a stem strength equivalent to the 268 N mm of shoot leverage and
337
anchorage strength equivalent to 448 N mm of plant leverage. If crop yield and plant height are increased to
338
10 t ha-1and 1.0 m, respectively, then the stem strength required must be equivalent to 480 N mm of shoot
339
leverage and anchorage strength equivalent to 803 N mm of plant leverage.
340
341
Fig. 4Shoot leverage (a) and plant leverage (b) for a crop yielding 6 t ha-1 with a crop height of 1.0 m (○)
342
and 0.5 m (●), and crop yielding 16 t ha-1 (◊) and 4 t ha-1 (♦) with a crop height of 0.7, for different lodging
343
268 0 50 100 150 200 250 300 350 400 4500 5 10 15 20 25 30
Lodging return period
S h o o t le v er ag e (N m m )
a
448 0 100 200 300 400 500 600 7000 5 10 15 20 25 30
Lodging return period
[image:14.595.98.510.475.686.2]return periods in the NWM environment. Dotted line indicates a NWM wheat crop with current average
344
yield of 6 t ha-1and putative minimum crop height compatible with this yield of 0.7 m
345
The size of the root plate required to avoid lodging for a range of crop types and lodging return periods
346
have been calculated using Eq. (2). Stem material strength (σ) was calculated using Eq. (14) where stem
347
wall width (t) was constant (0.65 mm) and the stem radius (ɑ) and stem strength (Bs) were defined by the
348
maximum wind gust of each lodging return period (Table 2). A minimum stem wall width of 0.65 mm was
349
assumed because it is understood that a thin walled, but wide, cylinder is the best way of achieving strength
350
for the minimum investment of dry matter (Berry et al., 2007) and 0.65 mm was the thinnest wall width
351
observed in the spring wheat experiments.
352
ܤݏ= ఙగସయ൬1 −ቀି௧ ቁସ൰ (14)
353
The target root plate spread ranged from 43.2 mm for a 0.7 m tall crop yielding 6 t ha-1with a lodging
354
return period of 5 years, to 62.1 mm for a 1.0 m tall crop yielding 10 t ha-1with a lodging return period of
355
25 years. These calculations assumed the soil was rolled after sowing to consolidate it. A 0.7 m tall crop
356
yielding 6 t ha-1with a lodging return period of 5 years would require a stem diameter of 4.04 mm with a
357
material strength of 35 MPa or alternatively the required strength could be achieved with a stem diameter of
358
3.51 mm with a material strength of 50 MPa. A 1.0 m tall crop yielding 10 t ha-1with a lodging return
359
period of 25 years would require a stem diameter of 6.09 mm with a material strength of 35 MPa or 5.24
360
mm with a material strength of 50 MPa (Table 3).
[image:15.595.79.530.537.755.2]361
Table 3NWM ideotype trait targets for different lodging return periods
362
Character Lodging return period (years)
5 10 15 25
0.7 m tall and 6 t ha-1
Root plate spread (mm) 43.2 47.3 49.2 51.1
aInternode diameter (mm) 4.04 4.23 4.58 4.76 bInternode diameter (mm) 3.51 3.67 3.97 4.12
0.7 m tall and 10 t ha-1
Root plate spread (mm) 46.1 50.4 52.5 54.5
aInternode diameter (mm) 4.38 4.58 4.97 5.16 bInternode diameter (mm) 3.79 3.96 4.29 4.45
1.0 m tall and 6 t ha-1
Root plate spread (mm) 49.1 53.7 55.9 58.1
a
Internode diameter (mm) 4.73 4.94 5.38 5.59
bInternode diameter (mm) 4.09 4.27 4.63 4.82
Root plate spread (mm) 52.5 57.4 59.8 62.1
aInternode diameter (mm) 5.14 5.38 5.85 6.09 bInternode diameter (mm) 4.43 4.63 5.03 5.24 a
Material strength of 35 Mpa;bmaterial strength of 50 Mpa; * all crops assumed to have a stem wall width of 0.65 mm
363
Biomass and failure moment of stem and anchorage system
364
A positive regression (R2= 0.63;P< 0.001) was found between the structural stem dry matter per unit
365
length and internode failure moment for internodes 1 to 2 (27 cultivars, 2011, 2012, 2013 and 5 cultivars,
366
2014) and internodes 3 to 4 (5 cultivars, 2013 and 2014). According to this regression model where the
367
response variable was the internode failure moment (stem strength), a fitted value of 100 N mm in this
368
parameter could be achieved with a structural stem dry weight per unit length of 1.13 mg mm-1or with 1.53
369
mg mm-1of structural plus WSC stem dry weight (Fig. 5). There was no association between WSC content
370
and internode failure moment for internodes 1 to 2 (2011, 2012, 2013 and 2014) and internodes 3 to 4 (2013
371
and 2014) (R2= 0.009).
372
Regarding the anchorage system there was a positive relationship between root dry weight per plant and
373
root plate spread among 27 genotypes which had a consistent slope across years 2012 and 2013 of 0.038
374
mm mg-1, but different y axis intercepts of 24.7 and 35.6 mm, respectively, and an R2of 0.74 (P< 0.001)
375
for the regression model (Fig. 6). Regression analysis on this association for 2011 showed a fitted line with
376
a slope of 0.011 mm mg-1and y-axis intercept of 28.8 mm and an R2of 0.18 (P< 0.05).
378
Fig. 5Dry weight per unit length plotted against internode failure moment of internode 1 (diamonds),
379
internode 2 (circles) for 27 genotypes (2011, 2012 and 2013 experiments) and of internodes 1, internode 2,
380
internode 3 (triangles) and internode 4 (squares) for five genotypes (2013 and 2014 experiments). Open
381
figures indicate structural dry weight (y = 103x – 16.8; R2= 0.63;P< 0.001) and closed figures indicate
382
overall dry weight (y = 76.2x – 16.3; R2= 0.64;P< 0.001)
383
50 100 150 200 250 300
1 2 3 4
In
te
rn
o
d
e
fa
il
u
re
m
o
m
en
t
(N
m
m
)
[image:17.595.104.428.74.354.2]384
Fig. 6Surface root dry weight per plant plotted against root plate spread of 27 spring wheat genotypes.
385
Parallel model for (♦) 2012 experiment (y = 0.038x + 24.7) and (○) 2013 experiment (y = 0.038x + 35.6);
386
R2= 0.74; P < 0.001). Expreiment (×) 2011 showed a regression line of y = 0.011x + 28.8 with an R2of
387
0.18 (P< 0.05)
388
Experiments in 2013 and 2014 included a screening of five genotypes which were evaluated for
389
internode failure moment with and without the leaf sheath. Analysis of variance showed that removing the
390
leaf sheath significantly reduced the internode failure moment by 8 N mm, 23 N mm, 32 N mm, 31 N mm
391
and 47 N mm for internodes 1, 2, 3, 4 and 5, respectively (4, 12, 19, 19 and 34%, respectively). This
392
variation was statistically significant (P< 0.05) for internodes 2 (SED = 5.55), 3 (SED = 4.97), 4 (SED =
393
4.81) and 5 (SED = 4.38). Differences between cultivars were found for all internodes (SED 7.94,P<
394
0.001) and there were no significant interactions between cultivar and leaf sheath treatments.
395
Quantifying stem and root biomass requirements of a lodging-proof wheat crop
396
The amount of structural stem and surface root dry matter required to resist lodging for a range of crop
397
types and lodging return periods are described in Fig. 7. The structural stem biomass required to achieve
398
specified lodging return periods was first estimated for each individual internode using the empirical
399
equationy= 103x – 16.8 from Fig. 6 for 2011-14 data, where the “y” value was the leverage exerted at the
400
25 30 35 40 45 50 55
0 100 200 300 400 500 600 700
R
o
o
t
p
la
te
sp
re
ad
(m
m
)
[image:18.595.108.393.89.330.2]base of each internode and the “x” value was the structural dry weight per unit length. The structural dry
401
weight of each internode was calculated by multiplying the dry weight per unit length by the internode
402
length. The structural dry weight of the whole stem was calculated by summing the dry weights of all five
403
individual internodes. The target structural stem biomass ranged from 2.78 t ha-1for a 0.7 m tall crop
404
yielding 6 t ha-1with a lodging return period of 5 years to 10.1 t ha-1for a 1.0 m tall crop yielding 10 t ha-1
405
with a lodging return period of 25 years. Root biomass was estimated by first calculating the root plate
406
spread required to withstand the wind induced plant leverage, then using empirical equationy= 0.038x +
407
30.2 from Fig. 6 for 2012-13 data, where the “y” value is the root plate spread and the “x” value is the
408
surface root biomass per plant. The target root biomass ranged from 0.69 t ha-1for a 0.7 m tall crop yielding
409
6 t ha-1with a lodging return period of 5 years to 1.68 t ha-1for a 1.0 m tall crop yielding 10 t ha-1with a
410
lodging return period of 25 years.
411
412
Fig. 7Stem (a) and root dry weight (b) for a crop yielding 6 t ha-1 with a crop height of 1.0 m (♦) and 0.7 m
413
(○), and crop yielding 10 t ha-1 with a crop height of 1.0 m (◊) and 0.7 m (●), for different lodging return
414
periods in the NWM environment. Dotted line indicates a NWM wheat crop with current average yield of 6
415
t ha-1and putative minimum crop height compatible with this yield of 0.7 m
416
Applicability of the lodging model
417
The winter wheat lodging model has demonstrated significant accuracy to predict timing and amount of
418
lodging (Berry et al. 2003b). However, its applicability for spring wheat has not been tested. The
419
experiment of 2011 experienced enough natural lodging to test the lodging model developed for spring
420
0 1 2 3 4 5 6 7 8 9 10 110 10 20 30
Lodging return period
S te m d ry w ei g h t (t h a -1)
a
0.4 0.6 0.8 1.0 1.2 1.4 1.6 1.80 10 20 30
Lodging return period
[image:19.595.91.510.334.548.2]wheat by comparing the severity of natural lodging against the predicted lodging risk calculated by the
421
model. An index for natural lodging for each cultivar was calculated by summing the percentage of lodged
422
area (recorded once or twice a week during the lodging period) between the first occurrence and harvest.
423
The model predicted lodging susceptibility was calculated by inputting the values of the lodging-associated
424
characters into the model and calculating the mean value of the stem and root failure wind speed which
425
ranged 7.6 to 11.7 m s-1. Lodging occurred during early to mid-grain filling on 35 cultivars whereas 28 were
426
predicted by the model; lodging was absent in 25 genotypes and 12 were predicted by the model.
427
Considering this, from the total of 60 cultivars the model correctly predicted 40 genotypes for either
428
absence or presence of lodging giving a percentage of correct predictions of 67 %. Figure 8 is showing a
429
reasonable correlation between observed and predicted rankings for cultivar lodging resistance.
430
431
Fig. 8Predicted and experimental ranking of spring cultivars for lodging susceptibility under NWM
432
environment during 2011. Ranking is in ascending order. (─) 1:1 line. Best fit line, y = 0.60x + 6.52;
433
R2=0.35 (P< 0.001)
434
Discussion
435
Comparison of results with published literature
436
Wind speed analysis for NWM environment has demonstrated that spring wheat growing in these
437
conditions must withstand 22 m s-1and 18 m s-1to resist stem and root lodging, respectively. This indicates
438
0
5
10
15
20
25
30
35
0
5
10
15
20
25
30
35
Experimental ranking
M
o
d
el
ra
n
k
in
[image:20.595.103.394.322.562.2]that spring wheat will require stronger stems than UK winter wheat (18 m s-1for stem and root lodging risk)
439
(Berry et al. 2007) and similar anchorage strength to support plants with the same height and yield and have
440
lodging only once in 25 years. However, several differences between spring and winter wheat types must
441
also be considered. It has been found that for a height at centre of gravity of 0.5 m spring wheat had a
442
greater natural frequency of 1.5 Hz compared with about 1.0 Hz for winter wheat (Berry et al., 2004).
443
Typical ear area for spring wheat averaged about 19 cm2compared with 12 cm2for winter wheat with
444
slightly greater yield and similar ears m-2. It is likely that the absence of awns on UK winter wheat explains
445
at least part of this difference. Overall these differences mean that spring wheat will have a greater leverage
446
than winter wheat for crops with the same height, yield and ears m-2(spring wheat = 383 N mm; winter
447
wheat = 297 N mm).
448
Stem failure moment values for the bottom internode ranged from 134 to 252 N mm (Table 4). These
449
values are higher than the range of the stem failure moment measured in cultivar trials carried out on winter
450
wheat in the UK which ranged from 122 to 230 N mm (Berry et al 2003b; Berry et al 2007). This study has
451
shown a strong relationship between stem strength and structural stem biomass and between anchorage
452
strength and surface root biomass. If there is limited scope to reduce lodging risk by further shortening
453
crops then stem strength and anchorage strength will need to be increased, and this may have a substantial
454
biomass cost that will compete against grain yield formation. A previous study on winter wheat (Berry et al.
455
2007) estimated that a stem dry weight per unit length of 1.65 mg mm-1was required to achieve a stem
456
strength of 100 N mm. However, the estimated biomass required for stem strength included both structural
457
and water soluble carbohydrate (WSC) and may therefore have over-estimated the amount of structural
458
stem biomass required for stem strength. In the present study, WSC content was not related to the stem
459
strength whereas structural biomass (composed mostly of lignin, cellulose and hemicellulose) was strongly
460
and positively associated with the stem strength. Knapp et al (1987) stated that lodging could be not related
461
to fluctuations in WSC and structural carbohydrates content. On the other hand, Ma (2009) found the wheat
462
gene TaCM (involved in lignin biosynthesis) was associated with stem strength and lodging index and
463
Wiersma et al (2011) found a positive association between lodging resistance and acid detergent lignin
464
(ADL) whilst Wang et al (2012) proposed that cellulose plays an important role in the ability of wheat
465
stems to resist lodging. There is therefore little evidence to suggest that WSC contributes to stem strength.
466
The present study measured that 1.13 mg mm-1of structural biomass is required to achieve a stem strength
467
of 100 N mm. If it is assumed that spring and winter wheat have similar stem biomass/strength properties,
then this indicates that the study of Berry et al (2007) may have over-estimated the stem biomass required
469
to achieve specific strength targets by 40 – 50%.
470
Root biomass per plant in the top 10 cm of soil ranged from about 200 to 500 mg per plant and a root
471
plate spread of 30 to 55 mm. This is within a similar range to a study carried out in the UK which observed
472
a surface root biomass of 100 to 400 mg per plant and a root plate spread of 25 to 45 mm. Both studies had
473
similar plant populations of close to 160 – 180 plants m-2. This study has shown that breeding for a wider
474
root plate will require greater investment in root biomass in the top 10 cm of soil. In order to increase root
475
plate spread by 10 mm an additional 263 mg of surface root biomass per plant was required. For the average
476
plant population (estimated at 163 plants m-2), this equates to an additional surface root biomass of
477
approximately 0.43 t ha-1to increase root plate spread by 10 mm. This compares with a winter wheat study
478
carried out in the UK which, for a single field experiment, estimated an additional 0.28 t ha-1of surface root
479
dry matter to increase the spread of the root plate by 10 mm (Berry et al., 2007). This comparison indicates
480
that spring wheat grown in NWM environment may require a greater investment in additional surface root
481
biomass to widen its root plate than winter wheat grown in the UK. This can be a consequence of
482
differences in specific root weight (dry weight per unit length) relating to ‘root thickness’ between UK
483
winter and NWM spring wheat (unfortunately not measured for the latter). Variation in root biomass has
484
been found to be a consequence of secondary thickening of the upper parts of roots(Berry et al., 2007).
485
Implications of achieving a lodging-proof plant
486
It has been estimated that to achieve a 1 in 25 year lodging return period for a typical spring wheat crop
487
grown in the NWM environment yielding 6 t ha-1(at 12% moisture) with a height of 0.7 m will require
488
approximately 3.93 t ha-1of structural stem biomass. Unpublished data from experiments described in this
489
study in 2011-13 shows that on average an additional 0.80 t ha-1of biomass is required for the leaf lamina
490
and sheath, and the chaff to grain dry weight ratio of 0.22 (Piñera-Chavez et al., 2016) gives a chaff dry
491
weight of 1.16 t ha-1. This gives a total non-grain biomass of 5.89 t ha-1. Straw yields of up to 6 t ha-1or just
492
over 6 t ha-1have been observed in NWM (Piñera-Chavez et al., 2016). This ideotype would require a
493
surface root biomass of approximately 1.10 t ha-1which was not been achieved by any cultivar in this study.
494
It therefore appears that for this ideotype it should be possible to achieve stem biomass requirements but not
495
root biomass requirements with current germplasm. The NWM environment can support greater yield than
496
the average 6 t ha-1currently achieved and could be up to 9 t ha-1(Fischer and Edmeades, 2010). It is
497
estimated that cultivars yielding 10 t ha-1(with a height of 0.7 m) will require greater above-ground
grain biomass equating to 4.67 t ha-1(assuming no change in leaf and leaf sheath) and 1.28 t ha-1of surface
499
root biomass to achieve a lodging return period of 25 years. It should further be recognised that the
500
breeding program at CIMMYT has increased the plant height of wheat to 1.0 m or above in the period of
501
1966 to 2009 (Aisawi et al. 2015), where the raised bed planting system may favour taller crops better at
502
capturing the light in the gaps between the beds early in the season (Fischer et al. 2005). In the UK, Berry et
503
al (2014) has shown that breeders have not shortened varieties since the 1990s. This indicates that achieving
504
a high yield and a short (0.7 m tall) crop may be challenging. If a yield of 10 t ha-1can only be achieved
505
with a 1.0 m tall crop, then the above-ground non-grain biomass requirement increases to 10.1 t ha-1and the
506
surface root biomass to 1.68 t ha-1. These biomass requirements will be very challenging to meet and
507
illustrate that breeders must breed not only for greater total biomass, but also this biomass must be
508
optimised carefully to maximise strength per unit of biomass. Certainly, it will be possible to increase total
509
biomass as shown in the UK (Shearman et al., 2005) and in NWM (Aisawi et al. 2015). Recently, several
510
studies have identified QTLs that could be used to increase both yield and straw biomass (above-ground
511
biomass) in wheat (Berry et al., 2008; Li et al., 2014; Xu et al., 2014). Other cereals such as rice have also
512
shown QTLs related to both yield and straw biomass (Suji et al., 2012). Optimising how the additional dry
513
matter is partitioned to maximise its usefulness will be very important. Targets for improving the efficiency
514
with which non-grain biomass is used include; maximising stem strength per unit of stem biomass,
515
maximising grain weight to ear weight ratio, minimising the production of infertile tillers and achieving
516
high yields with shorter crops. Breeding for wider stems seems to be the most efficient way to increase the
517
stem strength which together with a reduced leverage given by a shorter plant represents a strategic option
518
to minimise structural biomass requirements. Additionally, breeding for more compact ears (unawned) in
519
spring wheat could further reduce this leverage and consequently reducing more the biomass requirements.
520
However, careful must be taken because awned ears have been related to drought and heat resistance
521
(Blum, 1986).
522
Dry matter harvest indices for these lodging proof ideotypes equate to 0.46 for a 0.7 m tall crop yielding
523
6 t ha-1, 0.54 for a 0.7 m tall crop yielding 10 t ha-1and 0.41 for a 1.0 m tall crop yielding 10 t ha-1. These
524
figures are some way below the estimated potential harvest index for wheat of 0.62 (Austin, 1980). Winter
525
wheat grown in the UK with a yield of 8 t ha-1and height of 0.7 m was estimated to have a harvest index of
526
0.42 (Berry et al., 2007). However, it is likely that this study over-estimated the stem biomass requirement
527
by including water soluble stem carbohydrate in the stem biomass measurements. If the same relationship
between stem failure and structural stem weight observed for this present study for spring wheat is used for
529
winter wheat, and a leaf and leaf sheath biomass of 1.0 t ha-1is included, then this gives a harvest index of
530
0.49. The relatively high levels of non-grain biomass and low harvest indices that are estimated to result
531
from breeding crops with a lodging return period of 25 years suggest that the high investment in non-grain
532
biomass may compete with yield formation and limit the rate of breeding improvement in grain yield. This
533
potential trade-off arises from the overlapping of the development periods of lodging traits and key
yield-534
determining processes such as floret development and production of water soluble reserves. In fact, Slafer
535
and Rawson (1994) stated that all the processes included from GS30 to GS60 (Zadoks et al., 1974) are
536
considered of major importance for yield construction. Crook et al. (1994) described the development of the
537
lodging characters (stem and root strength) from tillering (GS20) until maturity (GS87) and concluded that
538
these traits cessed develop soon after anthesis (GS65). There may be a net yield benefit from accepting a
539
shorter lodging return period, since the advantage of lower non-grain biomass investment on yield potential
540
may outweigh yield losses from more frequent lodging. If the lodging return period is reduced from 25
541
years to 10 years then the harvest index increases from 0.46 to 0.51 for a crop yielding 6 t ha-1with height
542
of 0.7 m, increases from 0.54 to 0.58 for a 0.7 m tall crop yielding 10 t ha-1, and increases from 0.41 to 0.46
543
for a 1.0 m tall crop yielding 10 t ha-1.
544
This paper showed a significant effect of the leaf sheath on the stem strength measured 20 days after
545
GS65 on internodes 2 to 5 (peduncle) where the presence of the leaf sheath increased stem strength by 12%
546
for internode 2 to an increase of 34% on the peduncle. The effect on internode 1 was not significant because
547
the leaf sheath was mostly senesced or not present at GS65 + 20 d. The leaf sheath has been reported to
548
have an important mechanical role ensuring the plant standing ability in other species including;
549
Arundinaria tecta(Poaceae) (Niklas, 1998), Poa araratica,Bromus erectus,Arrhenatherum elatius
550
(Poacea),Luzula nivea(Juncaceae),Carex arctata(Cyperaceae) (Kempe et al. 2013) andTriticale
551
(Zebrowski, 1992). These findings indicate that leaf sheath is a mechanical component of the stem
552
especially soon after flowering, however, its effects will diminish as the crop matures as the leaf sheath
553
dries and eventually falls off. This study has estimated the structural requirements to avoid lodging for a
554
plant at harvest without leaf-sheaths surrounding the internodes. This approach is appropriate for plants at
555
harvest and is likely to be appropriate during a few weeks prior to harvest for the lower internodes, which
556
most commonly buckle, and whose leaf-sheaths senesce first. However, it will probably over-estimate the
557
stem strength required to avoid lodging at earlier growth stages (e.g. at flowering) because the contribution
of the leaf sheath is not included. Further work is required to quantify how the contribution of the
leaf-559
sheath to the strength of each internode diminishes as the plant develops so that the minimum strength of
560
the true stem required for various lodging return periods can be modelled more accurately.
561
NWM spring wheat lodging ideotype trait values for a typical yield crop with a 25 year return period
562
differ from the equivalent UK winter wheat lodging ideotype values as follows; spring wheat requires a
563
10% smaller root plate and a 7% stronger stem strength. Rainfall is practically absent during the lodging
564
risk period in the NWM environment and water supply has to be provided by periodic irrigation. This
565
condition reduces the root lodging risk period to 10 days of grain filling period which, in turn, reduces the
566
maximum wind gust speed required to withstand root lodging. Drier, but windier, conditions in NWM
567
compared with the UK mean that both spring and winter wheat ideotypes must withstand the same
568
maximum wind gust speed (18 m s-1) for a 25-year root lodging return period; however, yield of 8 t ha-1for
569
the UK ideotype compared with 6 t ha-1for NWM contribute to the greater root plate spread required by the
570
UK ideotype. The greater stem strength requirement for spring wheat is mainly due to a higher maximum
571
wind gust speed on the NWM environment (22 m s-1) and the greater ear area of spring wheat.
572
The genetic ranges for the key lodging traits are described in Table 4 and in companion paper
(Piñera-573
Chavez et al., 2016). This shows that it should be possible for plant breeders to achieve some of the
574
ideotype dimensions for a spring wheat crop yielding 6 t ha-1with height of 0.7 m. Nevertheless, if it is
575
assumed that yield will increase in the following decades then the biophysical targets will increase. For
576
example, if yield is increased to 10 t ha-1then the stem diameter will increase by 8%, root plate spread by
577
6% and stem strength by 18%. In this case it would be unlikely that plant breeders could achieve a lodging
578
proof plant with a lodging return period of 25 years with current germplasm. Our analysis also showed that
579
the target dimensions will be further increased if yield improvements must also be accompanied by crop
580
heights of more than 0.7 m.
[image:25.595.67.531.633.739.2]581
Table 4Spring wheat genotypic range for the lodging key traits (Piñera-Chavez et al., 2016)
582
Trait Genetic range
Diameter (mm) 3.35 – 4.47
Wall width (mm) 0.64 – 0.92
Internode failure moment (stem strength) (N mm) 134 – 252
Material strength (MPa) 27.4 – 59.4
Root plate spread (mm) 34 – 42
Height (m) 0.73 – 1.07
*Lodging probability of 1 in 25 years, 200 plants m-2, 500 shoots m-2and grain yield of 6 t ha-1
583
Conclusion