ASEAN FREE TRADE AREA (AFTA): HOW FAR HAVE WE COME? ANALYSIS AND EVIDENCE ON EFFECTS OF AFTA
Orachat Niyomsuk
A Thesis Submitted for the Degree of PhD at the
University of St Andrews
2013
Full metadata for this item is available in Research@StAndrews:FullText
at:
http://research-repository.st-andrews.ac.uk/
Please use this identifier to cite or link to this item:
http://hdl.handle.net/10023/4475
ASEAN Free Trade Area (AFTA): How Far Have We Come?
Analysis and Evidence on Effects of AFTA
Orachat Niyomsuk
This thesis is submitted in partial fulfilment for the degree of
Doctor of Philosophy in Economics
University of St Andrews
1. Candidate’s declarations:
I,Orachat Niyomsuk, hereby certify that this thesis, which is approximately 80,000 words in length, has been written by me, that it is the record of work carried out by me and that it has not been submitted in any previous application for a higher degree.
I was admitted as a research student in [April, 2009] and as a candidate for the degree of PhD in Economics in [April, 2009]; the higher study for which this is a record was carried out in the University of St Andrews between [2009] and [2013].
(If you received assistance in writing from anyone other than your supervisor/s):
I, Orachat Niyomsuk., received assistance in the writing of this thesis in respect of [language, grammar, spelling or syntax], which was provided by Ruth Masson
Date …./10/2013…… signature of candidate ………
2. Supervisor’s declaration:
I hereby certify that the candidate has fulfilled the conditions of the Resolution and Regulations appropriate for the degree of…PhD in Economics ..in the University of St Andrews and that the candidate is qualified to submit this thesis in application for that degree.
Date …… signature of supervisor ………
3. Permission for electronic publication: (to be signed by both candidate and supervisor)
In submitting this thesis to the University of St Andrews I understand that I am giving permission for it to be made available for use in accordance with the regulations of the University Library for the time being in force, subject to any copyright vested in the work not being affected thereby. I also
understand that the title and the abstract will be published, and that a copy of the work may be made and supplied to any bona fide library or research worker, that my thesis will be electronically
accessible for personal or research use unless exempt by award of an embargo as requested below, and that the library has the right to migrate my thesis into new electronic forms as required to ensure continued access to the thesis. I have obtained any third-party copyright permissions that may be required in order to allow such access and migration, or have requested the appropriate embargo below.
The following is an agreed request by candidate and supervisor regarding the electronic publication of this thesis:
Add one of the following options:
(i) Access to printed copy and electronic publication of thesis through the University of St Andrews.
Date ... signature of candidate ... signature of supervisor ...
ii Abstract
This thesis addresses issues concerning trade effects of a particular RTA: AFTA. In the first part of the thesis, 2 different but related gravity frameworks are constructed as to evaluate the independent effects of AFTA on relevant countries’ trade flows. The first
paper proposes examining ‘AFTA-effects’ on members’ trade, specifically within the AFTA context. This aims to distinguish trade effects that AFTA has had on early and delayed members’ trading patterns. The panel ‘Gravity Model’ is constructed, pointing
to control for several biases commonly observed in the cross-section model. Although the result implies that early members do share trade benefits from AFTA more than non-members, the overall ‘AFTA-effects’ on the membership’s trade have not been benign. Another paper measures ‘AFTA-effects’ on both members’ and non-members’ trade. This aims to assess whether AFTA has played a role as an export base for the international market. In this case, ‘AFTA-effects’ appeared positive. Such effects are driven by an enhancement in extra-export bias, suggesting that the membership’s exports to outside destinations have increased post-AFTA. The last paper provides a theoretical framework addressing the incidence of RTA-membership expansion. The fact that AFTA was gradually established and empirical results indicating AFTA’s impacts on members and non-members brings about the idea that bloc-membership expansion could plausibly be explained by the economic effects that these countries have received. The corollaries of trading with/without RTA-membership of a potential member’s gains of trade and welfare levels are related to the decision towards
iii
iv
Acknowledgements
Writing this thesis has been a great challenge for me. Without the help of many people, this piece of work may have not been put into completion. I feel very grateful for all kinds of help that have been given to me.
First, I would like to thank Professor David Ulph for accepting me as his student. I deeply appreciate his confidence in my ability to carry out this research as well as his superb supervision throughout the duration of my study. Sincerely speaking, I will not be able to come this far without his help. My gratitude also goes to Dr. Geetha Selvaretnam and Dr. Jinhyun Lee for sharing their time, providing valuable comments and suggestions. Caroline and Angela also deserve special thanks for providing great secretarial supports and helpful advice in general.
v
Last but not least, I would like to thank my family for their unconditional love, care and encouragement. Thanks for having faith in me.
I am truly grateful for having wonderful people around me all these years. They make me see possibilities in life that I may not have seen on my own.
vi
Table of Contents
List of Tables………..ix
List of Figures………..x
Abbreviations……….xii
Part I: General Information and Related Literature.………..1
1: Information on the Establishment of the ASEAN Free Trade Area (AFTA)………..2
1.1 Historical notes on the formation of ASEAN………..2
1.2 ASEAN-6: key characteristics, economic strength and weaknesses………...4
1.3 ASEAN Preferential Trade Agreement (ASEAN-PTA)………...11
1.4 ASEAN Free Trade Area (AFTA)……….16
1.4.1 Transitional economies: an overview of key characteristics………19
1.4.2 Objectives and main instruments of AFTA………..26
1.5 Organization and scope of the thesis……….32
2: Description of the Model Concept: Theoretical Framework of the ‘Gravity Model’...36
2.1 Introduction………...36
2.2 Origin of the ‘Gravity Model’ in the study of international trade……….45
2.3 The pioneering research: theoretical foundations of the ‘Gravity Model’ of trade...50
vii
Part II: Empirical Analysis………...63
3: Regionalism With (Without) Regionalization? : The ‘Gravity Model’ as an Empirical Tool to Assess ‘AFTA-Effects’ on Intra-ASEAN Trade………64
3.1 Introduction………...64
3.2 Related literature………67
3.3 Conceptual frameworks to investigate trade effects of AFTA or the so-called ‘AFTA-effects’…………...……….75
3.4 Econometric concepts and methodologies.………...81
3.5 An empirical strategy proposed to evaluate ‘AFTA-effects’ on intra-ASEAN trade...92
3.5.1 Variables and data sources………...92
3.5.2 Methodological and modelling issues………..96
3.5.3 Empirical results……….107
3.6 Extending the test to focus on trade with CLMV countries: evidence on trade creation and trade diversion effects of AFTA………121
3.7 Conclusion………...131
4: The So-Called ‘Gravity Framework’ Revisited: ASEAN’s Major Trading Partner and Trade Effects of AFTA on Intra-ASEAN and Extra-ASEAN Trade Flow….134 4.1 Introduction……….134
4.2 Related literature………..140
4.3 Empirical approaches to assess trade effects of AFTA on intra-ASEAN and extra-ASEAN trade flows……….149
viii
4.3.2 Methodologies and modelling issues………...163
4.3.3 Empirical results………..167
4.4 Conclusion………...193
Part III: Theoretical Analysis……….196
5: On the course of RTA Expansion: Implications from the Gains from Trade and Welfare Effects………..197
5.1 Introduction……….197
5.2 Related literature………...199
5.2.1 Intuitive accounts………...199
5.2.2 Theoretical accounts………...205
5.2.3 Empirical accounts……….212
5.3 Theoretical frameworks………..216
5.3.1 The model………..217
5.3.2 An extension of the model: asymmetric tariffs……….232
5.4 Conclusion………...269
6.Concluding Remarks………....274
Appendices ………..281
ix List of Tables
Table 1.1: Utilization of Preferential Trading Arrangements in 1987………16
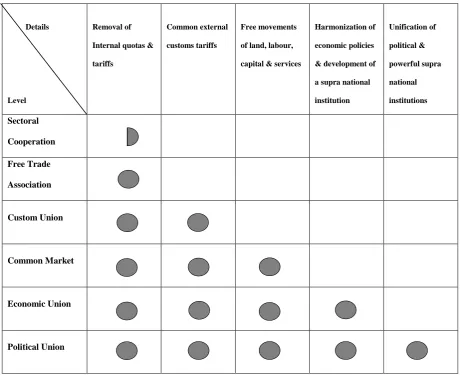
Table 3.1: Different Levels of Regional Integration………...78
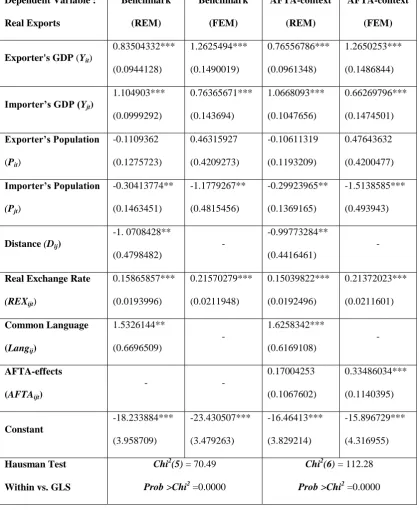
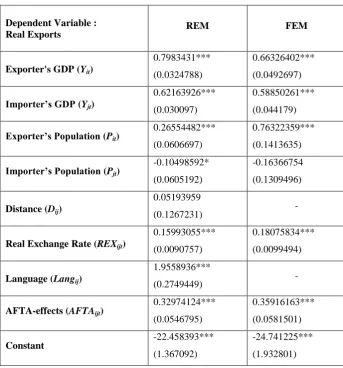
Table 3.2: Benchmark Results of the ‘Gravity Model’ Estimates: the Random Effects Model (REM) versus the Fixed Effects Model (FEM)………108
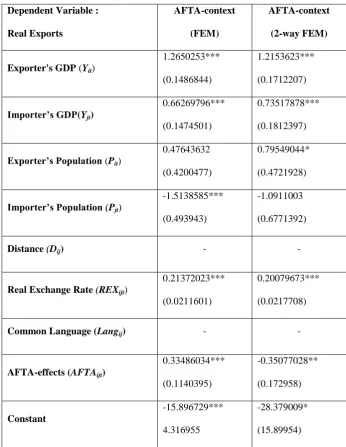
Table 3.3: Results of the ‘Gravity Model’ Estimates: the Fixed Effects Model (FEM) and the Two-Way Fixed Effects Model (2-Way FEM)………...113
Table 3.4: Results of the ‘Gravity Model’ Estimates: All Specifications of the
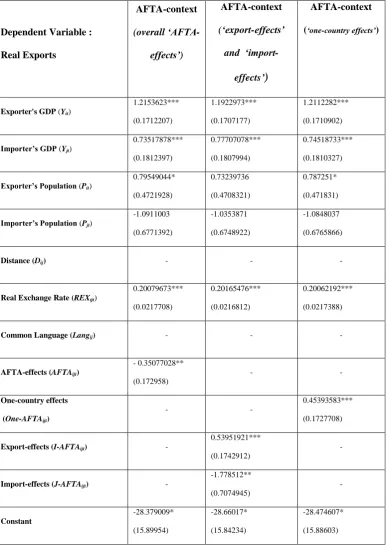
Two-Way Fixed Effects Model (2-Way FEM)………127
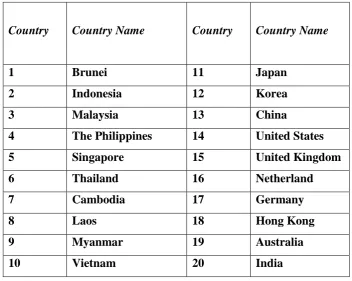
Table 4.1: The List of Countries Included in the Gravitational Framework………….162
Table 4.2: Results of the ‘Gravity Model’ Estimates: the Random Effects Model (REM) versus the Fixed Effects Model (FEM)………...168
Table 4.3: Results of the ‘Gravity Model’ Estimates: the Fixed Effects Model (FEM) and the Two-Way Fixed Effects Model (2-Way FEM)………..174
x
List of Figures
Figure 3.1: Comparison of the Year of Entry into the Free Trade Zone by
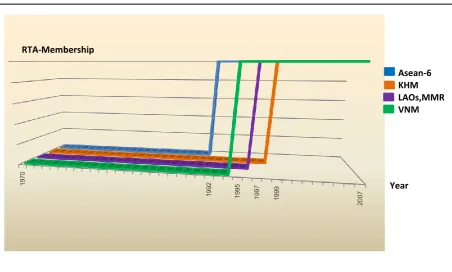
Each ASEAN Member ………76
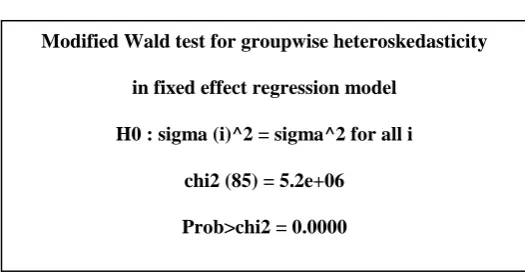
Figure 3.2: Results of the Heteroskedasticity Test in the Two-Way Fixed Effects Model. ………117
Figure 3.3: The Scatter Plot of the 2-WayFEM’s Residuals by Trade-pairs……...…..118
Figure 3.4: The Estimation of the ‘Gravity Model’ for Intra-ASEAN Trade Flows ; Represented by Trade-pairs………...120
Figure 4.1: The Hausman Test Comparing the Estimates from the REM and the FEM ………169
Figure 4.2: The Scatter Plot of the 2-Way FEM’s Residuals by Trade-pairs…………185
Figure 4.3: Results of the Heteroskedasticity Test in the Two-Way Fixed Effects Model. ………186 Figure 4.4 : The Estimation of the ‘Gravity Model’ for Intra-ASEAN and Extra-ASEAN Trade Flows; Represented by Trade-Pairs (1-100 Trade-Pairs)...………...188
Figure 4.5: The Estimation of the ‘Gravity Model’ for Intra-ASEAN and Extra-ASEAN Trade Flows; Represented by Trade-Pairs (101-200 Trade-Pairs)…...189
xi
Figure 4.7: The Estimation of the ‘Gravity Model’ for Intra-ASEAN and Extra-ASEAN Trade Flows; Represented by Trade-Pairs (301-380 Trade-Pairs)………..191
Figure 5.1: The Framework Illustrates the Scenario in which All Countries Trade
Post-RTA……… ………236
Figure 5.2: The Framework Illustrates the Scenario in which Country a Joins the
Existing RTA.……….237
Figure 5.3: The Framework Illustrates the Scenario in which Country a Joins the
Existing RTA………...250
Figure 5.4: The Framework Illustrates the Scenario in which Country b Joins the Existing RTA ……….250
Figure 5.5: The Framework Illustrates the Scenario in which Country a is Asked to Set the Import Tariffs at tw………...258
xii Abbreviations
2SLS Two-Stage Least-Squares 2way-FEM 2-Way Fixed Effects Model AEC ASEAN Economic Ministry AEM ASEAN Economic Minister AFM ASEAN Foreign Minister AFTA ASEAN Free Trade Area
AIJVS ASEAN Industrial Joint Ventures ANDEAN The Andean Community
ANZCER Australia-New Zealand Closer Economic Relations Agreement APEC Asia-Pacific Economic Cooperation
ASEAN The Associations of Southeast Asian Nations ASEAN-PTA The ASEAN Preferential Trade Agreements ATIGA ASEAN Trade in Goods Agreement
BBC The Brand to Brand Complementation BLUE The Belgium-Luxembourg Economic Union CACM Central American Common Market
CARICOM The Caribbean Community
CEECs Central and Eastern European Countries CEPT The Common Effective Preferential Tariff CGE The Computable General Equilibrium Model CLMV Cambodia, Laos, Myanmar and Vietnam
xiii
CUSTA The U.S-Canada Free Trade Agreement EAC The East African Trade Cooperation EAEC The East Asia Economic Caucus
EC The European Commission
EEC The European Economic Community EFTA The European Free Trade Association ERS The Economic Research Service
EU The European Union
FDI Foreign Direct Investment FEM Fixed Effects Model
G20 The Group of Twenty Finance Ministers and Central Bank Governors
GATT The General Agreement on Tariffs and Trade GCC The Gulf Co-operation Council
GDP Gross Domestic Product
GDP(PPP) Gross Domestic Product (based on the Purchasing Power Parity) GE General Exclusion List
GLS General Least Squares
HS Harmonized System Code
HT The Hausman Taylor Estimator
IL Inclusion List
xiv
MOP Margin of Preference
NAFTA The North American Free Trade Agreement NLD The National League for Democracy
OECD The Organization for Economic Co-operation and Development OLS Ordinary Least Squares
PTA Preferential Trading Agreements REM Random Effects Model
ROO Rule of Origin
RTA(s) Regional Trade Agreement(s)
SAARC The South Asian Association for Regional Cooperation
SL Sensitive List
SLORC The State Law and Order Restoration Council TEL Temporary Exclusion List
TSP Time Series Processor
UAPs Unprocessed Agricultural Products
UN The United Nations
2
1: Information on the Establishment of the ASEAN Free Trade Area (AFTA)
1.1 Historical notes on the formation of ASEAN
On 8th August 19671, the Association of Southeast Asian Nations or the so-called ASEAN was formed. This was a product of a joint effort and mutual agreement between 5 members: Indonesia, Malaysia, the Philippines, Singapore and Thailand. Brunei joined the group later in 1984 and together they were known as the original ASEAN-6 since, as far as objectives of establishing the regional formation are concerned, ASEAN can be perceived to enhance the region’s political security as well as integrating closer economic cooperation. On the subject of an evolution of ASEAN cooperation,Tongzon (2002) summarized influential forces driving an ASEAN formation as:
All the signatory countries saw the need to foster their economic development and promote regional security in the face of a growing communist threat in Southeast Asia, precipitated by the fall of IndoChina to communism and the declared intention of the West to withdraw their military forces from the region (Tongzon, 2002, p.5).
Basically, ASEAN member states perceived regionalism2 not only as a means to promote regional identity, but also as a shortcut to strengthen nation building processes since at that period the Communist influence was widespread across the region (Frost, 2008, p. 28). Even though politics had been a major component of this regional
1 It is the Bangkok Declaration Meeting.
2 In this paper, regionalism is defined as a political process whereby a group of countries agree to reduce
3
formation, according to the statements of the Bangkok Declaration3, ASEAN was, however, far from being a purely political assembly. On the contrary, creating formal regional integration as well as cultivating developments in economic, social and cultural arenas were fundamental areas for ASEAN members. According to the contents stated in the first ASEAN Declaration: the Bangkok Declaration, on 8th August 1967, membership countries declared that:
FIRST, the establishment of an Association for Regional Cooperation among the countries of South-East Asia to be known as the Association of South-East Asian Nations (ASEAN).
SECOND, that the aims and purposes of the Association shall be:
1. To accelerate the economic growth, social progress and cultural development in the region through joint endeavours in the spirit of equality and partnership in order to strengthen the foundation for a prosperous and peaceful community of South-East Asian Nations (“The ASEAN Declaration (Bangkok Declaration) Bangkok,” 1967, para. 2).
Despite this far-sighted preparation, it had been a long journey for ASEAN members to attain, if not to establish proper practices for regional formation. This is because, not only are historical and cultural grounds different across membership countries but, the members also vary greatly in terms of social and economic developments. Furthermore, at the early stage of this regional formation, membership countries encountered a series of post-independence problems: ethnic conflicts, communist insurgencies as well as political instability, which had been widespread across the region. It can be understood why during the early years of the ASEAN, each member state’s priorities had shifted, aiming to solve internal conflicts and planning for each member’s own domestic needs
3 The Bangkok Declaration is the founding document of the Association of Southeast Asian Nations . It is
4
instead of pursuing regional objectives. For these reasons, preparations to promote economic developments at the regional level were undoubtedly delayed and distressed.
Before proceeding further, the following section briefly highlights key common characteristics as well as economic strengths and weaknesses of ASEAN-6 as they are regarded as AFTA founders. These countries are, in addition, major economies in ASEAN, therefore it is adequate to provide an overview of the ASEAN economies en
masse. This piece of information is important for anyone who is interested in the setting
of each ASEAN member before the most concrete form of ASEAN economic corporation: the ASEAN Free Trade Area (AFTA) was officially instituted in 1992.
1.2 ASEAN-6: key characteristics, economic strengths and weaknesses
Indonesia (Republic of Indonesia)
Indonesia is an archipelagic state comprised of 17,508 islands which was colonized by the Netherlands in the early 17th Century. During World War II, Japan invaded the country and eventually took control over the land for a short period: 1942-1945. The country managed to declare independence soon after Japan surrendered on 17th August 19454.
Indonesia has the 16th largest land area of all the countries in the world at 1,919,440 square kilometres (741,050 sq mi). Having a population of 237.6 million5, it is in fact the world’s largest archipelago in terms of population. It is also the world’s
5
largest Muslim country, and ranks 4th as the most populous democratic country6 in the world. Given this size and being an archipelagic state, the country stumbled upon severe ethnic and political instability problems. In fact, these problems still exist in some parts of the country to this day.
Regarding economic conditions, Indonesia is the only country in ASEAN that has acquired the G207membership status. This signifies the importance of Indonesia’s economy at the global scale. In 2010, it was ranked by WTO as theworld’s 27th biggest exporting country. Besides large and fertile land areas as aforementioned, the country is rich in mineral resources such as petroleum, natural gas, tin, nickel, copper and bauxite. These resources have mainly been industrialized and have become one of the major sectors of export. Other important industries are textiles, apparels, footwear, foods and chemical fertilizers as well as tourism. Because of an abundant labour supply, cheap labour costs have become the country’s key comparative advantage in expanding the diversification of the economy. Nonetheless, the Indonesian economy still relies heavily on its large domestic market. The unemployment rate is still high at approximately 7.9 %8.
Malaysia
On 31st August 1957, the federation of Malaya which was colonized by the British during the late 18th - 19th Centuries announced her independence. Similar to Indonesia, the area was occupied by Japan during the World War II period; 1942-1945. The federation of Malaya together with Singapore, Sarawak and Sabah later formed a new
6 CIA-The World Factbook. (2010).Retrieved 2010, from
https://www.cia.gov/library/publications/the-world-factbook/geos/id.html
7 G-20 is a group of finance ministers and central bank governors from 20 major economies.
8 CIA-The World Factbook. (2010). Retrieved 2010, from
6
country called Malaysia in 1963. Malaysia has an interesting landscape as it is comprised of 2 separate land areas: the Peninsular Malaysia and Malaysian Borneo, which the South China Sea passes between. Having a land area of 329,847 square kilometres (127,350 sq mi), it is regarded as the 66th largest country in the world. In 2010, the country was ranked 43rd as the world’s most populated country with a population of approximately 28 million.
As far as economic strengths and weaknesses are concerned, Malaysia is endowed with natural resources suitable for the mining industry: tin, petroleum, timber, copper, iron ore, and natural gas. The oil and gas industry has been a major source of income for the country as the prices of energy elevated worldwide. In addition, in the mid 1980s, Prime Minister Mahathir9 had success in diversifying the Malaysian economy from being a raw materials producer and exporter to depend more on manufacturing, services and tourism sectors (Tongzon, 1998, p.15). In 2010, the country was ranked as the world’s 29th largest economy in the world with a GDP (PPP) of $414,400 billion10. However, Malaysia has been experiencing severe inequality issues among different ethnic groups, especially between the Chinese-Malay and the Malaysian backgrounds. Such issues are a deep-rooted economic problem for the country. In reality, approximately 70 % of the country's market capitalization is owned by the Chinese-Malay, despite accounting for only a third of the entire population11.
9 His term covers 22 years: from 1981-2003. 10
CIA-The World Factbook. (2011). Retrieved 2011, from https://www.cia.gov/library/publications/the-world-factbook/rankorder/2001rank.html
11 Chau, Amy. (2003). Minority Rule, Majority Hate [Newspaper]. Retrieved 2010, from
7 The Philippines (Republic of the Philippines)
The Philippines was under the Spanish rule during the 16th Century. It was ceded by the United States later in 189812. The country had also gone through Japanese occupation during the World War II period. However, with the help of allied troops, the Philippines fought Japan and managed to declare her independence in 194613.
The Philippines is another country in this region that has an archipelagic nature. Comprised of 7,107 islands with approximately 300,000 square kilometres (120,000 sq mi), the geographical setting has posed difficulties in governing the country in general. Several social as well as economic problems such as inadequate infrastructure, bureaucratic inefficiency, poverty, high unemployment rate14 as well as rapid population growth have been ongoing thus far. With a population of approximately 103,775,00215, it is considered the world’s 12th most populous country. Nevertheless, in 2011, the country managed to be the world’s 33rd largest economy with a gross domestic product (PPP) of approximately $389.8 billion16. Major natural resources are timber, petroleum, nickel, silver, gold, cobalt and copper. As the country is endowed with natural and human resources, these have been perceived as a comparative edge, attracting foreign capital for investment in the manufacturing sector. The country’s major industries are, for example, electronic assembly, garments, footwear, food processing products, pharmaceuticals, as well as petroleum.
12 12 June 1898 (independence proclaimed from the Spain) 13 4 July 1946 was date of independence from the United States 14
As of 2010, the unemployment rate is 7.5 %.
15 CIA-The World Factbook. (2011). Retrieved 2011, from
https://www.cia.gov/library/publications/the-world-factbook/geos/rp.html
8 Thailand (Kingdom of Thailand)
Thailand is the only country in ASEAN that was not empowered officially by any colonial masters. The country was, however, occupied by Japanese in the World War II period (1942-1945). Having a size of approximately 513,000 square kilometres (198,000 sq mi), Thailand is ranked as the world’s 51st largest country in terms of total land area. As there are roughly 64 million people in it, it is considered the world’s 20th most populous country.
Thailand is also considered a resource-rich country, being well-endowed with valuable natural resources such as tin, tungsten, natural gas, as well as tantalum. In fact, the country is the world’s 2nd largest tungsten producer and 3rd largest tin producer17. Nonetheless, the country has been relying on labour-intensive industries covering basic to advanced products. They are, for example, agricultural commodities, textiles, footwear, machinery, electronic equipments, auto parts as well as jewellery. As Thailand has attractive natural landscapes and well-developed tourist attractions, tourism is another major industry for the country.
With regard to economic weaknesses, Thailand has been experiencing poverty and inequality issues as major infrastructure and various forms of development are restricted within urban areas. This consequently results in a population density problem in major developed cities (Tongzon, 1998, p.15). Thailand was hit hard by the 1997 financial crisis which the country did, in fact, start. As the Thai government could not defend the baht against the peg to the US dollar, the Thai currency underwent substantial
17 CIA-The World Factbook. (2011). Retrieved 2011, from
9
depreciation. This currency crisis was turned into a financial crisis as many foreign funds which were invested in Thailand through the short term banking instruments, could not be paid off. Many financial institutions had to call for closure because of insolvency. This crisis had serious contagious effects on other countries. However, Thailand eventually recovered by turning to the IMF for financial assistance.
Singapore (Republic of Singapore)
Singapore was a British trading colony from 1819 to 1942. During World War II, Singapore was occupied by the Japanese and reverted to British rule again after the war. The island became self-governing in 1959. Singapore united with other former British territories nearby to form Malaysia in 1963. In 1965, the country separated from Malaysia and declared independence18.
Singapore is the only country in the region that has no natural resources. In addition, the country is a small island, having a total land area of approximately 704 square kilometres (272 sq mi) only. The population size is also small; there are approximately 5.35 million people in Singapore19. Though high labour and capital costs have limited economic activities, superior infrastructures, efficient bureaucracy and sound economic policies, have made Singapore the richest country in the region. In terms of GDP per capita, the country is ranked as the world’s 5th richest, having a GDP per capita of approximately 59,900US$20 (US$ in 2011 value): even higher than most developed countries. Because of its strategic location as a port, combined with a highly developed free market economy and a well-equipped infrastructure, most of the country’s income
18
It was on 9th August 1965.
19 CIA-The World Factbook. (2011). Retrieved 2011, from
https://www.cia.gov/library/publications/the-world-factbook/geos/sn.html
10
is from trade and services. Moreover, Singapore is considered the 14th largest exporter and 15th largest importer in the world. The country has the highest trade-to-GDP ratio in the world at 407.9 %, emphasizing the importance of trade in this economy. In recent years, Singapore has promoted tourism as well as legalized gambling to attract more visitors. The country, in addition, tries to set up an image of being a pharmaceutical and medical hub of ASEAN.
Brunei (Nation of Brunei, the Abode of Peace)
Brunei was a British colony in 1888. Like others in the region, the Japanese took over the country from 1941-1945 during the World War II period. After that, it was under British administration until the country declared independence in 198421. It is interesting to note that Brunei is comprised of 2 disconnected pieces of land with a total land area of only 5,765 square kilometres (2,226 sq mi).
Brunei is the only country in this region that is largely endowed with oil and natural gas. Forbes ranked Brunei as the 5th richest nation (out of 182 nations) due to its extensive petroleum and natural gas fields22. In fact, oil and natural gas production accounts for more than 90 % of its exports which is also the major source of GDP23. The Brunei government is known to be well-regulated and almost all medical services and education through the university level are subsidized. However, the country has a very limited domestic market due to a population of only 395,02724, of which approximately 150,000 live in the capital Bandar Seri Begawan. High operating costs and a shortage of
21 It was on 1st January 1984.
22 Too, D. (2012). Forbes Ranks Brunei Fifth Richest Nation [Newspaper]. Retrieved 2012, from
http://www.thejakartapost.com/news/2012/02/25/forbes-ranks-brunei-fifth-richest-nation.html
23 CIA-The World Factbook. (2011). Retrieved 2011, from
https://www.cia.gov/library/publications/the-world-factbook/geos/bx.html
11
labour has limited economic activities as well as their expansion. Notwithstanding an attempt to increase agricultural production and to further diversify economic activities beyond oil and gas industries, there has not been a sign of success.
From the brief overviews provided, it can be seen that diverse characteristics as well as distinctive domestic disorders have, undoubtedly, made it difficult for ASEAN countries to arrive at agreements which result in mutual benefits. Besides this, the primary economies of ASEAN-6 countries appear to be competitive rather than complementary as most of them have similar natural resources and rely on intermediate if not basic levels of technological advancements in the manufacturing sector. In fact, several industries have attracted the same sources of foreign direct investments. It is thus not surprising that ASEAN members took nearly a decade to form an official institution and to be granted regional development plans. Although ASEAN countries are different in many aspects, they had managed to put common trust to strengthen economic conditions at the forefront eventually. Indeed, forming a regional agreement was perceived as a vital path towards achieving this goal.
1.3 ASEAN Preferential Trade Agreement (ASEAN-PTA)
12
could then be more direct in aim and agreed upon by the AEM. In consequence, 5 separate economic committees were formed. These are:
The Committee on Trade and Tourism
The Committee on Industry, Minerals and Energy
The Committee on Finance and Banking
The Committee on Food, Agriculture and Forestry
The Committee on Transportation and Communications
Notwithstanding the fact that the region had imposed multi-channelled economic development plans, enhancing economic performance via trade and industry were put forth as a top priority. Matters concerning trade promotions, trade liberalization and industrial complementation were emphasized25. The region also invested in research and strategic planning with the hope of constructing well-planned paths for regional economic cooperation. ASEAN’s first steps towards trade liberalization worked on implementing preferential trading frameworks (tariff and non-tariff preferences), comprised of long term quantity contracts and preferences in procurement by government entities. As a result, the ASEAN Preferential Trading Arrangement (ASEAN-PTA) was officially formed on 24th February 1977. This ASEAN-PTA was approved by the General Agreement on Tariffs and Trade (GATT). In principle, the ASEAN-PTA worked on granting tariff preferences (the so-called ‘Margin of
Preference’ or ‘MOP’) for imports among ASEAN members. The first batch of 71 trade
25 There were 3 main programmes initially constructed: 1) the Preferential Trading Arrangements (PTA),
13
preferences came into effect on 1st January 1978. By 1981, member countries had managed to increase the number of products offered for tariff preferences to 6,581.
The agreement was, in actual fact, targeted to promote higher levels of intra-ASEAN trade (Tongzon, 2002, p.42). Nevertheless, with other regional groupings such as the European Commission (EC) and the North American Free Trade Agreement (NAFTA), ASEAN members, were concerned by the possibility of losing their bargaining power in the international trading system. ASEAN-PTA could thus be perceived as a counter strategic plan for ASEAN: acting as a safeguard to protect existing trade relations from shocks in global trade regimes. Furthermore, with closer assessment, ASEAN-PTA was viewed as a catalyst promoting closer economic ties among member states. This was aimed at causing domino effects in growth and development in the region as a whole. This point has, in fact, been mentioned by Castro (1980) in the essay on ASEAN economic co-operation that:
It might be said that the ASEAN-PTA was an effort to reverse the declining intra-ASEAN trade. That, however, would be only half true, because the thrust behind the ASEAN-PTA was not to arrest a decline but to promote growth and integration(Castro in R. Garnaut (Ed.), 1980, p.63).
14
bilateral. For the unilateral approach, each country put products onto the tariff reduction list individually. The tariffs offered would, in consequence, be applicable to all membership countries. In the latter approach, member countries were able to request that products be put on the list by another trading partner bilaterally, but this had to wait for another party’s approval. If the trading partner agreed, every member country would also receive the preferential offer on these products. The tariff preference effects would then be multilateral eventually. It can be seen that even though ASEAN-PTA had constructed an approach in which member countries are able to request products to be put onto the list for multilateral acceptance, it seemed that, in general, the majority of products offered for preferences were not produced by any member countries or, in other words, were unavailable in the regional market. Moreover, most of them had given products that have low market value for preference purposes or, sometimes, offered tariff preferences on zero-tariff items. According to Frankel and Wei (1996) which touched upon the historical setting of the ASEAN-PTA, the case in which Indonesia eliminated tariff barriers to the import of snow-removal equipment was referred to as one such example. These sorts of practices had, in consequence, delayed the primary objective of increasing intra-ASEAN trade as each member continued to place individual interests over regional ones. In addition, given that tariff reduction was done product-by-product via consensus format, this was time-consuming since each country had different products to be put on the list. Each country technically granted longer timeframes for important or strategic products to be co-ordinated in the tariff reduction process. Last but not least, the issues concerning rules of origin as well as the measurement of ASEAN’s content of the products brought further difficulties in
15
selected agricultural products in ASEAN countries, the ineffectiveness of guidelines practiced in ASEAN-PTA in increasing intra-ASEAN trade was as well addressed:
From 71 listed products in 1977, the products voluntarily offered for tariff reductions increased to 6,581 by 1981. Despite the comprehensive list of products offered Margin of Preferences (MOPs), the intra-ASEAN trade did not grow substantially. The reason for this is that products offered by the ASEAN members have little consequences on their trade with each other (Acosta, 1998, p.6).
16
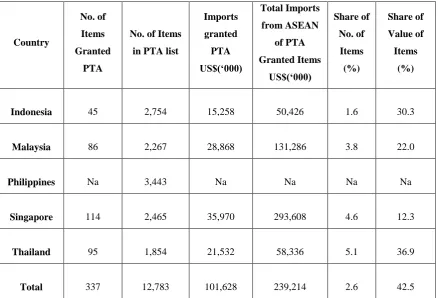
Table 1.1: Utilization of Preferential Trading Arrangements in 1987
Country
No. of
Items
Granted
PTA
No. of Items
in PTA list
Imports granted PTA US$(‘000) Total Imports from ASEAN of PTA Granted Items US$(‘000) Share of No. of Items (%) Share of Value of Items (%)
Indonesia 45 2,754 15,258 50,426 1.6 30.3
Malaysia 86 2,267 28,868 131,286 3.8 22.0
Philippines Na 3,443 Na Na Na Na
Singapore 114 2,465 35,970 293,608 4.6 12.3
Thailand 95 1,854 21,532 58,336 5.1 36.9
Total 337 12,783 101,628 239,214 2.6 42.5 Source: Committee on Trade and Tourism (COTT), ASEAN Secretariat (in Pangestu et al, 1992)
1.4 ASEAN Free Trade Area (AFTA)
17
of anti-dumping duties and voluntary export restraints were deemed to be prevalent instead. As a consequence, a better format of regional economic integration had to be formed maintaining the region’s bargaining power. Among various forms of regional economic integration available, the Free Trade Area (FTA) was agreed to be the most feasible format for ASEAN members to establish. The ASEAN Free Trade Area (AFTA) was eventually institutionalized as a result of the fourth ASEAN Summit in Singapore in 1992. This point has, in fact, been pointed out in the study concerning ASEAN external economic relations by Tongzon (2002); the establishment of AFTA was perceived as a counter strategy for ASEAN countries to promote cooperative venture attracting trade and investment to the region:
First, the 1992 decision by the ASEAN countries to establish an ASEAN free trade area by the year 2008 and the recent decision to speed up the process by moving the implementation date to 2002 reflected the ASEAN efforts to maintain, if not improve, the attractiveness of the ASEAN region for trade and investment. At the same time, there has been an attempt to forge linkages with NAFTA and EU countries (Tongzon, 2002, p.126).
Nevertheless, given the disappointment of ASEAN-PTA, it was more than a decade before the AFTA could be materialized. Such a delay could still be attributed to the fact that ASEAN countries, on the whole, upheld national interests rather than regional ones. The essay on ‘Regionalism and Globalism in Southeast Asia’ by Palmujoki (2001) also highlighted this point:
ASEAN ideology has emphasized national resilience, accompanied by regional resilience…Thus, even economic cooperation, requiring national economies to
18
watered down any serious attempts to create supranational economic cooperation in ASEAN (Palmujoki, 2001, p. 50).
In the mid 1990s, the ASEAN’s founders, ASEAN-6, managed to expand, accepting 4 additional countries into this regional economic integration; Vietnam joined the zone in 1995, Myanmar and Laos joined the area in 1997 and Cambodia came in last in 1999. The admission of Cambodia completed ASEAN-10 which was indeed a remarkable achievement for the region in terms of achieving regional peace and political stability. As this group of countries is comprised of Cambodia, Laos, Myanmar and Vietnam, they are known as the CLMV. Being official members of ASEAN, this group of countries had to simultaneously perpetrate themselves to the trade liberalization proposed under AFTA. Even though it was aimed at giving the whole of Southeast Asia free trade status, this integrating preparation was a politically-driven process. That is because, in practice, the AFTA-membership status was given concurrently with the granting of ASEAN-membership26. In other words, ASEAN countries made FTA politically acceptable.
Political considerations have largely influenced the CLMV to foster economic integration with former AFTA-members: ASEAN-6. Taking into consideration that these countries were newly emerging economies, they were literally absent from international markets. From CLMV’s perspectives, being integrated with ASEAN-6 politically and economically could thus be perceived not only as a recommended path to create good relationships with the rest of the region but also a gateway to international environment jointly. Correspondingly, ASEAN-6 also wanted to expand this form of
26 Not only did they join the free trade area at different times, this group of countries was also given
19
regional cooperation further to include every country in the region. This too was driven by political motive as these ASEAN founders intended to respond to the regionalism concept that had been practiced widely across Europe and North America and was approaching to Asia. In summary, it can be said that the formation of AFTA is politically-oriented as it was not caused by high trade level between members. This, in other words, implies that AFTA-memberships are exogenous. Yet, having all ASEAN countries in AFTA, ASEAN-6 expected to promote the region as well as to strengthen the region’s bargaining power further especially in terms of international negotiations.
However, this course of action was not at all smooth. A number of obstacles were in the way that had delayed these CLMV countries opting into ASEAN/AFTA at the same time as ASEAN-6.
Before proceeding further, it is necessary to provide a brief overview of the CLMV countries. Important historical backgrounds, demographic and fundamental social settings of these countries will also be explored. This information is not only sufficient to spell out the lateness of CLMV’s admission into ASEAN/AFTA but also casts light on their motivation in seeking to be a part of this regional cooperation.
1.4.1 Transitional economies: an overview of key characteristics
Cambodia (Kingdom of Cambodia)
20
Nevertheless, after declared independence, Cambodia has experienced social turmoil and several internal conflicts. One of the major social disruptions was invasion by the communist force from the Khmer Rouge which ended with the execution of 1.5 million people. With the assistance provided by the UN, the country managed to launch her first national election in 1993. Nevertheless, Cambodia was not peaceful until 1999 when the remaining Khmer Rouge surrendered27.
Geographically, Cambodia has a total land area of 181,035 square kilometres with a population of approximately 14.9 million28. With regards to the economic conditions, agriculture is the most important economic activity although more advanced industries have been growing in recent years. Major agricultural exports are rice, fish, timber and rubber. Other important industries are tourism, textile and garment sectors. As the country is rich in natural and mineral resources, oil exploitation, as well as mining industries have recently become one of the fastest growing industries attracting large amounts of foreign direct investment. Between 2004 and 2008, the Cambodian economy experienced a high growth rate of approximately 10 % annually. In fact, according to the IMF report, the country managed to rank as one of the world’s top 10 countries in terms of annual average GDP growth between 2001 and 2010. Even so, Cambodia is still underdeveloped in several areas. As the country has long been suffering from wars and political conflicts, more than 50 % of the population is under 25 years old29. This contributes to the lack of a skilled and educated labour force which further explains the limited economic activities aforementioned.
27
CIA-The World Factbook. (2011). Retrieved 2011, from https://www.cia.gov/library/publications/the-world-factbook/geos/cb.html
21 Laos (Lao People’s Democratic Republic)
Similar to Cambodia, Laos was a part of Thailand (previously known as Siam) during the late 18th Century and was later transferred to French Indochina in 19th Century. The country declared independence soon after the end of the Japanese occupation in 1945. However, she was under French rule again until receiving autonomy in 1949. After that, Laos was controlled by the monarchy which lost power to the Communist Party in 1975. Laos thus became a one-party socialist republic since then.
With regard to the landscape of the country, Laos is the only landlocked nation in South East Asia, having a total land area of only 236,800 square kilometres. The population size is also small, with approximately 6.6 million inhabitants. As far as the economic condition is concerned, the country still relies heavily on subsistence agriculture for its GDP and employment. For example, the rice cultivation sector accounts for approximately 30 % of the GDP and 75 % of total employment30. In addition, the country is rich in natural and mineral resources, of which the majority, have not been exploited. The key resources are, for instance, timber, gypsum, tin, gold and gemstones as well as hydropower. Other key economic activities are cross-border trade and investment, mainly conducted with close neighbours such as Thailand, Vietnam and China. Apart from the time of the Asian Financial Crisis, Laos has been experiencing consistent and high average growth rates of approximately 6 % per annum since 198831. Notwithstanding such high growth rates, the country is underdeveloped in many areas, especially in terms of its basic infrastructure. According to the UN Development Programme, Laos is still listed among the least developed countries.
30 CIA-The World Factbook. (2011). Retrieved 2011, from
https://www.cia.gov/library/publications/the-world-factbook/geos/la.html
22
Myanmar / Burma (Republic of the Union of Myanmar)
Historically, Myanmar was under British colonization as part of its Indian Empire for more than half a century (1824-1886). The country became independent from the Commonwealth in 1948. During the period of 1962-1988, General Ne Win who was the military ruler, appointed himself as president. The military deposed General Ne Win and formed the ruling stratocracy in 1988. In 1990, the country organized her first election, which resulted in a landslide victory for the National League for Democracy (NLD) headed by Aung San Suu Kyi. However, the ruling military did not hand over power and continued to govern the country until 1997 as the State Law and Order Restoration Council (SLORC). Another election in 2010 led to the formation of a parliament in 2011 having Thein Sein as a president. This government attempted to call for political and economic reforms which aimed to draw the more open economic and foreign policies.
With a total land area of 676,678 square kilometres, Myanmar is ranked as the world’s 40th largest country. The country also has a large population of nearly 60 million, which makes it the world’s 24th most populous country32. Myanmar is another resource-rich country in the region; having, for example, petroleum, natural gas, timber, tin, zinc, as well as precious stones. Nevertheless, the exploitation of these resources has been governed by the ruling elites, thus, in general, the majority of the population do not benefit from this economic activity. Furthermore, as the country has long been governed by the military, sound economic policies have not been provided despite numerous socio-economic reforms. Basic infrastructure and welfare systems are underdeveloped.
32 CIA-The World Factbook. (2011). Retrieved 2011, from
23
Inflation has also been a serious problem especially during 2005-2007. At present, the country is still considered the poorest country in the region. Specifically, it is recorded that about 32 % of the population is living in poverty33.
Vietnam (Socialist Republic of Vietnam)
Vietnam was a part of French Indochina in 1887. The country declared independence in 1945 after the Communist force won the first Indochina War. As a result of this war, Vietnam was divided into the Communist North and the anti-Communist South. Conflicts between these states led to the Vietnam War which resulted in the victory of Communist rule in 1975. The country then became a socialist republic.
The country has a total land area of 331,210 square kilometres with approximately 91 million people34. This makes the country the 13th most populous in the world. With the concern on economic issues, the country has opened up to international markets by initiating a major economic reform known as the ‘doi moi’ programme in 1986. Before that the country was conservative, being under the centrally-planned form of government. Since the reform took place, the country has been experiencing high GDP growth rates, especially during 1990-1997. Vietnam is now one of the fastest growing economies in the world with an annual rate of GDP growth of approximately 7 % since 2000. As trade liberalization has been promoted consistently, the country eventually managed to join the World Trade Organization in 2007. Despite numerous signs of economic development, the country is, however, affected by a high inflation rate. In
33
CIA-The World Factbook. (2011). Retrieved 2011, from https://www.cia.gov/library/publications/the-world-factbook/geos/bm.html
34 CIA-The World Factbook. (2011). Retrieved 2011, from
24
addition, many economic activities are still state-owned although private ownership has been encouraged. With regard to major industries, Vietnam is the world’s largest producer of cashew nuts and the world’s 2nd
largest rice exporter. The country has, in recent years, become the 3rd largest crude oil producer in the region. Other key exports are marine products, coffee, tea and rubber. However, agriculture is no longer the largest source of GDPs as the manufacturing and industry share has evidently been increased. In 2011, the industry share accounted for 40.3 % while the agriculture share only accounted for 22 %. Major industries are clothes, footwear, marine products, food processing, electrical assembly as well as mining. Another important source of income is the tourist industry.
25
chapter concerning AFTA and the transitional Southeast Asian economies, Vietnam’s key motivations in seeking ASEAN/AFTA official membership were elaborated:
In political terms, Vietnam shares the same security and political interests with the other ASEAN countries. Vietnam considers joining ASEAN as an opportunity to make friends with other countries in the region and thus to contribute to the creation of a more friendly and conductive environment for economic development. Vietnam also needs ASEAN to have a more significant and influential voice in the international arena…its membership is necessary in order to maintain the balance of power in the region. The emergence of China with its potential to become a super military power must be balanced in order to avoid any dominance by one country in the region (Tongzon, 2002, p.201).
26
could arrive at its full operation. This is certainly so because, as compared to other CLMV countries, Cambodia had numerous serious domestic issues: the longest history of internal wars and political clashes as well as foreign-related conflicts, especially along her border lines. These problems largely affected diplomatic relationships with neighbouring countries and damaged any potential investors’ confidence in the country’s long-term stability. Hence, for Cambodia, it can be said that one of the major
factors in following into ASEAN/AFTA was seeking assistance in settling such outstanding internal problems. By coming out of isolation, the country could receive help from international organizations such as the United Nations (UN) and cooperation from its own region. In fact, ASEAN-6 provided various institutional structures to assist membership countries resolving relevant social and political issues. In summary, it can be said that besides their readiness to be exposed to trade liberalization, governing parties in transitional economies turned to regional cooperation as the potential benefits in political area are obvious.
1.4.2 Objectives and main instruments of AFTA
AFTA’s objectives, in general, remained similar to ASEAN-PTA. However, in addition
to increasing intra-ASEAN trade which had long been the key mission for ASEAN members, the ASEAN’s FTA was also perceived as a vital path to bring in development
intra-27
ASEAN trade thus serves as a catalyst to promote efficient production and competition in the long term.
Hence, in comparison to ASEAN-PTA era, there were significant changes required from all members in order to establish the free trade zone. In spite of many routes that could be implemented toward successful regional trade liberalization, a necessary first step that ASEAN countries began with was the elimination of tariffs. As a result, the ‘Agreement on the Common Effective Preferential Tariff (CEPT) Scheme for the ASEAN
Free Trade Area (AFTA)’35
was signed in 1992. This so-called ‘1992 CEPT Scheme’ applied to all manufactured products including capital and processed agricultural goods36. In principle, member countries agreed to segregate these goods further into numbers of product listings allowing each product category to have different timeframe for tariff and non-tariff liberalising requirements. These lists are namely 1) Inclusion
List 2) Temporary Exclusion List 3) Sensitive List and 4) General Exception List. With
regards to trade liberalization through reduction in the CEPT, the Inclusion List covers products that have to undergo immediate tariff liberalization while the Temporary
Exclusion List allows products to be excluded from this process for a temporary period
of time. Nevertheless, these products will have to be transferred to the Inclusion List
eventually. Given that the so-called Unprocessed Agricultural Products (UAPs) are commonly perceived as strategic products within the region, member countries therefore agreed to put them into the Sensitive List. These products are thus given a
35 It is a cooperative arrangement among member countries whereby intra-regional tariffs will be brought
down to 0-5 %. The CEPT also requires that non-tariff barriers will have to be eliminated. However, in order to utilize this scheme, member countries need to meet the rule of origin (ROO) or the local content requirement; products produced have to contain a minimum of 40 % of AFTA value if not totally produced within AFTA countries.
36 In this scheme the unprocessed agricultural products were, however, excluded. See Appendix I for
28
longer timeframe to meet tariff and non-tariff liberalization targets. In addition, for products that are deemed important to a nation security, public morals, human, animal, plant life and health and articles of artistic, historic and archaeological value, they are excluded from this free trade zone. These products are, for that reason, listed in the
General Exception List permanently. On top of these diversified product lists, member
countries also divided the CEPT Scheme further into 2 tariff liberalization schedules: the so-called ‘normal track’ and the ‘fast track’ programmes37 aiming to ease as well as to speed up this tariff liberalization process. In details, the products listed under the
‘normal track’ were planned to have 0-5 % tariff levels by 2008, while the ones under
the ‘fast track’ were aimed to reach the same tariff levels in 2003. Nevertheless,
according to AFTA-memberships’ acknowledgement of the ‘Framework Agreement on
Enhancing ASEAN Economic Cooperation’ in 199538, the tariff reduction
implementation was forwarded to 2003 instead of 200839. Thus, for the ‘fast track’ programme, products with tariff rates above 20 % were required to arrive at the tariff rate of 20 % by 1998 and to attain the target of 0-5 % tariff levels by 2000. In addition, products with tariff rates of 20 % and below had to reduce the tariffs to 0-5 % by 1998. For the ‘normal track’ programme, products with tariffs rates above 20 % were demanded to have the tariff rate of 20 % by 2000. For products with tariff rates of 20 % or below, the deadline to achieve tariff rates of 0-5 % was given to be 2003. Other trade restrictions and non-tariff barriers were, likewise, planned to be removed by 2003.
37 There were 15 products listed under the ‘fast track’ programme. They are vegetable oils, cement,
chemicals, pharmaceuticals, fertilizer, plastics, rubber products, leather products, pulp and paper, textiles, ceramic and glass products, gems and jewellery products, copper cathodes, electronics, wood and rattan furniture. The rest of the products in the ‘1992 CEPT Scheme’ were thus listed in the ‘normal track’ programme.
29
Despite the fact that AFTA’s principle and its key mechanism is similar to ASEAN-PTA, the major difference is that AFTA worked under the CEPT Scheme which is reciprocal and sectoral, making it more encompassing and less cumbersome than the unilateral product-by-product approach of ASEAN-PTA (Soloaga and Winter, 1999). Under the CEPT Scheme, there is an interchange such that once the goods are accepted under the scheme, member countries have to grant preferential tariffs. Nonetheless, the new version of CEPT Scheme, the ‘1995 CEPT Scheme’, covered almost all of product categories, including the UAPs which are generally exempted in preferential trade agreements40 (Acosta, 1998, p.9). This move undoubtedly signalled the strong ambition of ASEAN countries to form integrated economies, although there were many doubts and arguments following such an action. This was so because agricultural products, in particular, unprocessed agricultural goods had long been regarded as a strategic and politically sensitive sector for most of the membership countries. Given similar natural resources in these members, agricultural goods produced are, in addition, perceived as competitive rather than complementary. Thus, this progress strongly implies that member states were ready to open markets for regional competition.
For these reasons, AFTA could be seen as an advance in the pursuit of regional trade liberalization. Most importantly, the major objectives of AFTA are much more straightforward than ASEAN-PTA as it focuses on expanding intra-ASEAN trade as well as increasing the competitiveness of ASEAN countries specifically. Therefore, procedures assembled to support these plans ranged from imposing product standard
40
30
harmonization, and investing in transport infrastructure in order to facilitate intra-regional trade liberalization processes, to providing macroeconomic consultations and coordination of foreign investment policies. Furthermore, the CEPT Scheme also requires member countries to eliminate quantitative restrictions and other non-tariff barriers.
After the time limit agreed to adjust tariff reduction, member states could gradually exploit the CEPT Scheme to cut tariff lines to fall within the target band of 0-5 %. As of 200741, AFTA managed to put approximately 98.58 % of total products in ASEAN under the Inclusion List, with 93.67 % of these products having tariff within the 0-5 % range. The rest of the products having tariffs above 5 % are products that are in the Sensitive List and the General Exclusion List respectively. Considering specifically ASEAN-6 economies, 98.67 % of products in the Inclusion List were brought down to 0-5 %. Within this category, 71.44 % of these products had already achieved 0 % tariff. For the rest of ASEAN, 97.32 % of their products were included into Inclusion List, and 86.21 % of these products had achieved the tariff band of 0-5 %. The products that remained in the Sensitive List were minimal as they accounted for only 0.51 % of the tariff lines in Cambodia, 1.90 % in Laos and 0.25 % in Myanmar. Thus, at the time that the research investigated this free trade area in 2007, the average tariff rate under the CEPT Scheme for ASEAN-6 was very low at approximately 1.59 %. This amount had been hugely reduced considering the average tariff of 12.76 % in 1993. And for the rest of ASEAN, the average tariff rate was around 4.4 % in that same year. It can be seen
31
that in 2007, AFTA was very close to its full realization of the ASEAN Free Trade Area status already.
Taking above causes into consideration, the study perceives the year 2007 to be an important year in which to examine AFTA. This is because besides average tariffs among membership countries were near to the ground in 2007, it was also the time that the ASEAN Economic Ministers (AEM) had agreed to enhance the CEPT Scheme as a legal instrument. This decision led to the signing of the ASEAN Trade in Goods Agreement (ATIGA) later in 2009. With the hope of establishing the single market, namely the ASEAN Economic Community (AEC), by 2015, this agreement would, in fact, act beyond an ordinary agreement: being a rule-based trade facilitating medium aiming to enhance the confidence of traders coming from within and outside the region42. In the case of the ATIGA coming into law, the CEPT agreement and certain protocols would be superseded. Therefore, in evaluating the success of AFTA which has the CEPT Scheme as the major tool for trade liberalization, the year 2007 is thus the appropriate time to account for the effects. With ATIGA and other related developments in trading policies, substantive changes could have occurred in the ASEAN economies after 2007. In that case, it would clearly be more complicated, if not impossible, to isolate the effectiveness of the key liberalization mechanism: the CEPT Scheme exhibited in AFTA from other sources. Secondly, at the time of conducting this piece of research, which was in early 2009, the best available data on ASEAN countries was complete up to 2007. Last but not least, 2007 was also the year that the last AFTA member, Cambodia, had transferred the remaining products under the Temporary
32
Exclusion List into the Inclusion List. With this progress, there were no products left in the Temporary Exclusion List under the CEPT Scheme.
1.5 Organization and scope of the thesis
In pursuing the upcoming plan to create the AEC in 2015, ASEAN require a more integrated approach, especially in the trade dimension. Prior to that, it is, however, important to state the performance of the current form of regional economic integration, the long-established free trade zone: AFTA. The fundamental question often addressed by economists and policy makers within the region, is whether the creation of AFTA has brought about the desired effects for the member states over this time. The question
of ‘how far have we come?’, even though it sounds simple, is very important and indeed
necessary to allow AFTA members to consider and realize their position before strategizing any appropriate actions in order to obtain the best economic outcome from regional economic integration of any type. Otherwise, even if the most profound regional economic formation is established, it could end up as nothing more than the so-called ‘vision’ statement.
Given this background, the advanced progress of AFTA (in 2007), plus an improvement in ASEAN’s trade data prompt this study to reflect on examinations made regarding the
past studies on ‘AFTA-effects’. An updated empirical account is essentially required for an evaluation of AFTA which is also vital for the whole region’s future plan regarding
33
other empirical tools, the ‘Gravity Model’ has become one of the most popular means to study RTA(s)-effects on countries’ trade flows. The origin of the model in the subject of international trade is also elaborated here. As far as theoretical foundations of the
‘Gravity Model’ are the concern, the chapter selectively presents key literature that
justified the model’s theoretical grounds. The chapter additionally explains various forms of empirical specification of the model that are commonly employed to study the issue. Last but not least, the chapter points out the format of the empirical gravity specification that the thesis will be used as a benchmark.
Chapter 3 discusses the application of the ‘Gravity Model’ to ASEAN’s trade database; ASEAN’s trade ties are examined in general and ‘AFTA-effects’ on intra-ASEAN trade
flows are assessed, in particular. The chapter starts off reviewing related research in detail. Concerns regarding methodologies and modelling issues from past studies are also discussed. Aiming to control for several biases found in traditional cross-sectional work, the panel data framework is, in consequence, proposed as the solution. The time dimension of panel structure makes it possible to consider the role of the ‘business
cycle’ or the time dimension in the long period panel data. Furthermore, it allows