NonCommercial-NoDerivs licence (http://creativecommons.org/licenses/by-nc-nd/4.0/), which permits non-commercial reproduction and distribution of the work, in any medium, provided the original work is not altered or transformed in any way, and that the work is properly cited. For commercial re-use, please contact [email protected]
Accurate identi
fi
cation of hospital admissions
from care homes; development and validation
of an automated algorithm
G
EMMAH
OUSLEY1, S
ARAHL
EWIS2, A
DEELAU
SMAN3, A
DAML. G
ORDON3,4, D
OMINICKE. S
HAW1,51
East Midlands Academic Health Science Network, Clinical Sciences Building, Nottingham City Hospital Campus, Hucknall Road, Nottingham, UK
2
Division of Epidemiology and Public Health, School of Medicine, University of Nottingham, Nottingham, UK 3
Division of Medical Sciences and Graduate Entry Medicine, University of Nottingham, Derby Medical School, Derby, UK 4
School of Health Sciences, City, University of London, UK 5
Division of Respiratory Medicine, School of Medicine, University of Nottingham, Nottingham, UK
Address correspondence to: Gemma Housley, East Midlands Academic Health Science Network, Clinical Sciences Building, Nottingham City Hospital Campus, Hucknall Road, Nottingham, UK. Email:[email protected]
Abstract
Background: measuring the complex needs of care home residents is crucial for resource allocation. Hospital patient administration systems (PAS) may not accurately identify admissions from care homes.
Objective:to develop and validate an accurate, practical method of identifying care home resident hospital admission using routinely collected PAS data.
Method: admissions data between 2011 and 2012 (n= 103,105) to an acute Trust were modelled to develop an automated tool which compared the hospital PAS address details with the Care Quality Commission’s (CQC) database, producing a likeli-hood of care home residency. This tool and the Nuffield method (CQC postcode match only) were validated against a manual check of a random sample of admissions (n= 2,000). A dataset from a separate Trust was analysed to assess generalisability. Results:the hospital PAS was inaccurate; none of the admissions from a care home identified on manual check had a care home source of admission recorded on the PAS.
Both methods performed well; the automated tool had a higher positive predictive value than the Nuffield method (100% 95% confidence interval (CI) 98.23–100% versus 87.10% 95%CI 82.28–91.00%), meaning those coded as care home resi-dents were more likely to actually be from a care home. Our automated tool had a high level of agreement 99.2% with the second Trust’s data (Kappa 0.86P< 0.001).
Conclusions:care home status is not routinely or accurately captured. Automated matching offers an accurate, repeatable, scalable method to identify care home residency and could be used as a tool to benchmark how care home residents use acute hospital resources across the National Health Service.
Keywords:care homes, algorithm, secondary care, informatics, patient admission, older people
Introduction
In the UK, approximately 425,000 people currently live in long-term care homes, institutions which provide accom-modation and personal care, with or without specialist nursing input [1]. The majority of residents are aged over 80, have cognitive impairment, multi-morbidity and are
subject to polypharmacy. Most residents require help with ambulation and or personal care. Many are near the end-of-life [2].
care-sensitive conditions to be a key performance indicator [4]. Analysing the impact of such interventions is difficult because National Health Service (NHS) hospitals do not accurately record whether patients reside in care homes. Currently, on admission to hospital patient address details should be checked and entered onto the patient administration system (PAS); in theory this represents the most accurate method of identifying care home resident hospital admissions. However, PAS categor-ies, including‘source of admission’ and ‘discharge destination’ are user-dependent and frequently misinterpreted. A patient admitted to hospital from a care home is frequently inaccur-ately coded as living at a‘usual place of residence’.
The Care Quality Commission (CQC) is the statutory regulator for health and social care in the UK and manages a database containing all registered care homes which com-prises care home provider details such as name, address and postcode. Techniques such as those employed by the Nuffield Trust (which utilise the CQC database and assume that all patients aged 75 or over sharing the same postcode as a care home, reside in a care home) have been used to identify care home residents in hospitals [5], but this meth-od can be inaccurate; one study found that 31% of admis-sions (aged 65 and over) with a postcode match did not actually reside in a care home [6].
Given the ageing population and limited resources, it is increasingly important to provide commissioners and provi-ders with accurate real-time analysis of how care home resi-dents use secondary care facilities. Accurately coding care home admissions to hospital could help identify gaps in ser-vices, act as a benchmarking tool for care home provision across the NHS, and present a more effective evaluation method for new innovative models of care such as the Enhanced Health in care homes Vanguard, all of which are central to the NHS 5-year forward view [7].
Our study set out to develop a more accurate method to identify care home residents who attend NHS second-ary care hospitals using routinely collected administrative data. We validated our automated tool by comparison against manual checking of hospital records, and existing published care home identification methods. Finally, we checked our automated tool in another hospital Trust to assess generalisability.
Methods
Setting and data access permissions
This study was conducted in a large tertiary level NHS teaching hospital (Trust-1) providing services to over 2.5 million people and a neighbouring NHS Foundation Trust (Trust-2) serving a further 420,000 people within the East Midlands of the UK. The population is predominantly urban and has high levels of deprivation.
The tool was developed in collaboration with Trust-1. All patient identifiable data were processed and analysed by an NHS data analyst within a secure NHS environment with appropriate information governance permissions.
Section 1—tool development
Derivation dataset
The automated tool was developed using data from a large tertiary level NHS teaching hospital (Trust-1) in the East Midlands of the UK. Emergency admission records (n = 103,105) between January 2011 and December 2012 were extracted from the Trust’s PAS. The dataset was limited to patients aged 16 years and over at the point of admission and included the patient’s current address and postcode recorded on PAS at admission.
To produce a dataset of patients’addresses along with a matched likelihood of whether the patients’ address was a care home, the following steps were taken:
(i) Patient addresses were examined using formulae within a Microsoft Excel workbook flagging key words, which suggested they resided in a care home, such as‘nursing’ or‘resident’.
(ii) A Microsoft Office ‘vlookup’ function was used to search for the patient’s postcode in the CQC list of registered care homes, flag if there was a match and link the matching care home name and address details to each record where applicable.
(iii) All records that either contained a key word (i) or had a CQC postcode match (ii) were individually checked by comparison of patient address with matching care home address details, including internet searches and coded as a care home admission or not where appropriate.
(iv) Remaining records with no flags were coded as not being a care home admission.
Automated tool formulae development
A series of formulae were applied to the derivation dataset including fuzzy string matching (a technique of comparing two data strings and measuring how closely they match), in order to match patient addresses with care home address details. A set of rules based on these formulae were gener-ated and used to create an automgener-ated tool within an Excel workbook. This tool compared the patient’s address details including postcode against the care home address details recorded in the CQC database and automatically calculated the likelihood of the address being a care home. Testing the automated tool on the derivation dataset gave an estimated sensitivity of 90% and specificity of 99%, which was con-sidered an acceptable level of accuracy. Next, validation against a true gold standard was required.
Section 2—tool validation
Power calculation
A power calculation to estimate the sample size required was performed in nQuery Advisor based on the width of a 95% confidence interval around sensitivity and specificity estimates, both presumed to be 70% or greater. Based on an estimated prevalence of care home residence in those aged 80 years or over of 15–20% and allowing for an esti-mate of specificity and sensitivity within 5% variation gave a sample size of 2,000.
Gold standard dataset
A random, cross-sectional sample of 2,000 admissions between 1 April 2014 and 31 March 2016 of patients aged 80 years and over was extracted from the PAS database at the same acute trust (Trust-1). This dataset included age in years, full address and postcode, and ‘source of admission’ category recorded on PAS at the point of hospital admis-sion. This validation dataset did not overlap with the deriv-ation dataset in Section 1.
Next, the admitting addresses of these 2,000 admissions were individually cross-checked against the CQC database using both postcode and address to definitively categorise each admission record as being admitted from a care home or not.
Automated tool validation check
The automated tool developed in Section 1 was checked against the gold standard dataset, to predict whether patients resided in a care home or not. Estimates of sen-sitivity, specificity, positive predictive value (PPV) and negative predictive value (NPV), using 95% exact bino-mial proportion confidence intervals were calculated using STATA.
The Nuffield method (CQC postcode match only) and the hospital PAS recorded ‘source of admission’ method were assessed by comparison against the gold standard to establish how well the automated tool performed in relation to current methods. See Table1for details.
Section 3—applicability of tool to other NHS
hospitals
A dataset from another acute trust (Trust-2) was obtained to assess applicability of the tool in a different NHS hos-pital site. This dataset included all unselected admissions with no limitation on age, full address including postcode and a care home address status. Routine practice at this trust was to establish care home address status based upon a comprehensive list of care homes from the local NHS Clinical Commissioning Groups (CCG). A ‘vlookup’ func-tion was performed in Excel using the patient’s postcode and then those that matched a record in the care home list were manually checked to ensure the address details matched the care home details. Both the automated tool and Nuffield method were applied to the Trust-2 dataset. As the care home address status had not been individually
checked, raw overall agreement and a Kappa coefficient were calculated to quantify the level of agreement between the two methods. See Table2for details.
Results
In the gold standard dataset 11.05% (221/2,000) of admis-sions resided in care home. The average age was 85 years at admission (IQR 82–88); 55.65% (n= 1,113) were female.
None of the admissions identified as coming from a care home in the gold standard dataset had a‘source of admission’ of care home recorded on PAS, 99.10% (n= 219) were coded as‘Usual place of residence’and the remaining 0.90% (n= 2) were recorded as admitted from another NHS hospital.
The automated tool and Nuffield method correctly coded 93.21% and 97.74% of those living in a care home and 100% and 98.20% of those not living in a care home respectively. Of those coded as living in a care home by the automated tool and Nuffield method 100% and 87.10% were correct and of those coded as not living in a care home 99.16% and 99.71% were correct respectively. (Table1)
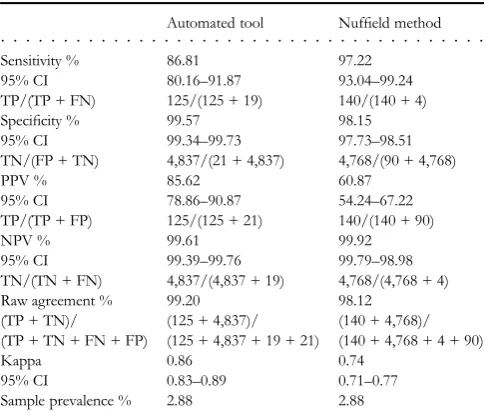
Data comparing the automated tool and Nuffield meth-od applied to the Trust-2 dataset are summarised in Table2.
Discussion
This paper describes the development and validation of a tool to automatically identify care home residents’address sta-tus at the time of secondary care admission, using data rou-tinely held on all NHS hospital PAS systems. The tool was able to identify patients residing in a care home with a higher than previously published level of specificity and positive pre-dictive value, with no significant loss in sensitivity or negative predictive value. It was feasible to implement the tool in a second NHS setting on a sample with no exclusion on age and it was found to maintain a high level of accuracy in this context. However the difference in the proportion of care home coded admissions that were actually from a care home widened (tool PPV 85.62 versus Nuffield PPV 60.87). This suggests that the tool would be preferable when applied to a sample including all ages.
This study builds on the work of Godden and Pollock [6], who found that the categorical ‘source of admission’ held on hospital PAS databases was unreliable, correctly identifying only 1.3% of care home admissions, and the previously conducted work by the Nuffield Trust (Sherlaw-Johnsonet al.[5]) already described earlier in this article.
dynamic nature of the care home sector the tool must also be updated regularly to ensure effectiveness.
In conclusion, the automated tool for identification of care home residents from acute hospital databases is simple to implement and uses routinely collected data. It does not require advanced programming or statistical skills. It has high sensitivity and specificity and is preferable to manual check-ing. This is important where rapid data turnaround, for example to populate care home admissions dashboards, is required. These data will allow organisations to plan and man-age their resources accordingly and the impact of any quality
improvement initiatives undertaken across the NHS could be measured more effectively. In future our methodology could potentially support the development of a benchmarking tool monitoring the variability of health care provision by the NHS to care home residents regionally or nationally.
Keypoints
• Data identifying hospital admissions from care homes are not routinely or accurately captured on PAS.
• Care home resident identification is vital for understanding health care needs and supporting service improvement. • The tool presented here is more accurate than current
methods and easy to implement.
Acknowledgements
The PEACH study research team are, in addition to the authors, Mr Zimran Alam, Ms Anita Astle, Prof. Tony Avery, Dr Jaydip Banerjee, Prof. Clive Bowman, Dr Neil Chadborn, Mr Michael Crossley, Dr Reena Devi, Prof. Heather Gage, Prof. Claire Goodman, Dr Kathryn Hinsliff-Smith, Dr Jake Jordan, Prof. Pip Logan, Ms Annabelle Long, Prof. Finbarr Martin, Prof. Julienne Meyer, Prof. David Stott and Dr Maria Zubair. Many thanks to Mr Christopher Bell of Nottingham University Hospitals NHS Trust for input into the algorithm develop-ment and to Ms Chelsie Gosling of Sherwood Forest Hospitals NHS Foundation Trust for data extraction. This work has been supported by East Midlands Academic Health Science Network and approved by Nottingham University Hospitals Information Governance.
[image:4.612.69.567.78.288.2]. . . .
Table 1. Trust-1 comparison of PAS code source of admission, automated tool and Nuffield method with gold reference standard
PAS code‘source of admission’ Automated tool Nuffield method
Sensitivity % 0 93.21 97.74
95% CI 0–1.66 89.05–96.15 94.80–99.26
TP/(TP + FN) 0/(0 + 221) 206/(206 + 15) 216/(216 + 5)
Specificity % 100 100 98.20
95% CI 99.79–100 99.79–- 100 97.47–98.77
TN/(FP + TN) 1,779/(0 + 1,779) 1,779/(0 + 1,779) 1,747/(32 + 1,747)
PPV % 0 100 87.10
95% CI n/a 98.23–100 82.28–91.00
TP/(TP + FP) 0/(0 + 0) 206/(206 + 0) 216/(216 + 32)
NPV % 88.95 99.16 99.71
95% CI 87.49–90.29 98.62–99.53 99.34–99.91
TN/(TN + FN) 1,779/(1,779 + 221) 1,779/(1,779 + 15) 1,747/(1,747 + 5)
Raw agreement % 88.95 99.25 98.15
(TP + TN)/ (0 + 1,779)/ (206 + 1,779)/ (216 + 1,747)/
(TP + TN + FN + FP) (0 + 1,779 + 221 + 0) (206 + 1,779 + 15 + 0) (216 + 1,747 + 5 + 32)
Kappa 0.11 0.96 0.91
95% CI n/a 0.92–1.00 0.87–0.95
Sample prevalence % 11.05 11.05 11.05
All Kappa statistics,P-value < 0.001.
TP, true positive; TN, true negative; FP, false positive; FN, false negative.
. . . .
Table 2. Trust-2 comparison of automated tool and Nuffield method with Trust-2 derived data
Automated tool Nuffield method
Sensitivity % 86.81 97.22
95% CI 80.16–91.87 93.04–99.24 TP/(TP + FN) 125/(125 + 19) 140/(140 + 4)
Specificity % 99.57 98.15
95% CI 99.34–99.73 97.73–98.51 TN/(FP + TN) 4,837/(21 + 4,837) 4,768/(90 + 4,768)
PPV % 85.62 60.87
95% CI 78.86–90.87 54.24–67.22 TP/(TP + FP) 125/(125 + 21) 140/(140 + 90)
NPV % 99.61 99.92
95% CI 99.39–99.76 99.79–98.98 TN/(TN + FN) 4,837/(4,837 + 19) 4,768/(4,768 + 4)
Raw agreement % 99.20 98.12
(TP + TN)/ (125 + 4,837)/ (140 + 4,768)/ (TP + TN + FN + FP) (125 + 4,837 + 19 + 21) (140 + 4,768 + 4 + 90)
Kappa 0.86 0.74
95% CI 0.83–0.89 0.71–0.77
Sample prevalence % 2.88 2.88
All Kappa statistics,P-value < 0.001.
[image:4.612.63.308.358.567.2]Contact
The algorithm can be accessed by emailing the lead author, or atwww.emahsn.org.uk/informaticstools
Con
fl
icts of Interest
None declared.
Funding
This work has been undertaken as part of the Proactive Healthcare of Older People in Care Homes (PEACH) study, funded by the Dunhill Medical Trust, award number FOP1/0115.
References
1. Laing & Buisson. Care of the Elderly People Market Survey, 2009. London: Laing and Buisson, 2010.
2. Gordon AL, Franklin M, Bradshaw L, Logan P, Elliott R, Gladman JR. Health status of UK care home residents: a cohort study. Age Ageing 2014; 43: 97–103.
3. Smith P, Sherlaw-Johnson C, Ariti C, Bardsley M. QualityWatch. Focus on: Admissions from Care Homes. London: Health Foundation and Nuffield Trust, 2015. 4. Goodman C, Davies SL, Gordon ALet al. Optimal NHS Service
Delivery to Care Homes: A Realist Evaluation of the Features and Mechanisms that Support Effective Working for the Continuing Care of Older People in Residential Settings. Southampton: NIHR Journals Library, 2017. (Health Services and Delivery Research, No. 5.29.).https://www.ncbi.nlm.nih.gov/books/NBK459420/
5. Sherlaw-Johnson C, Smith P, Bardsley M. Continuous moni-toring of emergency admissions of older care home residents to hospital. Age Ageing 2016; 45: 71–7.
6. Godden S, Pollock AM. The use of acute hospital services by elderly residents of nursing and residential care homes. Health Soc Care Community 2001; 9: 367–74.
7. NHS England. The Future of the NHS: Delivering the Five Year Forward View and Next Steps for Policy. London: NHS England, 2015.