Author(s): Simone Falzoi, Emily Gleeson, Keith Lambkin, Jesko Zimmermann, Richa Marwaha, Robert O'Hara, Stuart Green, Simona Fratianni
This article is provided by the author(s) and Met Éireann in accordance with publisher policies. Please cite the published version.
NOTICE: This is the author’s version of a work that was accepted for publication in
Weather. Changes resulting from the publishing process such as editing, structural formatting, and other quality control mechanisms may not be reflected in this document. Changes may have been made to this work since it was submitted for publication. A definitive version was subsequently published in Weather.
Citation: Falzoi, S., Gleeson, E., Lambkin, K., Zimmermann, J., Marwaha, R., O'Hara, R., Green, S. and Fratianni, S. (2019), Analysis of the severe drought in Ireland in 2018. Weather, 74: 368-373. doi:10.1002/wea.3587
For Peer Review
Analysis of the severe drought in Ireland in 2018
Journal: Weather
Manuscript ID WEA-19-0025.R1 Wiley - Manuscript type: Research Article
Date Submitted by the Author: n/a
Complete List of Authors: Falzoi, Simone; University of Turin, Earth Sciences
Gleeson, Emily; Met Éireann, Research, Environment and Applications Division
Lambkin, Keith; Met Éireann, Research, Environment and Applications Division
Zimmermann, Jesko; Teagasc Food Research Centre Ashtown, Department of Agrifood Business and Spatial Analysis
Marwaha, Richa; Teagasc Food Research Centre Ashtown, Department of Agrifood Business and Spatial Analysis
O’Hara, Robert; Teagasc Food Research Centre Ashtown, Department of Agrifood Business and Spatial Analysis
Green, Stuart; Teagasc Food Research Centre Ashtown, Department of Agrifood Business and Spatial Analysis
Fratianni, Simona; Università degli Studi di Torino, Dipartimento di Scienze della Terra; Centro Interdipartimentale sui rischi naturali in ambiente montano e collinare, Climatologia
Keywords: Drought indices, SPI, PNI
For Peer Review
Analysis of the severe drought in Ireland in 2018Simone Falzoi1, Emily Gleeson2, Keith Lambkin2, Jesko Zimmermann3, Richa Marwaha3, Robert O’Hara3, Stuart Green3, Simona Fratianni1,4
1Earth Science Department, University of Torino, via Valperga Caluso 35 - 10125, Torino, Italy
2Met Éireann, Glasnevin, Dublin 9, Ireland
3Department of Agrifood Business and Spatial Analysis, Teagasc Food Research Centre, Ashtown, Dublin 15, Ireland
4Research Centre on Natural Risks in Mountain and Hilly Environments NatRisk, via Leonardo da Vinci 44, 10095 Grugliasco, Torino, Italy
E-mail: [email protected]; [email protected]; [email protected];
[email protected];[email protected];[email protected]; [email protected];[email protected]
Abstract
The summer of 2018 brought a significant meteorological drought to Ireland, with the 25th of June marking the first official day of drought after a cold winter/spring. Meteorological data recorded at Met Éireann’s (the Irish Meteorological Service) network of stations were used to calculate the Standardised Precipitation Index (SPI), the Percent of Normal Index (PNI) and the Soil Moisture Deficit (SMD). In addition, MODIS remote sensing data from NASA’s TERRA satellite was used to compute the Enhanced Vegetation Index (EVI). The progress of the drought in 2018 has been shown by applying an ordinary kriging interpolation to meteorological observations to estimate the national coverage of drought indices at a monthly scale. According to the 2018 SMD analysis, parts of Ireland recorded their worst drought event on record when compared to the long-term average period of 1981-2010. The SPI and PNI illustrate that whilst the months of January and April were very wet, all subsequent months until September had low rainfall amounts. The SMD indicates drier values during May and June, reaching a maximum value of 94.3 mm on the 14th of July. The greatest difference between EVI in 2018 and the average EVI over a long-term period (2001-2017) occurred during the 2
For Peer Review
months of May and June in the south and east of the country. This analysis of climatological conditions across the country shows that whilst drought may occasionally occur on a national scale in Ireland, the impacts vary locally.
Keywords
Drought indices, SPI, PNI, SMD, MODIS data, EVI 2
For Peer Review
1. IntroductionThe World Meteorological Organization defines drought somewhat broadly as an insidious natural hazard characterised by lower than expected or lower than normal precipitation that, when extended over a season or longer period of time, is insufficient to meet the demands of human activities and the environment (Parry et. al., 2013; West et al., 2018; WMO, 2006). The concept of drought therefore depends on the perspective of the water resource user, and it can generally be classified into four types: meteorological (1-3 months), defined on the basis of rainfall deficiency; agricultural (1-6 months), when soil moisture is insufficient and results in the lack of crop growth and production; hydrological (6-24 months), when there is a lack of water in the hydrological system; and socio-economic, when the demand for water exceeds the supply (Kendon et. al., 2013; Van Loon, 2015; Ziolkowska, 2016).
During the summer of 2018, a significant meteorological drought was recorded in Ireland, with the 25th of June marking the first official day of drought after a cold winter/spring (Met Éireann, 2018a & 2018b). Between the 28th of February and the 4th of March one of the most significant snowfall events of recent years occurred, dubbed the “Beast from the East”, with temperatures struggling to rise above freezing as bitterly cold easterly winds swept over the country (Met Éireann, 2019). These two extremes, climate-stress events highlighted the agricultural vulnerability of the country. Almost all of Ireland was negatively impacted, and in particular eastern agricultural regions produced between 5 and 10% less grass than normal in 2018 - equivalent to about 1 ton/ha less (Fig. 1). Figure 2 shows the colour of the vegetation in Ireland in July 2017 compared to July 2018, as measured by NASA TERRA’s satellite. The green fields in July 2017 are desiccated and brown in July 2018 which resulted in a reduction in agricultural production.
Figure 1 – Effects of drought in Co. Tipperary 17th July 2018 (Photo credit: Alison Maloney,
Teagasc)
For Peer Review
Figure 2 – The NASA TERRA satellite MODIS true colour imagery for the (left) 17th July 2017 and
the (right) 10th July 2018
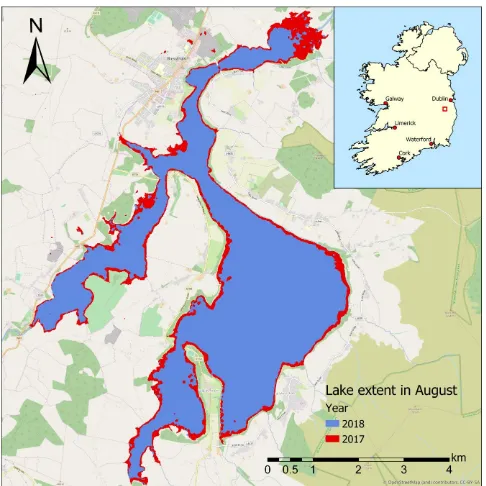
Agriculture is one of the main economic activities in Ireland and therefore this study focuses on the agricultural drought. Agriculture is mainly influenced by climate conditions and soil quality. Ireland's climate is defined as Temperate Oceanic (Cfb) according to Köppen’s climate classification system (Köppen, 1918). The country lies in the north-eastern Atlantic Ocean where the effect of North Atlantic Ocean currents mostly guarantees cool summers and mild winters. Although rainfall in Ireland is generally distributed evenly throughout the year, droughts can still occur. Between 1850 and 2015 Ireland suffered seven major drought-affected periods, the previous being between 1969 and 1977 (Murphy et. al., 2018; Noone et al., 2017; Wilby et al., 2016). In fact, Wilby et. al. (2016) provide a complete report of the occurrence and persistence of meteorological droughts in Ireland since 1850 using the homogeneous Island of Ireland Precipitation network. In total, 45 individual drought events were identified in Ireland during that period. Of these, 22 were shorter than 10 months, 19 had durations of between 10 and 20 months, and four lasted longer than 20 months. Drought is a regional phenomenon and its characteristics differ from one climate to another. Climate model projections suggest that the frequency, duration, and severity of droughts is expected to increase due to rising temperatures and changes to the amount, intensity, and seasonal distribution of precipitation (Park et al., 2013). Effective drought monitoring and impact mitigation is therefore an urgent research priority, not only for mitigation of agricultural impacts but also as an early warning system for socio economic effects (Ault et al., 2014; Baronetti et al., 2018; Liu et al., 2016). An example of an early warning system is the monitoring of the reduction in water-levels in the reservoir. Figure 3 shows the retreat of the water in Blessington Lake, one of the main reservoirs for the Greater Dublin area, following the drought in 2018 compared to a more normal summer. The image was produced using ESA (European Space Agency) Sentinel-1 Synthetic Aperture Radar products.
For Peer Review
Meteorological data recorded at Met Éireann’s networks of stations were used to calculate the Standardised Precipitation Index (SPI; McKee et al., 1993), the Percent of Normal Index (PNI; Werick et al., 1994) and the Soil Moisture Deficit (SMD; Schulte et al. 2005), where the SPI is used to assess the four types of drought. In addition, a time series of Enhanced Vegetation Index (EVI; Huete et al., 1997) was calculated based on Moderate resolution Imaging Spectroradiometer (MODIS) on board the TERRA satellite.
The aim of the paper is to assess the severe drought of 2018 and, in particular its impact on agriculture, as determined through changes in biomass production compared to the long-term mean.
Figure 3 – Images were pre-processed using Radiometric calibration, Speckle Filtering, and Terrain
Correction. The respective acquisition dates were the 2nd and 4th August 2017 and 2018
2. Datasets
2.1. Meteorological data
Met Éireann manages and maintains an observation network in Ireland that gathers weather data for use in weather forecasting, numerical weather prediction models, reanalyses, climate applications, forecast verification and for use by a wide range of stakeholders including those in the agricultural sector. Met Éireann’s network currently consists of four different types of weather station, differentiated according to the range of instruments at each station and the measurement interval. The network includes five airports which are manned stations where staff record meteorological elements each hour. There are also 20 automatic (synoptic) stations which record data at one-minute resolution. Both the manned and automatic stations record air temperature, precipitation, atmospheric pressure, wind speed and direction, relative humidity, cloud type, visibility, sunshine, soil and earth temperatures and past and present weather. As in the UK, Met Éireann also has a network of 60 climatological stations run by voluntary observers and state agencies who record a set of measurements at 0900 UTC each day. Each of these stations reports air temperature and precipitation 2
For Peer Review
but some also record grass temperature, soil and earth temperatures, sunshine duration and cloud cover, wind speed and direction, visibility and present weather. The final suite of stations run by Met Éireann, as well as voluntary observers and state agencies, is an extensive network of approximately 500 rainfall stations. This wide network is necessary in order to capture rainfall in Ireland which has a high degree of spatial variability. There are daily and monthly stations in the rainfall network where daily implies that the readings are taken once a day at 0900 UTC while at monthly stations the readings are taken at 0900 UTC on the first day of the following month.
A number of stations have been either recently installed, discontinued, or have significant gaps in their recording history. To include the maximum number of continuously recording stations in the calculations of the parameters of interest, two time periods were selected. Initially, the SPI was calculated based on a 20-year dataset spanning from 1998 to 2018, which is a minimum period required to calculate the index (WMO, 2012). Data from a total of 262 meteorological stations were available for this calculation (30 from the climatological network, 221 from the rainfall network, and 11 from the synoptic network as shown in Fig. 4a).
In order to compare the precipitation amounts in 2018 with the current climatological standard normal 30-year period 1981-2010 (WMO, 2017), a set of 116 meteorological stations were available for use (11 from the climatological network, 95 from the rainfall network, and 10 from the synoptic network, see Fig. 4b). The PNI index was used for this purpose.
Figure 4 – The meteorological stations used for the calculation of (a) SPI and (b) PNI.
3. Drought indicators
Monitoring different aspects of the hydrological cycle requires a variety of indicators and indices. No single indicator or index can be used to determine appropriate actions for all types of droughts. Hence, different combinations of inputs with various thresholds characterising all four meteorological, agricultural, hydrological, and socio-economic drought types is a preferred approach to provide 2
For Peer Review
complete information. SPI and PNI, based on precipitation data, and the former can characterise the four types of drought, SMD (based on soil moisture data) characterises agricultural drought and EVI, a vegetation index, is used to show the impact of drought on vegetation. These drought indicators are described in the following subsections.
3.1 Standardised Precipitation Index (SPI)
The SPI (McKee et al., 1993) is an index based on monthly cumulative precipitation and classifies the accumulated precipitation of the month under consideration with respect to the long-term average monthly accumulated precipitation for the same month (or other time scales). SPI quantifies a deficit or surplus of precipitation over mean values at different time scales (1, 3, 6, 12, 24 and 48 months) using a probabilistic approach. A rainfall time series is transformed so that it can be described by a statistical gamma distribution, and further transformed into a standard normal distribution. The index can be used to describe the four types of drought, and the classification of the values range from very wet to very dry drought conditions as shown in Table 1. The SPEI-CRAN Package was used for the analysis (Beguería and Vicente-Serrano, 2017).
Table 1: Classification of wet and drought periods based on SPI index (McKee et al.,1993).
Category SPI criterion (dimensionless)
Extremely wet ≥ 2.00
Severely wet 1.5 – 1.99 Moderately wet 1.00 – 1.49 Close to normal -0.99 – -0.99 Moderately dry -1.00 – -1.49 Severely dry -1.50 – -1.99 Extremely dry ≤ -2.00
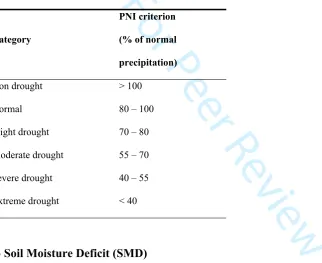
3.2 Percent of Normal Index (PNI) 2
For Peer Review
The simplicity of the PNI (Werick et al., 1994) calculation makes the index useful for comparing any time period and location for identifying and monitoring various impacts of droughts. The index can be calculated for time scales ranging from a single month to a group of months representing a particular season. PNI is calculated by dividing the actual precipitation (P) for the month under consideration by the normal precipitation for the corresponding month in the 1981-2010 30-year period (Pa) and multiplying by ratio by 100.
[image:10.595.71.394.287.550.2]The six categories of PNI are shown in Table 2.
Table 2: Classification of wet and drought periods based on PNI index, (Werick et al., 1994).
Category
PNI criterion
(% of normal
precipitation)
Non drought > 100
Normal 80 – 100
Slight drought 70 – 80 Moderate drought 55 – 70 Severe drought 40 – 55 Extreme drought < 40
3.3 Soil Moisture Deficit (SMD)
The SMD (Schulte et al. 2005), measured in millimetres of water, is the amount of rain needed to bring the soil moisture content back to field capacity. Field capacity is the amount of water that the soil can hold against gravity (e.g. the maximum amount of water you can add to a potted plant before the water leaks out). A positive SMD indicates a water deficit. A higher SMD value implies higher water deficit and therefore the drier the soil. A negative SMD indicates a water surplus. This surplus will drain away in time through surface runoff and/or percolation.
Met Éireann runs an SMD model based on research by Schulte et al. (2005). In this model an SMD value of 0 mm signifies field capacity, while the minimum value of SMD allowed by the model is -2
For Peer Review
10 mm which indicates saturation. The maximum SMD allowed by the model is 110 mm indicating extremely dry soil which is almost devoid of moisture. The parameter values for the drainage-class were derived indirectly, as no soil moisture tension was measured on soils classified as moderately-drained.
To approximate the diversity of soil drainage types in Ireland, the model accounts for three simplified soil drainage types. These are well drained, moderately drained, and poorly drained soil types. The Soil Moisture Deficit (SMD) is calculated as follows:
SMDt = SMDt-1 - Rain + ETa + Drain (1)
where SMDt and SMDt-1 are the SMD values on day t and day t-1 respectively (mm), Rain is the daily precipitation (mm per day), ETa is the daily actual evapotranspiration (mm per day), and Drain is the amount of water drained daily by surface runoff and/or percolation (mm per day).
In Met Éireann, the FAO (Food and Agriculture Organization) Penman-Monteith formula (Allen et al., 1998) is used to calculate the daily potential evapotranspiration, using meteorological data recorded at synoptic weather stations. Actual evapotranspiration is derived from potential evapotranspiration as per Schulte et al. (2005).
3.4 Enhanced Vegetation Index (EVI)
Global “MOD13Q1” data are available from MODIS, a 36 band spectroradiometer on board the NASA TERRA satellite. The MOD13Q1 products are a temporal composite which use the best observation of reflectance recorded over 16 days on a given surface. The data and products acquired by the sensors allow for the construction of time series of vegetation indices (VIs), which are used for monitoring the spatio-temporal variability of vegetation. In this study we used the Enhanced Vegetation Index (EVI) (Huete et al., 1997) which is obtained from specific spectral reflectance in the visible region of the electromagnetic spectrum. The EVI products time series has a spatial resolution of 250 m and span the years 2001 to 2018. EVI shows the type and architecture of canopies 2
For Peer Review
and variations in canopy structure that can be associated with stress and changes related to drought. The index ranges from 1 (very lush green pasture) to 0 (completely barren). Supplementary information is available in Appendix A.
The Irish area is located within the tiles identified as h17v03 of the Earth's surface of the EOS system. All the products have been geo-referenced using the international reference system WGS84 (World Geodetic System 1984). The monthly average growth rate, i.e. the difference between the EVI values of two consecutive months, was calculated each year using the MODIS-Terra products during the period from December to August. Subsequently, the monthly values of 2018 were compared with the monthly average values based on the period from 2001 to 2017, in order to show the impact of drought on vegetation health and how the landscape copes with the water stress situation.
3.5 Spatial interpolation
As the meteorological indices are calculated for a limited set of stations, ordinary kriging, a simple spatial interpolation method (Oliver and Webster, 1990), was applied to estimate the national coverage of SPI and PNI. Ordinary kriging uses semi-variance, a statistical model of the spatial dependency of two measurements, to estimate values on a given grid based on multiple point measurements.
4. Results
Here we consider time frames from January to April (period 1) and from May to August (period 2). Fig. 5 (row 1) shows the SPI analysis, which is as effective in analysing wet periods as it is in analysing dry periods. At the beginning of the year, February and March were “Moderately dry” in the southeast and northwest, respectively, while January and April were “Near normal” and “Moderately wet”. The driest SPI values were recorded during May to July, with June categorised as “Severely dry” over the whole country with some southern areas classified as “Extremely dry”. 2
For Peer Review
The PNI record (Fig. 5, row 2), which compares monthly rainfall totals for 2018 with the climatological standard normal 30-year period 1981-2010, shows that whilst January and April were “Non drought”, low rainfall amounts were recorded during subsequent months (from May to July). “Extreme drought” conditions were recorded in June in the southern-east part of Ireland. Although the PNI values reported “Non drought” and “Normal” conditions during the months of April and August, respectively, a cumulative deficit in precipitation remained. (Fig. 5, row 2).
MODIS Satellite imagery show the impact of the drought by measuring the greenness of the country. This is expressed as an Enhanced Vegetation Index as shown in Fig. 5 (row 3). The greatest difference between the EVI in 2018 and the average EVI over the long-term period (2001-2017) was recorded in March. The below normal anomalies which occurred in May and June were concentrated in the southeast of the country. Due to a persistent lack of rain, the reduction in vegetation growth spread throughout the whole country in July effectively turning the usually green “Emerald Isle” into a browner shade.
The difference in the timing of the drought occurred because the northwest is characterised by heavy soils, which have the advantage of being able to hold moisture for much longer which allows plants to take advantage of the higher temperatures. However, these soils can’t hold out continually, and as the drought progresses growth, becomes hindered in these regions too.
This analysis of climatological conditions across Ireland during the drought event, which peaked in June 2018, shows considerable regional variability with the vegetation growth well below normal in the south and east (well-drained soils), but was actually above normal in the north and west (poorly drained soils).
Figure 5 – Monthly SPI (row 1), PNI (row 2) and anomalies of monthly growth (2018 vs.
(2000-2017) based on MODIS-EVI (row 3) for (a) January to April 2018 and (b), May to August 2018.
For Peer Review
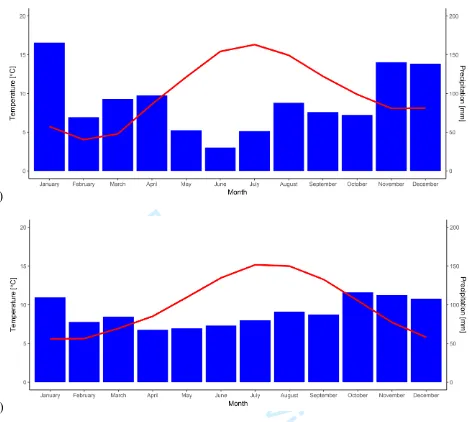
A much more detailed picture of climatic conditions can be observed by using the thermo-pluviometric regime (Fig. 6), which indicates the seasonal variability of the climate. Figure 6 shows the pluviometric and thermal trends for Ireland, based on the synoptic and climatological weather station networks for the year 2018 (Fig. 6a) and the climatological standard normal 30-year period 1981-2010 (Fig. 6b). Compared to the reference period surface air temperatures in 2018 were 2-3 °C higher than normal during the months of May to July, while precipitation in June was reduced by two thirds.
Figure 6 – Thermo-pluviometric diagram in Ireland for (a) 2018 and (b) the reference period 1981–
2010. The blue bars represent the monthly amount of precipitation, the red line shows the average
monthly trend.
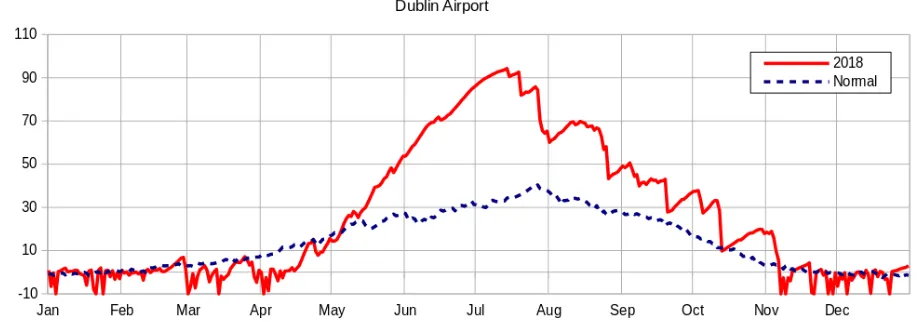
Of the 23 operational synoptic weather stations (including airports) that calculate SMD, 8 have long term records that enable a comparison to normal over the period 1981-2010. By way of an example, let us examine the moderately drained soil class of the SMD model at Dublin Airport, a representative station.
Figure 7 shows the daily SMD of moderately drained soils at Dublin Airport for the year 2018. While April started off with soils slightly wetter than normal, these continued to dry out during May and June, peaking on 14th July with a soil moisture deficit of 94.3 mm, close to the maximum possible deficit.
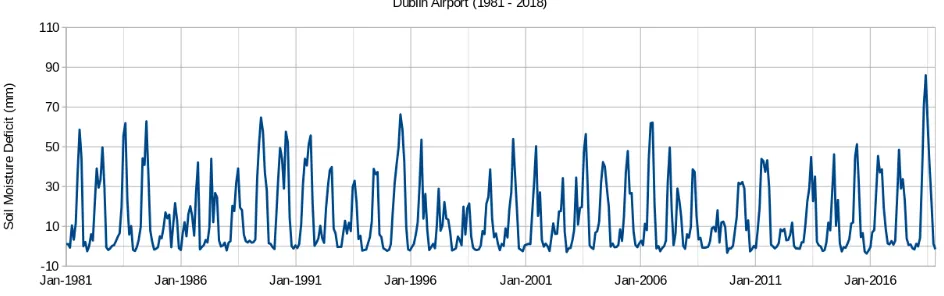
While it is clear that these soils are much drier than normal we need to look back over a longer period to see how unusual this was. Figure 8 shows the SMD of moderately drained soils at Dublin Airport for the period 1981 to 2018 inclusive. While the annual drying of soils in summer is expected and observed, the 2018 drought stands out as the driest soil on record over this period.
For Peer Review
Figure 7 – Daily soil moisture deficit for moderately drained soils at Dublin Airport for 2018
compared to their 30-year normal (1981-2010). In July soils were twice as dry as normal.
Figure 8 – Average monthly soil moisture deficit for moderately drained soils at Dublin Airport for
the period 1981-2018 inclusive. A value of -10 mm represents soil saturation, 0 mm field capacitance,
110 mm absence of moisture. July 2018 is the highest SMD (driest) month over this 38-year period.
5. Discussion
Using climatological indices and satellite data we can assess the progress of 2018’s extreme drought event, and its impacts on Irish agriculture. Monitoring conditions across the country show that, whilst the drought was on a national scale, the impacts varied locally due to the different types of soil. In fact, while eastern regions reported a significant reduction on harvest this year, the uplands of the west and bogs of the midlands produced more biomass than normal, as they are less constrained by water shortages and benefit from higher temperature and increased solar irradiance.
Droughts may become the most important hazards to agriculture in the future. Future climate projections for Ireland based on an ensemble of high-resolution regional climate projections indicate that the number of extended dry periods is expected to increase substantially during summer and autumn by the middle of the century. Summers are projected to be worst affected with dry periods increasing by 12% and 40% for the medium- to low-emission and high-emission scenarios, respectively. Drought will be driven mainly by a decrease in mean precipitation and a rising of mean annual temperature. By mid-century, the rainfall amount is expected to reduce during spring and summer, especially during the summer, with a reduction ranging from 3% to 20%, while mean annual temperatures will rise of 1-1.6 °C, with the largest changes seen in the east of the country (Nolan, 2015).
For Peer Review
6. ConclusionsThe aim of this study was to analyse the drought that occurred in Ireland in Summer 2018, and its impact on agriculture as determined through changes in biomass production. Four drought indicators (SPI, PNI, SMD and EVI) were selected and evaluated using meteorological data recorded by Met Éireann and remote sensing imagery from the MODIS-TERRA satellite.
The four indicators show the evolution of the drought during 2018. In particular, SMD analysis illustrated that the drought in 2018 was the most severe over the period 1981 to 2018 and reached a maximum value of 94.3 mm on the 14th of July at Dublin Airport. According to the SPI and PNI, the driest months were May, June, and July. The impact depended on soil type, and local effects driven by soil drainage capacity. Therefore, although was a drought at a national scale, local conditions varied widely.
Monitoring the recurrence and persistence of drought using different sources of information enables the estimation of drought probabilities that could contribute to planning strategies for the mobilisation and management of water resources.
6. Acknowledgments
This study was funded through the Erasmus+ Traineeships, the EU's programme to support education, training in Europe. Furthermore, the authors would like to thank the Met Éireann voluntary observers for their valuable work recording meteorological data. We acknowledge the use of data products and imagery from the Land, Atmosphere Near real-time Capability for EOS (LANCE) system operated by NASA's Earth Science Data and Information System (ESDIS).
For Peer Review
ReferencesAllen RG, Pereira LS, Raes D, Smith M. 1998. Crop evapotranspiration. Guidelines for computing crop
water requirements. FAO irrigation and drainage paper. 56: 227
Ault TR, Cole JE, Overpeck JT, Pederson GT, Meko DM. 2014. Assessing the risk of persistent drought
using climate model simulations and paleoclimate data. J. of Climate. 27(20): 7529–7549
Baronetti A, Acquaotta F, Fratianni S. 2018. Rainfall variability from a dense rain gauge network in
north-western Italy. Climate Research, 75(3): 201–213
Beguería S, Vicente-Serrano SM. 2017. SPEI: Calculation of the Standardised
Precipitation-Evapotranspiration Index, R package version 1.7
Huete AR, Liu HQ, Batchily K, van Leeuwen W. 1997. A comparison of vegetation indices over a global
set of TM images for EOS-MODIS. Remote Sens. Environ.59: 440–451
Kendon M, Marsh T, Parry S. 2013. The 2010–2012 drought in England and Wales. Weather68(4): 88–95
Köppen W. 1918. Klassification der Klimate nach Temperatur, Niederschlag and Jahreslauf. Petermanns
Geographische Mitteilungen64: 193–203, 243–248
Liu X, Zhu X, Pan Y, Li S, Liu Y, Ma Y. 2016. Agricultural drought monitoring: progress, challenges and
prospects. J. Geogr. Sci. 26: 750–767
McKee TB, Doesken NJ, Kleist J. 1993. The relationship of drought frequency and duration to time scales.
Preprints Eighth Conf. on Applied Climatology. Anaheim, CA, Amer. Meteor. Soc., 179–184
Met Éireann Major Weather Events “Storm Emma”, March 2019, 2019.
https://www.met.ie/cms/assets/uploads/2019/02/EmmaReport2019.pdf
Met Éireann Past Weather Statement, February 2018. 2018a.
https://www.met.ie/climate/past-weather-statements
Met Éireann Past Weather Statement, March 2018. 2018b.
https://www.met.ie/climate/past-weather-statements
Murphy C, Broderick C, Burt TP, Curley M, Duffy C, Hall J, Harrigan S, Matthews TKR, Macdonald
N, McCarthy G, McCarthy MP, Mullan D, Noone S, Osborn TJ, Ryan C, Sweeney J, Thorne PW,
Walsh S, Wilby RL. 2018. A 305-year continuous monthly rainfall series for the island of Ireland
(1711–2016). Clim. Past. 14: 413–440
For Peer Review
Nolan P. 2015. Ensemble of regional climate model projections for Ireland. Environmental Protection Agency.
No 159. ISBN: 978-1-84095-609-2
Noone S, Broderick C, Duffy C, Matthews T, Wilby RL, Murphy C. 2017. A 250-year drought catalogue
for the Island of Ireland (1765–2015). Int. J. Climatol.37(S1): 239–254
Oliver MA, Webster R. 1990. Kriging: a method of interpolation for geographical information systems.
International Journal of Geographical Information System,4.3: 313–332
Park WA, Allen CD, Macalady AK, Griffin D, Woodhouse CA, Meko DM, Swetnam TW, Rauscher SA,
Seager R, Grissino-Mayer HD, Dean JS, Cook ER, Gangodagamage C, Cai M, McDowell NG.
2013. Temperature as a potent driver of regional forest drought stress and tree mortality. Nature Climate
Change. 3: 292–297
Parry S, Marsh T, Kendon M. 2013. 2012: from drought to floods in England and Wales. Weather. 68(10):
268–274
Schulte RPO, Diamond J, Finkele K, Holden NM, Brereton AJ. 2005. Predicting the Soil Moisture
Conditions of Irish Grasslands. Irish Journal of Agricultural Research 44: 95–110
Van Loon AF. 2015. Hydrological drought explained. WIREs Water. 2(4): 359–392.
Werick WJ, Willeke GE, Guttman NB, Hosking JRM, Wallis JR. 1994. National drought atlas developed.
Eos, Transactions American Geophysical Union. 75(8): 89–90
West H, Quinn N, Horswell M, White P. 2018. Assessing vegetation response to soil moisture fluctuation
under extreme drought using Sentinel-2. Water. 10: 838
Wilby RL, Noone S, Murphy C, Matthews T, Harrigan S, Broderick C. 2016. An evaluation of persistent
meteorological drought using a homogeneous Island of Ireland precipitation network. Int. J. Climatol.
36: 2854–2865
World Meteorological Organization. 2006. Drought monitoring and early worming: concepts, progress and
future challenges. N° 1006
World Meteorological Organization. 2012. Standardized Precipitation Index User Guide. N° 1090
World Meteorological Organization. 2017. Guidelines on the calculation of climate normals. N° 1203
Ziolkowska JR. 2016. Socio-economic implications of drought in the agricultural sector and the state
economy. Economies, 4–19
For Peer Review
Figure 1 – Effects of drought in Co. Tipperary 17th July 2018 (Photo credit: Alison Maloney, Teagasc)
For Peer Review
Figure 2 – The NASA TERRA satellite MODIS true colour imagery for the (left) 17th July 2017 and
the (right) 10th July 2018
For Peer Review
Figure 3 – Images were pre-processed using Radiometric calibration, Speckle Filtering, and Terrain
Correction. The respective acquisition dates were the 2nd and 4th August 2017 and 2018
For Peer Review
Figure 4 – The meteorological stations used for the calculation of (a) SPI and (b) PNI.
For Peer Review
a)
For Peer Review
b)
Figure 5- Monthly SPI (row 1), PNI (row 2) and anomalies of monthly growth (2018 vs.
(2000-2017) based on MODIS-EVI (row 3) for (a) January to April 2018 and (b), May to August 2018.
For Peer Review
a)
[image:25.595.63.533.66.488.2]b)
Figure 6- Thermo-pluviometric diagram in Ireland for (a) 2018 and (b) the reference period 1981–
2010. The blue bars represent the monthly amount of precipitation, the red line shows the average
monthly trend.
For Peer Review
Figure 7- Daily soil moisture deficit for moderately drained soils at Dublin Airport for 2018
compared to their 30-year normal (1981-2010). In July soils were twice as dry as normal.
[image:26.595.77.536.97.258.2]For Peer Review
Figure 8- Average monthly soil moisture deficit for moderately drained soils at Dublin Airport for
the period 1981-2018 inclusive. A value of -10 mm represents soil saturation, 0 mm field capacitance,
110 mm absence of moisture. July 2018 is the highest SMD (driest) month over this 38-year period.
For Peer Review
Table 1: Classification of wet and drought periods based on SPI index (McKee et al.,1993).
Category SPI criterion (dimensionless)
Extremely wet ≥ 2.00
Severely wet 1.5 – 1.99
Moderately wet 1.00 – 1.49
Close to normal -0.99 – -0.99
Moderately dry -1.00 – -1.49
Severely dry -1.50 – -1.99
Extremely dry ≤ -2.00
For Peer Review
Table 2: Classification of wet and drought periods based on PNI index, (Werick et al., 1994).
Category
PNI criterion (% of normal precipitation)
Non drought > 100
Normal 80 – 100
Slight drought 70 – 80
Moderate drought 55 – 70
Severe drought 40 – 55
Extreme drought < 40
For Peer Review
Analysis of the severe drought in Ireland in 2018
Simone FALZOI*, Emily GLEESON, Keith LAMBKIN, Jesko ZIMMERMANN, Richa MARWAHA, Robert
O’HARA, Stuart GREEN, Simona FRATIANNI
E-mail: [email protected]; [email protected]; [email protected]; [email protected];
[email protected]; [email protected]; [email protected]; [email protected]
The progress of the drought recorded in the summer 2018 in Ireland has been analysed using four meteorological and satellite indicators: Standardised Precipitation Index (SPI), Percent of Normal Index (PNI), Soil Moisture Deficit (SMD) and Enhanced Vegetation Index (EVI). An ordinary kriging interpolation was applied to estimate the national coverage of drought based on those indices in order to show local variations in impacts on agriculture as determined through changes in biomass production and compared to long-term means.