Annual Competitiveness
Report 2009
Volume 1: Benchmarking Ireland's
Performance
Annual
Competitiveness
Report 2009
Volume 1:
Introduction to the NCC
The National Competitiveness Council was established in 1997 as a social partnership body. It reports to An Taoiseach on key competitiveness issues facing the Irish economy, together with recommendations on policy actions required to enhance Ireland's competitive position.
Each year the NCC publishes the two-volume Annual Competitiveness Report:
Volume One, Benchmarking Ireland’s Performance, is a collection of statistical indicators of Ireland’s competitiveness performance compared to 17 other economies and the OECD or EU-15/Eurozone average.
Volume Two, Ireland’s Competitiveness Challenge, uses this information along with the latest research to outline the main challenges to Ireland’s competitiveness and the policy responses required to meet them.
As part of its work, the NCC also publishes other papers on specific competitiveness issues.
This report is Volume 1, Benchmarking Ireland’s Performance. This report analyses Ireland’s competitiveness performance using 150 competitiveness indicators. These range from measures of the successes of past competitiveness, such as economic growth and quality of life, to the policy inputs that will drive future competitiveness, such as the education system and public spending on infrastructure. Drawing primarily on data from international sources (e.g. OECD, UN, Eurostat) this report benchmarks Ireland’s performance, comparing and ranking it to that of our economic peer group and tracing its evolution over time.
The National Competitiveness Council hopes that this report will, as a reference document, stimulate further debate and discussion on the competitiveness challenges that face Ireland.
Council Members
Dr Don Thornhill Chairman
Mr Rory Ardagh Telecom Property Holdings Limited
Mr Brendan Butler Director of Strategy, Trade, EU and International Affairs, IBEC
Mr Donal Byrne Chairman, Cadbury Schweppes Ireland Limited
Mr Shay Cody Deputy General Secretary, IMPACT
Mr Martin Cronin Chief Executive Officer, Forfás
Mr Pat Delaney Director of Sectors and Regions, IBEC
Ms Clare Dunne Assistant Secretary, Department of Enterprise, Trade and
Employment
Ms Annette Hughes Director, DKM Economic Consultants
Mr William Prasifka Chairperson, Competition Authority
Mr William Slattery Executive Vice President and Head of European Offshore
Domiciles, State Street International (Ireland) Limited
Mr Paul Sweeney Economic Adviser, Irish Congress of Trade Unions
Mr John Travers Consultant and Founding Chief Executive Officer, Forfás and
Science Foundation Ireland
Prof Ferdinand von Prondzynski President, Dublin City University
Council Advisers
Mr Paul Bates Department of Arts, Sports and Tourism
Ms Mary Doyle Department of the Taoiseach
Mr Mark Griffin Department of Environment, Heritage, and Local Government
Mr Kevin McCarthy Department of Education and Science
Mr Eamonn Molloy Department of Communications, Energy and Natural Resources
Mr David Moloney Department of Finance
Mr John Murphy Department of Transport
Mr Liam Nellis InterTrade Ireland
Research and Administration
Mr Adrian Devitt Forfás
Ms Gráinne Greehy Wilton Park House
Mr Eoghan O’Briain Wilton Place
Ms Mary Twomey Dublin 2
Tel: 01 607 3000 Fax 01 607 3030
Email: [email protected]
Foreword by the Taoiseach
As a small, open economy which earns its living by trading on world markets, Ireland is particularly exposed to the current international crisis. It
exacerbates the impact of the difficult adjustment already underway in our construction sector, and the significant fall in the value of Sterling against the Euro. It is no exaggeration to state that responding to this crisis is one of the greatest challenges the country has faced since independence.
That is why it has never been more important to identify clearly the key drivers of national competitiveness, supporting the rebalancing of economic activity that is necessary to support a return to sustainable, export-led growth.
The Government’s Smart Economy Framework sets out a clear vision for sustainable economic renewal. Our goal is to develop a critical mass of companies – both Irish and international – at the forefront of innovation, creating the products and services of tomorrow, and providing well paid jobs for this and future generations.
Consistent with this strategic direction, we will continue to act decisively around the four cornerstones of:
Tackling the banking situation in order to restore credibility and confidence, and get credit flowing;
Attacking the gap in our public finances by increasing revenue and cutting spending, in a planned way, over five years;
Protecting jobs and restoring competitiveness to the way we do business; and
Investing in those who are out of work so that they can return to employment as soon as possible.
One of the clearer lessons of our recent history is the value of a shared assessment of changing challenges and opportunities, supported by a constructive, participatory and problem-solving approach to managing change.
The National Competitiveness Council continues to make an important contribution to our
understanding of a rapidly changing global environment. I would like on behalf of my colleagues in Government to thank the Council for its important work at this difficult time, and am pleased to introduce Benchmarking Ireland’s Performance 2009.
Chairman’s Preface
Our economic circumstances are serious and challenging. National income has declined rapidly, living standards are falling and unemployment has risen sharply. Given the severity of our current economic position, it is now time for Ireland to achieve a swift improvement in competitiveness.
Targeting export-led growth is the only sustainable strategy to maintain living standards and to secure long term prosperity. This will not be easy in a time of falling global demand for goods and services and contracting world trade. But there is no alternative. The Irish economy needs to respond to the current crises and position itself to benefit from a global recovery.
As a small open export dependent economy, Ireland is sensitive to the world economy. But if we are competitive we can outpace others with a strong recovery when the world economy picks up again. This places a premium on sound, evidence-informed policies that support the competitiveness of firms based in Ireland. This report provides an assessment of Ireland’s competitiveness performance against 17 other countries across a range of competitiveness factors, using 150 indicators.
Difficult decisions are necessary to restore our international competitiveness. Without appropriate action, it is entirely possible for the Irish economy to enter a prolonged period of depressed economic activity and for the convergence of Irish living standards on other high-income countries to unwind. The challenge now is to mobilise broadly-based public support for the policy actions that will ensure Ireland emerges from this serious recession with a vibrant enterprise base capable of sustaining high living standards. In particular, Ireland needs to focus its attention on improving cost competitiveness, sustaining employment, fostering innovation at all levels of economic activity and enhancing training and education opportunities. Continuing action to restore the sustainability of the public finances and tackle the banking crisis is also essential.
I would like to thank Council members and the advisors from the relevant Government departments for their work on this document. I would also like to acknowledge the Forfás Secretariat for the work that they have done in preparing material for consideration by the Council.
Don Thornhill
Table of Contents
1. Overview of Ireland’s Competitiveness 8
1.1 Introduction 8
1.2 Key Competitiveness Messages 9
1.3 Summary of the Report 19
1.4 Methodology and How to Read This Report 27
2. Sustainable Growth 31
2.1 National Income 35
2.2 Quality of Life 42
2.3 Environmental Sustainability 44
3. Essential Conditions 48
3.1 Business Performance 50
3.1.1 Business Investment in Enterprise 50
3.1.2 Trade 52
3.2 Productivity and Innovation 55
3.2.1 Productivity 57
3.2.2 Innovation 61
3.3 Prices and Costs 63
3.3.1 Prices 66
3.3.2 Pay Costs 68
3.3.3 Non-Pay Costs 72
3.4 Labour Supply 81
4. Policy Inputs 89
4.1 Business Environment 92
4.1.1 Taxation 92
4.1.2 Finance 97
4.1.3 Regulation and Competition 99
4.1.4 Labour market Regulation 103
4.1.5 Social Capital 104
4.2 Physical and Economic Infrastructure 106
4.2.1 Investment in Physical Infrastructure 109
4.2.2 Transport and Energy Infrastructure 110
4.2.3 Information and Communication Technology Infrastructure 113
4.2.4 Housing 115
4.3 Knowledge Infrastructure 118
4.3.1 Education: Overview 121
4.3.2 Pre-Primary and Primary Education 122
4.3.3 Secondary Education 123
4.3.4 Tertiary Education and Life Long Learning 126
1. Overview of Ireland’s Competitiveness
1.1 Introduction
The Irish economy is currently facing enormous challenges. Since the middle of 2008, national income has been declining rapidly. While the economic crisis is global in scope and unprecedented in terms of the scale and synchronisation of the downturn, the recession in Ireland has been the most severe of the developed economies to date. The Economic and Social Research Institute (ESRI) is forecasting a 7.9 percent decline in GDP and an 8.9 percentdecline in GNP in 20091. This compares poorly with forecasts by the International Monetary Fund
(IMF) for the US (-2.6 percent), the UK (-4.2 percent) and the eurozone (-4.8 percent)2. These figures highlight that citizens of many developed countries, including Ireland, are facing significant falls in real incomes and living standards.
The Irish economy is experiencing a rapid and painful adjustment to the bursting of the property bubble, the international financial crises and the downturn in world trade. As a small, open and competitive economy, Ireland prospered from an export boom driven by globalisation and
investment in the 1990s and early 2000s. In recent years, strong growth in the domestic economy, driven by investment in housing and consumption, replaced exports as the key driver of growth. Though economic growth rates remained strong, our international competitiveness weakened as the domestic boom increased the costs of doing business here and as reforms to improve
competitiveness were delayed - particularly in relation to the non-traded services sector where prices increased at over twice the eurozone average for many years.
Growth derived from asset price inflation, fuelled by a combination of low interest rates, reckless lending and speculation, has now been proven a poor basis for sustainable growth both in Ireland and internationally. The falling value of property and other assets has eroded the capital base of lenders, reversed trends in private sector credit (including mortgages) and led to a sharp reduction in the domestic money supply. The confluence of a domestic banking crisis and property market crash with a severe slowdown in global trade is presenting unprecedented challenges for the Irish economy. The recent IMF report commended Ireland for the policy measures being taken to address
1 ESRI, Quarterly Economic Commentary, Summer 2009. 2 IMF, World Economic Outlook, July 2009.
Figure 1.1: Real GDP Percentage Change over Previous Year
Source:IMF, World Economic Outlook, July 2009
-10% -8% -6% -4% -2% 0% 2% 4% 6% 8%
2003 2004 2005 2006 2007 2008 2009F 2010F
these challenges but stressed the need for determined execution over a sustained period to position Ireland for recovery3.
The primary focus of this report is to provide an evidence based assessment of Ireland’s current international competitiveness. Section 1.2 outlines key messages from the report. Section 1.3 provides a more in-depth assessment of Ireland’s competitiveness performance based on the NCC’s competitiveness framework. Section 1.4 provides an overview of the methodology and details how to interpret the charts.
1.2 Key Competitiveness Messages
This section summarises the key messages from Benchmarking Ireland’s Performance, 2009.
1.2.1 Ireland Retains a Wide Range of Competitive Strengths
While Ireland’s competitiveness position has deteriorated in recent years, we retain a wide range of competitive strengths. These include a young and comparatively well educated workforce (Fig. 4.56), growing levels of research and development activity (Fig. 4.63 and 4.64), a modern
internationally trading enterprise base and a long track record as a successful location for overseas investors (Fig. 3.02 and Fig. 3.03).
These strengths have been supported by increased investment and improvements in infrastructure (Fig 4.28, Fig. 4.30 and Fig. 4.32), education (Fig 4.47), research and development (Fig. 4.62 and Fig. 4.64) and the creation of a supportive business environment (Fig. 4.15 and Fig. 4.16). The recent rapid decline in national income is primarily a reflection of the collapse of the property market. Ireland’s
competitiveness position, while weakening over a number of years, has not changed
dramatically in the past year. We retain a range of important competitive strengths. Ireland continues to perform relatively well on international
competitiveness rankings including those of the World Economic Forum and the Institute of Management Development (Fig 1.2).
3 IMF, Country Report on Ireland, June 2005
Figure 1.2: Ireland’s Competitiveness Position in International Rankings
Source: Institute of Management Development, World Competitiveness Yearbook 2009; World Economic Forum, The Global Competitiveness Report 2008-2009
0 5 10 15 20 25 30 35
2004 2005 2006 2007 2008 2009 IMD WEF
M
o
re
Co
m
p
e
titiv
e
Less
Compet
it
iv
1.2.2 Irish Exporters are Performing Relatively Well in an Adverse Environment
The ability of Ireland to protect the gains in living standards of recent decades and to secure future increases rests on our ability to succeed as competitive exporters of high quality goods and services on international markets. However, the collapse in domestic demand in Ireland has coincided with the most severe global economic recession in decades. The global economy will decline for the first time in over sixty years. Recent IMF projections forecast a contraction of 1.4 percent in global economic activity during 2009 and a fall of 12.2 percent in the volume of goods and services traded globally. This decline in real GDP will be sharpest in developed economies – our key markets. However, the IMF forecasts that global economic activity will expand by 2.5 percent in 2010, which is 0.6 percentage points higher than envisaged in the IMF’s April 2009 projections4.
Ireland’s export performance has weakened because of the global downturn. Merchandise exports weakened considerably during the second half of 2008, resulting in a decline of 0.6 percent in volume terms and three percent in value terms for 2008. The performance of some key sectors such as chemicals remains robust while weak food and beverage exports reflect the sustained
appreciation of the euro relative to sterling. Overall Irish exports have held up in recent months as firms reduce their costs, but sustaining this performance will be dependent on improving the overall cost environment. Given the negative outlook for global demand, the decline in world trade
volumes and the planned closure of some manufacturing plant, the ESRI expects merchandise exports to decline by three percent in 2009 and one percent in 2010 in volume terms5.
While services exports have performed exceptionally well in recent years, their performance also weakened in 2008 with a decline in volume terms of 0.1 percent. However, exports of services grew by three percent in value terms in 2008, with growth in computer services (8.9 percent), business services (5.1 percent)6 and royalties (17.6 percent) offsetting declines in other services and tourism
and travel (-2.3 percent)7. Unsurprisingly, the performance of the financial services (-7.2 percent) and insurance services (-4.3 percent) sectors was particularly weak in 2008.
The outlook for global trade remains very poor for 2009, as turmoil in international financial markets has triggered a sharp fall in consumer and business confidence globally. In the year to May 2009, world trade fell by almost 20 percent8. To date, exporters from Ireland have performed
relatively well. While Irish exports of goods and services are expected to decline by 3.9 percent in volume terms in 2009, this must be set in the context of the severe difficulties facing exporters globally9. The OECD forecasts that the volume of exports of goods and services for the OECD will fall by 16.5 percent in 2009 with significant falls in Japan (-32.3 percent), Germany (-18.9 percent), and
4 IMF, World Economic Outlook, July 2009.
5 ESRI, Quarterly Economic Commentary, Summer 2009.
6 Business services includes merchanting; other trade-related services; operational leasing; legal, accounting and other professional services; advertising and market research; research and development; architectural, engineering and other technical services; management services between affiliates; and other services.
7 CSO, Balance of International Payments, March 2009.
8 Netherlands Bureau for Economic Policy Analysis, World Trade Monitor, July 2009 http://www.cpb.nl/eng/research/sector2/data/trademonitor.html
the US (-13.8 percent). Non-OECD countries such as Singapore and China are also experiencing significant falls in exports. In 2008, Ireland’s share of global trade increased marginally (Fig. 3.08).
Globally, aggressive
expansionary monetary and fiscal policy responses have sought to counteract the severe decline in confidence, industrial production and world trade. While it is difficult to predict when these policies will halt the decline in global economic activity, the policy imperative for Ireland is to
restore the competitiveness of our exporting sectors and our attractiveness for inward investment and to ensure that Ireland can take advantage of global recovery.
The fall in the value of sterling is a significant challenge, particularly for indigenous exporters who are focused on the UK market and compete against UK firms in other markets, which adds urgency to restoring competitiveness. Despite the harsh operating environment for Irish exporters at present, targeting export-led growth is the correct and only sustainable longer term strategy to maintain living standards and secure long-term prosperity.
1.2.3 Ireland’s Cost Competitiveness is Beginning to Improve
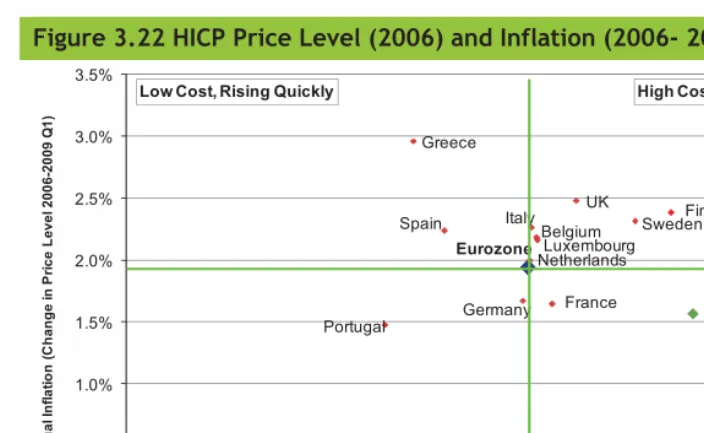
Strong domestic growth in recent years led to significant increases in the costs of doing business in Ireland. Key business inputs such as rents, pay and incomes, utilities and business services had been rising for a sustained period. The fall in demand for goods and services and the strength of the euro (as imports become cheaper) are resulting in a fall in the price level in Ireland. According to the CSO, the annual rate of inflation declined by 5.4 percent in June 2009 – the sharpest fall in Ireland since 1933. The annual rate of Irish inflation fell significantly across most goods and services groups in 2009. Housing and utilities inflation experienced the most dramatic fall from 6.9 percent in 2005-2008 to -4.5 percent in 2009 Q1 (Fig. 3.23). We are also witnessing significant falls in house prices (Fig. 4.44 and Fig. 4.45) and a decline in wage growth (Fig. 3.28 and Fig. 3.29).
While the available evidence suggests the economic downturn is leading to price moderation / falls in Ireland, the challenge is whether this moderation is improving our relative cost competitiveness. Achieving this requires the cost of doing business in Ireland to fall relative to that of our trading partners. Initial signs are positive but the cost base in Ireland remains high. Irish inflation, as measured by the HICP (which excludes mortgage interest payments), declined by 1.7 percent in the
Figure 1.3: Percentage Change in Volume of Exports of Goods and Services, 2004-2010F
Source; OECD Economic Outlook 85, June 2009. ESRI, Quarterly Economic Commentary, Summer 2009.
-35% -30% -25% -20% -15% -10% -5% 0% 5% 10% 15%
J
a
pan Ita
ly
G
e
rm
any
E
u
roar
ea
OE
C
D
C
anada Fra
n
c
e
US UK
Ir
elan
d
year to May 2009, compared to no change in the Eurozone and a decline of 0.7 percent in the EU10.
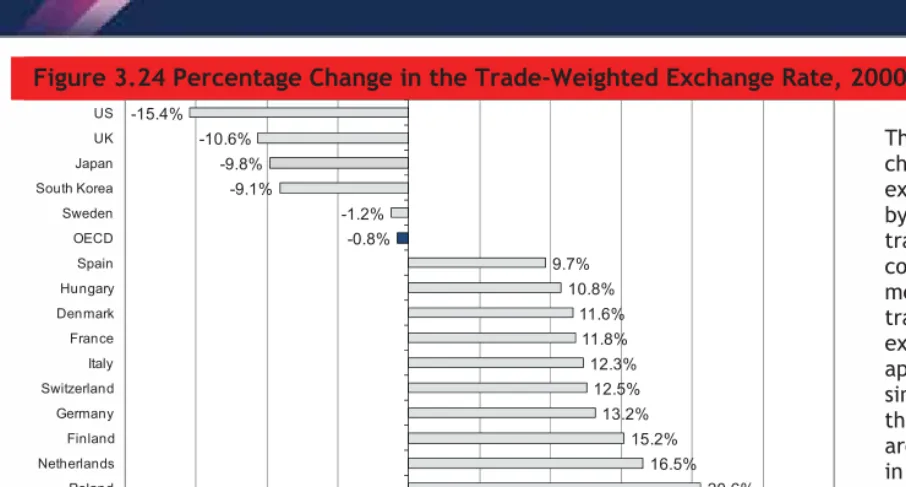
Between January 2000 and April 2008, Ireland experienced a 35 percent loss in its trade-weighted international price competitiveness (Fig. 3.25). Exchange rate movements account for
approximately two thirds of the deterioration in price competitiveness since 2000, while higher inflation in Ireland accounts for the remaining third. Ireland’s current price competitiveness, although weak, has improved; the loss in price competitiveness between January 2000 and June 2009 has fallen to 30 percent. This was supported by both falls in relative prices and favourable exchange rate movement vis-à-vis our key trading partners. However, the collapse in the value of sterling means that many indigenous exporters are under pressure to reduce their costs as they remain dependent on the UK market.
Recent price falls in Ireland are a cyclical response to the downturn nationally and internationally (e.g. falling interest rates, international fuel and food prices) rather than structural changes in the Irish economy or changes in the provision of State provided goods and services. For example, administered services inflation (e.g. public transport, health insurance, education) is projected to average 13.2 percent this year11. In order for the economy to make the necessary transition from a reliance on domestic demand to sustainable export-led growth in the medium term, policies need to facilitate the convergence of Irish costs, charges, professional fees, rents and incomes/wages towards the levels of our trading partners. Ultimately, a quick adjustment in the price level is preferable to a gradual decline over several years. While painful and deflationary in the short term, the alternative is a prolonged period of weak or negative growth, high unemployment and
emigration of many highly educated young Irish people.
1.2.4 Restoring the
Credibility of the Public
Finances is a Major
Challenge
The severe contraction in the housing market (Fig. 4.44 and Fig. 4.45) and the associated negative impact on the labour market (Fig. 3.48 and Fig. 3.57) and consumer and business confidence has led to a sharp deterioration in the health of the public finances.
In 2008, Irish tax revenues fell sharply. Revenues comprised just 26 percent of GNP in 2008 compared to gross voted current
10 The items included in the Harmonised Index of Consumer Prices are a subset of those that make up the CPI. Source: Eurostat.
11 Central Bank of Ireland, Quarterly Bulletin, April 2009.
Figure 1.4: Gross Voted Current Government Expenditure and Exchequer Revenue as a Percentage of GNP in Constant 2006 Prices, 1996-2009F
Source:Department of Finance, Budgetary Statistics,
September 2008, , Macroeconomic and Fiscal Framework, April 2009; CSO, National Accounts
20% 25% 30% 35% 40% 45%
1996 1997 1998 1999 2000 2001 2002 2003 2004 2005 2006 2007 2008 2009 F
government expenditure of 34 percent of GNP (Fig. 1.4). In recent years, Ireland relied heavily on transaction-based property taxes (including stamp duties and value added tax). The collapse of the property bubble has resulted in a sharp decline in revenue from direct property taxes (Fig 4.09) which has recently spread to other taxes. The collapse in revenue and the exposure of the State to the property-related loans of Irish banks is having a detrimental impact on Ireland’s ability to borrow funds at competitive rates.
While Ireland’s net debt remains low at present relative to other developed countries (Fig. 2.06), there are significant concerns about the scale of the Exchequer’s financing requirements at a time when governments around the world are seeking to finance substantial stimulus packages and unprecedented fiscal deficits. While interest payments on Irish Government debt were 3.8 percent of tax revenue in 2008, this is forecasted to rise to 9.4 percent in 2009 reflecting higher borrowing costs, larger debt and lower tax revenues (Fig. 2.09). Although the interest burden will increase substantially over the period 2009-13, it is not expected to exceed the levels experienced in the mid-1990s12.
1.2.5
Evidence of the Impact of the Credit Crises is Mixed
The turmoil in global financial markets and the exposure of Irish banks to bad loans in the declining property sector is affecting Irish firms in terms of their ease of access to finance and its cost. The Government has taken significant steps to restore the credibility of the Irish banking sector and ensure that businesses have access to credit at competitive rates.
While it is not possible to benchmark this phenomenon relative to other countries due to a lack of data, survey evidence suggests that access to finance is a significant competitiveness threat to Irish enterprises. The available evidence on the impact of the banking crisis on access to (and cost of) credit is mixed.
The Mazars review of lending examined both the demand for credit by SMEs and the supply of
credit by five banks13. The survey of over 1,000 SMEs found that 24 percent of those who applied
for credit were refused credit by a bank. The examination of the supply of credit by the five banks found that 14 percent of applications for credit were declined. The difference in the decline rates results largely from a difference in the perceptions between banks and SMEs as to what represents an application for credit. According to the survey of SMEs, decline rates vary significantly by sector, size of firm and individual bank; the highest levels of decline were in the real estate, construction and low end manufacturing sectors and for micro enterprises14.
Data from the Central Bank indicates that excluding property related lending and financial intermediation, overall lending declined by 1.4 percent in the year to March 2009, compared to an annual increase of 12.5 percent in the year to March 2008.
12 The equivalent figure was 26.7 per cent when the NTMA was established in 1990. Source: National Treasury Management Agency, Annual Report 2008, July 2009.
13 Mazars, Review of Lending to SMEs, June 2009. The examination of demand for credit was conducted in June 2009 and the examination of the supply of credit focused on the period June 2008 to February 2009.
According to the Mazars review, a range of factors have contributed to reduced borrowing:
While formal bank credit policy has remained largely unchanged, the application of credit policy has changed and has resulted in a much more cautious approach to lending, with an increased level of emphasis on both personal guarantees and levels of security apparent in the majority of banks;
There were some changes to credit pricing over the period, primarily driven by increases in the cost of funds to banks and a reduction in competition for new business in certain cases. The overall cost of new credit facilities (as distinct from existing credit) to SMEs in February 2009 had decreased, compared to June 2008; and
The quality of the SME loan book as measured by bank credit grading systems deteriorated significantly in the period under review. Approximately 22 percent of loans to SMEs were either “on watch” or “impaired” at the end of February 2009, representing an eight percentage point deterioration compared to June 2008. If this trend were to continue, the ability of SMEs to secure credit would be further impacted.
It is critical that measures are progressed without delay to ensure that the success of viable businesses is not hindered by tightening credit standards or very high costs of capital.
1.2.6 Growing Unemployment Presents a New Long-term Challenge
The number of people in employment fell below two million in 2009 Q1 to 1,965,600, representing an annual decrease in employment of 158,500 or 7.5 percent. This represents the largest annual decrease in employment since the labour force survey was first undertaken in 1975. In detail, there were 86,700 fewer jobs in construction in 2009 Q1 compared to the peak in 2007 Q1 (Fig. 3.52). Related sectors such as architecture, solicitors and real estate have also been affected by the construction job losses. Annual decreases in employment were also recorded in 2009 Q1 in agriculture, forestry and fishing (-14,200, -12.1 percent), hotels and restaurants (-12,800, -9.8 percent), wholesale and retail trade (18,200, 9.6 percent) and manufacturing industry (19,500, -6.8 percent). Sectors showing an increase in employment include education (+11,800, +8.5 percent) and health (+2,200, +1.0 percent).
Exporters are also experiencing job losses. Total permanent full-time employment in development agency-assisted companies amounted to 297,098 in 2008. This is a decrease of 8,938 jobs (-2.9 percent) on employment levels in 200715. Consolidation and reviews of global operations by
multinational corporations in response to reduced global demand may result in further employment losses in 2009/2010 across a range of sectors and occupations.
The deterioration in economic activity has led to record levels of unemployment. The numbers of people unemployed has increased sharply from the start of 2008. Unemployment in Ireland is now significantly above the OECD average and above the average of many larger EU economies (Fig. 3.57). The standardised unemployment rate (derived from the CSO Live Register) estimates
unemployment at 11.9 percent for June 200916. This compares with 10.2 percent in 2009 Q1 (QNHS).
A downward trend in full-time employment and increase in part-time employment may also indicate a shift in working arrangements for many people such as reduced hours or working days. Part-time employment increased by 17,700 in the year to 2009 Q1 while the number in full-time employment fell by 176,200 on an annual basis. This situation looks likely to deteriorate further as 2009
progresses. The ESRI forecasts that the unemployment rate will increase to 12.6 percent in 2009 and 16.1 percent in 201017.
While the downturn is affecting people across all of society, certain groups are particularly exposed. These include:
Younger workers: In 2009 Q1, the unemployment rate for 15-19 year olds was 25.6 percent, and
for 20-24 year olds it was 17.8 percent, compared to 10.2 percent for the total population18.
Lower skilled workers: The available evidence suggests unemployment and educational
attainment are closely linked.
During 2007 Q1 - 2009 Q1, unemployment increased from 7.3 percent to 15.8 percent for those with lower secondary education in comparison to an increase from 2.4 percent to 5.4 percent over the same period for those with a third level degree (Fig 1.5).
High levels of unemployment, particularly among younger and lower skilled workers highlight the importance of ensuring that the unemployed remain as close
to the labour market as possible. This link between employment prospects and skill levels also points to the urgency of re-training the newly unemployed/workers who lack basic qualifications with new skill sets where there are likely to be employment opportunities in the future. Developing long-term policies (education and training, social welfare, new business start-ups, etc.) to address Ireland’s growing unemployment problem is a major challenge.
16 The Live Register includes part-time workers (those who work up to three days a week), seasonal and casual workers entitled to Jobseekers Benefit or Allowance. It is not designed to measure unemployment. Unemployment is measured by the Quarterly National Household Survey. The Live Register has established itself as a “headline" measure of unemployment though its short-coming are numerous. For instance, persons working a three-day week and lawfully claiming unemployment support for the remaining two days are counted on the register. Those engaged in home-duties or care for the elderly may appear on the register, while conversely a person who is effectively unemployed may be excluded on the grounds of eligibility/administrative requirements.
17 ESRI, Quarterly Economic Commentary, Summer 2009. 18 CSO, QNHS, June 2009.
Figure 1.5 Unemployment (%) by Educational Attainment, 2007 Q1 – 2009 Q1
Source: CSO, QNHS 0%
2% 4% 6% 8% 10% 12% 14% 16% 18%
2007 Q1 2007 Q2 2007 Q3 2007 Q4 2008 Q1 2008 Q2 2008 Q3 2008 Q4 2009 Q1
Lower secondary Higher secondary
Post leaving cert Third level degree or above
1.2.6
A Return to High Levels of Outward Migration is a Key Risk
Ireland's labour force has grown significantly in recent years, driven by both natural increases in the Irish-born population and inward migration (Fig 3.48, 3.54 and 3.55). However, net migration has been falling since 2007 (Fig 3.54). The ESRI has forecast net outward migration of 30,000 people in 200919. The discretionary repatriation of unemployed migrants reflects the flexibility of Ireland’s labour market, i.e. inflows of workers in times of skills deficits and outflows in times of increasing unemployment.
The quality of our workforce remains a key competitiveness strength of Ireland so it is important that migration outflows do not result in a loss of the skills that are critical for future economic growth. Ireland has made significant progress over time and relative to other countries in terms of increasing educational attainment (Fig. 4.56). Ireland’s increasing supply of highly skilled graduates can enable firms to take advantage of new business opportunities in internationally trading
manufacturing and services sectors in the future.
Labour markets in most developed economies are deteriorating and traditional emigration
destinations for Irish talent may be unattractive at present. Nonetheless, it remains imperative for Ireland’s medium-term economic potential to keep the best-educated generation of Irish young people at home and available to take advantage of the inevitable global recovery. Policies designed to restore competitiveness swiftly and sustain employment are the best means of ensuring that Ireland retains the competitive advantage embedded within its highly educated and relatively young population.
1.2.8
Prioritising Infrastructure Investment is Becoming More Critical
In recent years, Ireland has invested substantially to address a range of
infrastructural deficits (Fig. 4.28) and has made some progress in addressing these (Fig. 4.30 and Fig. 4.32).
The deterioration in the public finances and the need for fiscal consolidation will negatively affect the State’s ability to invest in critical infrastructure at the same level over the coming years. There is also a risk that the stock of skills and
19 ESRI, Quarterly Economic Commentary, Summer 2009.
Figure 1.6: Direct Exchequer Capital Expenditure, All Votes, (€millions and percentage of forecast GNP)
Source: Macroeconomic & Fiscal Framework, Supplementary Budget, April 2009
7,329
(5.1%) 6,621
(4.7%)
5,491
(3.8%)
6,000
(3.9%)
6,000
(3.7%)
€4,000 €5,000 €6,000 €7,000 €8,000
capabilities accumulated under the NDP in terms of designing and building infrastructure will be weakened or lost. However, the downturn also provides opportunities to deliver infrastructure on schedule and at a lower cost, and the time to plan and deliver our infrastructure needs in a more coordinated fashion.
Given the sharp reductions in capital expenditure until 2013 announced in the April 2009
supplementary budget (Fig. 1.6), a rapid review of the investment priorities identified in the NDP is needed. The prioritisation of key projects (or parts of projects) inevitably requires the
postponement of other projects.
Enhanced infrastructure capacity and quality is crucial to long-term economic prosperity – priority areas include transport (Fig. 4.30), energy infrastructure (Figs. 4.34 – Fig. 4.36) environmental infrastructure such as water and waste (Fig. 3.40 and Fig. 3.41) and advanced broadband access (Fig. 4.38 and Fig. 4.39).
1.2.9 While Painful, the Irish Economy is Adjusting to New Realities
Following the bursting of the property bubble, economic activity in Ireland is weakening from historic highs. Construction and related activity is falling with severe implications for economic growth, unemployment, investment, consumer confidence and demand and government revenues. While Ireland’s exporting
sectors are performing relatively well in terms of exports and employment retention, it is unlikely that the Irish economy will return to growth in the near future.
However, the economy is adjusting to the current crises. Measures are being taken to address our fiscal and banking challenges. From a competitiveness
perspective, Ireland’s cost competitiveness is showing signs of improvement after
many years of deterioration. Growing employment and reducing unemployment now present a major and long term policy challenge for Ireland.
The balance on the current account of the balance of payments is a useful summary indicator on Ireland’s adjustment process. In simple terms, the current account measures national income less
Figure 1.7: Balance of Payments, Current Account Balance, (€ Millions), 2000-2010F
Source: Forfás Calculations; Central Statistics Office, Balance of Payments; ESRI, Quarterly Economic Commentary, Summer 2009
-11,000 -10,000 -9,000 -8,000 -7,000 -6,000 -5,000 -4,000 -3,000 -2,000 -1,000 0 1,000 2,000 3,000
2000 2001 2002 2003 2004 2005 2006 2007 2008 2009 F 2010F
€
M
illio
n
expenditure20. Between 2003 and 2007, a significant current account deficit emerged (Fig. 1.7),
meaning that Ireland was borrowing heavily internationally to pay for domestic consumption and investment. The significant improvement in Ireland’s trade balance has improved Ireland’s current account balance, which is forecast to move into surplus in 2010.
While the Government is increasing its liabilities to foreign lenders, the available evidence suggests Irish households and private companies are repairing their balance sheets and reducing their debts (for precautionary reasons). While this is currently reducing demand and investment in the
economy, a rapid reduction in the current account deficit indicates that Irish firms and households are adjusting quickly to more sustainable funding structures with reduced imports, borrowing and liabilities to foreign lenders. In the longer term, it suggests, should current trends continue, that the Irish economy will be in a better position for sustainable export-led growth than in the previous period of the construction and debt-fuelled property bubble.
1.2.10 Restoring Ireland’s Reputation as an Attractive Location for Enterprise
The Irish economy has undergone dramatic changes in the last 18 months. Many of these changes are the result of unanticipated global shocks. However, some of these changes have been specific to the Irish economy; our over reliance on the construction sector and consumer spending has left us particularly vulnerable. It is essential that Ireland implements a credible and widely supported programme to restore the sustainability of the public finances, ensure that banks are channelling credit to viable businesses, address the unemployment crisis which has emerged and to achieve a swift and widespread decline in the cost of doing business in Ireland relative to our trading partners.
As a small open economy, that is highly dependent on trade and investment, rebuilding our international reputation will be an important element of economic recovery. While the decline in economic activity is worrying and has painful consequences in terms of individual living standards, Ireland should focus on building upon the strengths of our economy, which remain considerable despite the ongoing recession.
1.3 Summary of the Report
Competitiveness refers to the ability of firms to compete in markets. Ireland’s national
competitiveness refers to the ability of the enterprise base in Ireland to compete in international markets. The NCC uses a competitiveness pyramid to outline the framework within which it assesses Ireland’s competitiveness (Figure 1.08). At the top of the pyramid is sustainable growth in living standards – the fruit of past competitiveness success. Below this are the essential conditions for achieving competitiveness, including business performance (such as trade and investment), productivity, prices and costs and labour supply. These can be seen as the metrics of current
competitiveness. Lastly, there are the policy inputs covering three pillars of future competitiveness, namely the business environment (taxation, regulation, finance and social capital), physical
infrastructure and knowledge infrastructure. These are addressed in turn.
1.3.1 Sustainable Growth
Competitiveness is not an end in itself, but is a means of achieving sustainable improvements in living standards and quality of life. This section benchmarks Ireland’s performance regarding this desired outcome, under three headings: national income, quality of life and environmental sustainability.
National Income
High and rising living standards are a key measure of the success of national competitiveness. The indicators in this section cover the level, growth and distribution of Ireland’s national income. Although GNP per capita declined rapidly in the second half of 2008 and will continue to do so in 2009, GDP levels remain relatively high. Irish output per capita (GDP) is now among the highest in the EU. Irish income per capita (GNP), a better measure of Irish living standards, is marginally above the EU-15 average (Fig. 2.01).
Figure 1.08 The NCC Competitiveness Pyramid
Irish economic growth rates (in both GNP and GDP terms) were higher than the EU-15 average over the period 2004-2008 (Fig 2.02). However, GDP fell by 2.3 percent and GNP by 3.1 percent in 200821. The ESRI is forecasting a 7.9 percent decline in GDP and an 8.9 percent decline in GNP in 2009. This compares poorly with the US (-2.6 percent) the UK (-4.2 percent) and the eurozone (-4.8 percent)22.
The contribution of Ireland’s exporting sectors to economic growth was weak during the 2004-2006 period but net exports increased in 2007 and 2008, driven mainly by growth in services exports (Fig. 2.03). Given the negative outlook for global demand, the decline in world trade volumes and the planned closure of some manufacturing plants, the ESRI expects exports to decline by 3.9 percent in 2009 and 1.4 percent in 201023.
There has been a significant deterioration in Ireland’s general government balance (budget balance) as a percentage of GDP which is forecasted to remain in deficit until at least 2013 (Fig. 2.05). Ireland’s general government consolidated debt as a percentage of GDP has risen sharply since the end of 2007. However, Irish government debt as a percentage of GDP is significantly lower than the EU-15 average (Fig. 2.06).
Irish government debt is now considered more risky than that of countries such as Spain, Italy and Portugal by international investors (Fig. 2.07 and 2.08). The Irish government is paying a significant premium in terms of interest on its debt. Irish payments on national debt will rise substantially in the coming years. In 2008, interest payments accounted for 3.8 percent of tax revenue but are forecast to rise to 9.4 percent in 2009 (Fig 2.09).
The current account of the Balance of Payments is forecast to improve significantly in 2009 following the lowest deficit in four years in 2008 Q4. The ESRI forecasts a narrowing of the current account deficit from 6.1 percent of GNP in 2008to0.9 percent in 2009 and a surplus of 1.7 percent in 2010 (Fig. 2.10).
While the savings ratio of Irish households remained relatively constant over the 2000-2007 period, it increased rapidly in 2008 to 10.6 percent which is double the 2007 ratio (Fig. 2.14). The increase in the Irish savings ratio has been more dramatic in comparison to other countries. In the short term, this consolidation of Irish household balance sheets is having a negative impact on consumption (a component of GDP) and business confidence.
Quality of Life
A key objective of competitiveness is to support a high quality of life, which is broader than material living standards. Ireland’s performance in the Human Development Index, which measures economic, educational and health outcomes, is very strong. Ireland ranked fifth in 2006, an
improvement of 13 places since the 2000 report (Fig. 2.15), driven by strong economic growth and improvements in educational attainment. Life expectancy for both men and women in Ireland has
21 CSO, Quarterly National Accounts, March 2009. 22 IMF, World Economic Outlook, July 2009.
also improved since 1990, and is now just above the OECD average (Fig. 2.16). In 2007, the average national house price peaked at €311,078 or just over 10 times average industrial earnings. Housing affordability improved during 2008 and is forecast to improve further during 2009 as house prices continue to fall (Fig. 2.18).
Environmental Sustainability
The essence of environmental sustainability is a stable relationship between human activities and the natural world, one that does not diminish the prospects for future generations to enjoy a quality of life at least as good as our own.
Ireland’s performance in relation to environmental sustainability remains mixed. The composite environmental performance index ranks Ireland 20th in the OECD (Fig. 2.19). Ireland clearly faces challenges. Ireland is one of the highest carbon emitters on a per capita basis in the OECD. In addition, Ireland’s share of energy coming from renewable sources is less than half that of the OECD average (Fig. 2.20). However, Ireland is the least energy intensive country in the EU-15 (Fig. 2.22).
At a sectoral level, while most sectors reduced their share of final energy use between 1990 and 2007, transport's share increased significantly from 28 percent to 43 percent (Fig. 2.21). The current economic slowdown is leading to a fall in emissions across all sectors, which is expected to result in Ireland achieving its Kyoto targets. While waste recycling rates have increased significantly, Ireland remains highly reliant on landfill, the least preferred waste treatment option from an environmental perspective (Fig. 2.23).
1.3.2 Ireland’s Competitiveness Performance (Essential Conditions)
Ireland’s national competitiveness is founded on certain key conditions to support a conducive and sustainable economic environment. This section benchmarks Ireland’s performance regarding four essential conditions:
The performance of Ireland’s businesses in terms of investment and trade; Ireland’s productivity and innovation performance;
Ireland’s prices and costs structure; and
Labour supply.
Business Performance
The performance of the business sector is critical to maintaining incomes and employment levels in Ireland. Its strength is also essential to rebuilding government finances and maintaining spending on public services.
pipeline remains relatively strong. Irish firms have also been increasingly investing overseas in recent years, with Irish stocks of outward direct investment among the highest in the OECD in 2007 (Fig. 3.05).
Trade: Ireland continues to be one of the most open economies in the OECD. Growth in total Irish exports (goods and services) slowed during the 2004-2008 period. Ireland’s share of merchandise trade has fallen gradually, while our share of services trade grew in 2008 - driven by computer services, business services and royalties (Fig. 3.07-3.09). Ireland’s manufacturing sectors have had a mixed performance. While Ireland's share of the pharmaceutical and chemicals sectors has remained strong (Fig. 3.09), Ireland’s share of office/ telecommunications equipment and machinery/transport equipment has fallen.
Productivity and Innovation
In the long run, a country’s standard of living depends on its productivity performance. As innovation is a key driver of productivity, it is also assessed.
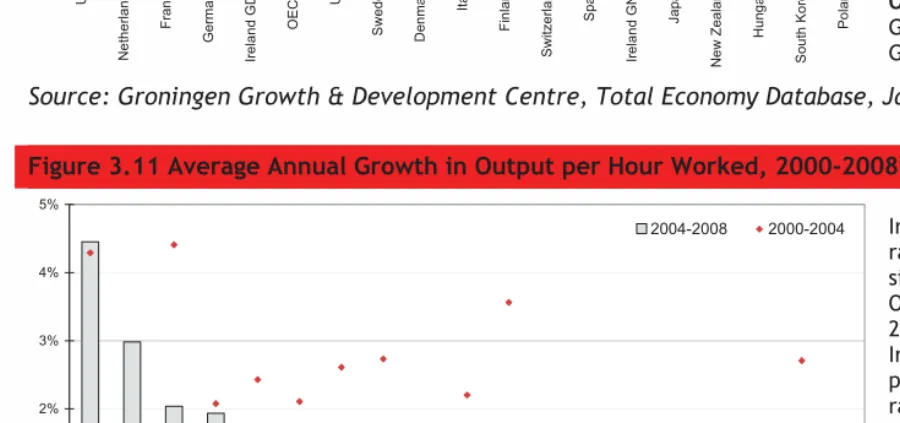
Productivity: Ireland's productivity levels in GDP terms are now on a par with the OECD average. However, Ireland’s productivity levels in GNP terms – a more realistic measure - are below the OECD average (Fig. 3.10). Growth rates of productivity, rather than levels, are vital to ensuring wage levels are sustainable and in this regard, Ireland performed poorly between 2004 and 2008 (Fig. 3.11).
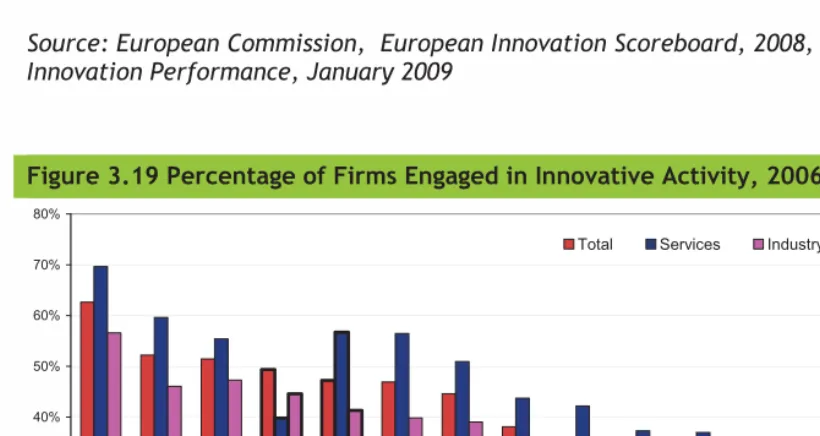
Innovation: Ireland’s innovation performance continues to improve and its score on the summary innovation index is above the 15-EU average (Fig. 3.18). Irish firms are marginally less likely to be engaged in innovation (i.e. the creation of new products, services, or processes) than the EU average. The innovation gap between Irish industry and services sectors (at over 15 percent) is significant (Fig. 3.19). In terms of outputs, Ireland’s performance is below the EU average in terms of ‘new to firm’ innovation contributing to turnover but above the EU average in terms of the contribution of ‘new to market’ innovation (Fig. 3.20).
Prices and Costs
Cost competitiveness is critical to ensuring that companies based in Ireland have the ability to compete successfully in international markets. This section examines the overall level and rate of change in Ireland’s prices and business costs, across both pay and non-pay indicators. The relevant indicators are detailed in Chart 3.C.
clothing, transport, housing and utilities are seeing considerably larger declines in Ireland than in the Eurozone (Fig. 3.23). However, administered prices continue to grow quickly.
Between January 2000 and April 2008, Ireland experienced a 35 percent loss in international price competitiveness (real HCI) (Fig. 3.25). Exchange rate movements account for
approximately two thirds of the deterioration in price competitiveness since 2000, with higher inflation in Ireland accounting for the remaining third. Ireland’s price
competitiveness, although weak has improved. The loss in price competitiveness between January 2000 and June 2009 has narrowed marginally to 30 percent (real HCI). This was supported by both falls in relative prices and favourable exchange rate movement vis-à-vis our key trading partners. However, the collapse in the value of sterling means that many indigenous exporters are under pressure to reduce their costs as they remain dependent on the UK market.
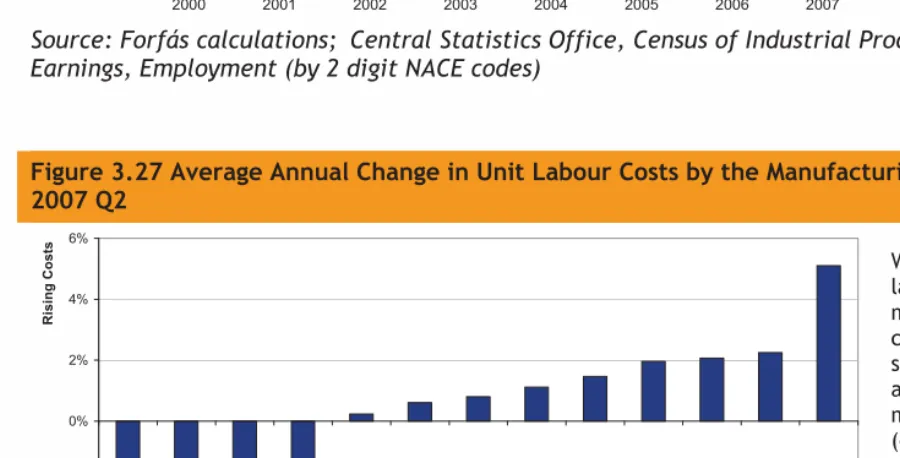
Pay Costs: Unit labour costs, the ratio of changes in productivity to earnings, show little change for the manufacturing sector over the 2000-2007 period (Fig. 3.26). Labour cost growth rates show the change in the cost of employing workers over time. Ireland’s growth rates exceeded the EU-15 average between 2004 and 2007. However, growth rates in Irish labour costs slowed significantly in 2008 and were lower than the EU-15 average (Fig. 3.28).
Non-Pay Costs: Non-pay costs in Ireland compare poorly with other countries across a range of business inputs. These include utilities (electricity, mobile communications and waste) and a range of services, such as accountancy, information technology and legal services fees (Figs. 3.35-3.44). Certain categories of non-pay costs have fallen in 2008/09, in particular the cost of purchasing and renting retail and industrial property.
Labour Supply
Growth in labour supply has played a key role in Ireland’s economic development over the past decade. Ireland's labour force has grown in recent years, driven by both natural increases in the Irish-born population and inward migration (Fig 3.48, 3.54 and 3.55). However, the numbers unemployed have been rising rapidly since 2008 Q1 (Fig. 3.48) while net migration into Ireland has been falling since 2007 (Fig. 3.54).
Numbers unemployed remained relatively constant until 2008 Q1, at which point, they began to increase (Fig. 3.48). While unemployment is increasing in many countries, Ireland’s unemployment rate is now significantly above the OECD average (Fig. 3.57). According to the CSO Live Register, unemployment reached 11.9 percent in June 200924. Employment levels across all sectors of the Irish economy have fallen dramatically in 2008, particularly in the construction, industry and
accommodation and food sectors (Fig. 3.51 and Fig. 3.52). The ESRI forecast that the unemployment rate will increase to 12.6 percent in 2009 and 16.1 percent in 201025.
The rate of unemployment has increased more rapidly for workers with lower educational
attainment (Fig. 3.58). In addition, younger workers have experienced more dramatic increases in unemployment compared to older, more experienced workers (Fig. 3.59). The regional variance in the unemployment rate ranges from 6.3 percent in Northern Ireland to 11.7 percent in the Midlands region (Fig. 3.60).
There has been a dramatic fall in net migration since 2007, driven by rising unemployment (Fig. 3.54). The ESRI has forecast net outward migration of 30,000 for 2009. While Ireland's overall demographic position is among the healthiest in the OECD, Ireland will also face an ageing population into the medium term (Fig. 3.61).
1.3.3 Drivers of Future Competitiveness (Policy Inputs)
Ireland’s future competitiveness will depend heavily on decisions made today in key policy areas that affect Ireland’s business environment, physical and knowledge infrastructures.
Business Environment
The business environment has a significant impact on a country’s economic performance and competitiveness. This section illustrates Ireland’s relative performance on taxation, regulation and competition, labour market regulations, finance and social capital are assessed.
Taxation: There has been a sharp drop in tax revenues in Ireland in 2008 and 2009. Tax revenues comprised just 26 percent of GNP in 2008 compared to gross voted current government expenditure of 34 percent of GNP (Fig. 4.01 and Fig. 4.02). Ireland's tax structure is much less dependent on social security contributions than elsewhere in Europe, raising over 80 percent of revenue instead from direct and indirect taxation (Fig. 4.03). Taxes on both capital (profits) and labour (wages) are low relative to other countries, while the tax take from corporations is above the OECD average (Figs. 4.05-4.07).
Ireland’s total Exchequer revenue has become less reliant on income tax receipts over the period 1998-2007, though this will change following the increases in income and health levies introduced in the supplementary budget in April (Fig. 4.04). In recent years Ireland has relied heavily on transactions-based property taxes (including stamp duties and value added tax). The collapse of the property boom has resulted in a sharp decline in revenue from property related taxes from €6.8 billion in 2006 to €3 billion in 2008 (Fig 4.09). Ireland does not tax pollution directly, unlike some other countries (Fig. 4.10).
Regulation and Competition: The general regulatory environment in Ireland is perceived to be relatively strong (Fig. 4.15). Many of Ireland’s most important internationally trading sectors (e.g. pharmaceuticals, medical devices, fund administration, software) depend on a strong regulatory environment in terms of IP protection, production and health quality standards. The regulatory environment also supports entrepreneurship as the financial and administrative costs of starting a business in Ireland are low compared to other countries (Fig. 4.16). In relation to domestic competition, while competition legislation is perceived to be relatively efficient, incumbents still dominate the market in certain utilities - particularly in electricity and communications (Figs. 4.18 - 4.20). Ireland’s protection of intellectual property has improved significantly in recent years, and is now above the OECD average (Fig. 4.22).
Labour Market Regulation: According to executives’ opinions, labour market regulations in Ireland are not believed to have a significant impact upon business activities. Most
countries, including Ireland, have experienced increased labour market regulations since 2000 (Fig. 4.23). The employment framework in Ireland is considered less rigid than the OECD average (Fig. 4.24). The minimum wage in Ireland is significantly higher than the majority of comparator countries (Fig. 4.25).
Physical and Economic Infrastructure
The level of infrastructure in a country affects competitiveness in a number of ways. Well
developed infrastructure can increase mobility of workers and goods, reduce traffic congestion and increase productivity. This not only affects existing firms, but also affects a country’s attractiveness as an investment location and general quality of life. In this section, indicators that illustrate Ireland’s relative performance are grouped under four headings:
x Investment in Physical Infrastructure;
x Transport and Energy Infrastructure;
x Information and Communications Technology Infrastructure; and
x Housing.
Investment in Physical Infrastructure: Under successive National Development Plans, Ireland's investment rates in the public capital stock have been among the highest in the EU (Fig. 4.28). However, perceptions of infrastructure quality remain low (Fig. 4.29). Due to the severity of the collapse in the public finances, NDP investment projects will have to be reprioritised. The supplementary budget set out a multi-annual framework for capital expenditure which forecasts gross voted capital expenditure would be 5.1 percent of GNP in 2009 – this will decline to 3.7 percent in 2013.
Transport and Energy Infrastructure: Ireland's distribution networks rank poorly
infrastructure are poor (Fig. 4.34). Ireland is particularly dependent on imported and non-renewable forms of energy (Fig. 4.35 and Fig. 4.36).
Information and Communication Technology Infrastructure: Ireland's investment in both information and communications technologies is below the EU-15 average, and lags leading countries by some distance (Fig. 4.37). Despite strong growth, the penetration rate of broadband across both households and small firms in Ireland is below the EU average (Fig. 4.38). Ireland ranks 25th in the OECD in terms of its readiness to support next generation services(Fig. 4.39). In terms of eGovernment, the proportion of public services available online is also below that of the EU-15 average (Fig. 4.40).
Housing: There are two aspects to housing that are relevant to competitiveness:
infrastructure/construction activity and costs/debt. In relation to relative levels of housing, Ireland has fewer houses per capita than the EU-15 average (Fig. 4.41). This gap was
narrowing as household completions per capita in Ireland were far higher than the EU average in recent years. Several developed economies have experienced substantial housing booms in recent years, which is a key contributing factor to the global economic crisis (Fig. 4.44 and Fig. 4.45). Irish house prices increased dramatically during the early 2000s (Fig. 4.44). However, Irish house prices have fallen by 21 percent between the peak of the boom in February 2007 and May 2009. The value of Irish housing stock, which was valued at €500 billion in 2007, has fallen significantly since house prices peaked in February 2007.
Household borrowing (approximately three-quarters of which is for house purchases) nearly doubled between 2004 and 2008. The average Irish person was €36,662 in debt in 2009 Q2, the second highest level in the Eurozone (Fig. 4.43).
Knowledge Infrastructure
Education, training, skills and research and development form key parts of a nation’s infrastructure for generating knowledge and high value economic activity. This section assesses Ireland’s
performance in this area.
Education
Average educational attainment in Ireland has increased steadily in the last two decades, with younger workers better qualified than their OECD counterparts. Older workers in Ireland remain less qualified than the OECD average and a relatively large share of the working age population (34 percent) has no more than lower secondary education (Fig. 4.46). Expenditure per student is below the OECD average at all levels while pre-primary education is predominantly privately funded, unlike that in other countries (Fig. 4.47 and Fig. 4.48).
Pre-Primary and Primary Education: Participation of three year olds in education in Ireland is low and well below the EU-15 average (Fig. 4.49). At primary level, while the average number of hours of tuition received by 9-11 year olds is among the highest in the OECD, the amount of time spent on the key skills of mathematics and science is 14th and 18th
Secondary Education: Ireland has made significant progress over time and relative to other countries in terms of increasing secondary school participation rates (Fig. 4.51and Fig. 4.52). The average number of hours of tuition received by 12-14 year olds is among the lowest in the OECD. Of the 22 countries surveyed, students in Ireland receive the third lowest amount of tuition time in science (Fig 4.53). In the latest OECD PISA (Programme for International Student Assessment) study, Irish 15 year olds ranked well among OECD
countries in terms of reading literacy (5th) but less well in terms of scientific literacy (14th) and mathematical literacy (16th) (Fig. 4.54). Ireland’s scientific literacy ranking has fallen
five places since 2000. The number of computers per student is also relatively low in Ireland compared to other EU countries (Fig. 4.55).
Tertiary Education and Life-Long Learning: Ireland's younger population is considerably better qualified than older workers, with 42 percent of the 25-34 year age group possessing a third-level qualification. This compares very favourably with the OECD average of 34 percent (Fig. 4.56). Ireland performs well in terms of producing graduates in the fields of mathematics, science and computing per 1,000 of population aged 20-29 (Fig. 4.58). However, in Ireland science and computing graduates dominate this category, which means that Ireland is producing a limited supply of mathematics focused graduates. Irish
institutions are not as successful as their counterparts in other English-speaking countries in terms of attracting international students (Fig. 4.60). Life-long learning comprises all learning activity undertaken throughout life, with the aim of improving knowledge, skills and competencies. Adult participation in life-long learning remains relatively low in Ireland - below both the EU average and Lisbon target (Fig. 4.61).
Research and Development Infrastructure: Despite a large increase in R&D expenditure, Ireland has so far made limited progress towards its target of 2.5 percent of GNP by 2013. Total R&D spending in Ireland increased from 1.26 percent of GNP in 2000 to 1.68 percent of GNP in 2008 (Fig. 4.62). This compares with an OECD average of 2.38 percent (2007). The number of researchers in Ireland is also growing, up from five researchers per 1,000 total employment in 2000 to six per 1,000 in 2006 (Fig. 4.63). Despite strong growth rates in expenditure, business R&D as a percentage of economic activity has remained relatively static over the past decade. Most business expenditure on R&D in Ireland is undertaken by foreign-owned companies (Fig. 4.64). Finally, the number of PhD graduates per 1,000 of population in 2006 was greater than the EU-13 average in 2007 due to an increased domestic output and inward migration (Fig 4.66).
1.4 Methodology and How to Read This Report
Methodology
The rest of this report is divided into three main sections, sustainable growth (chapter 2), essential conditions for competitiveness (chapter 3) and policy inputs (chapter 4), which correspond to the various components of the competitiveness pyramid. This report uses internationally comparable metrics, with the OECD, the EU, the UN and the WTO, as the sources for the majority of indicators. Indicators from specialist international competitiveness bodies (e.g. from the WEF’s Global
further depth is of benefit, national sources such as the Central Bank, the CSO, the ESRI and Forfás are used.
Ireland’s performance is benchmarked against 17 other countries. Countries have been chosen to provide a mix of Eurozone members (Finland, France, Germany, Italy, the Netherlands and Spain), other non-Eurozone European countries (Denmark, Sweden, Switzerland and the UK), and two newer EU member states (Hungary and Poland). Five non-European countries (Japan, South Korea, New Zealand, Singapore and the US), who are global leaders or are of a similar size or pace of
development to Ireland, are also included. This allows for a detailed comparison between Ireland and many of its closest trading partners and competitors. Ireland is also compared to a relevant peer group average, the OECD-28, EU-15 or Eurozone average where possible or else compared to as wide a group of countries as possible26. Averages are weighted by each country’s population or GDP average where relevant.
Benchmarking competitiveness is useful - it informs the policymaking process and raises awareness of the importance of national competitiveness to Ireland’s wellbeing. Nonetheless, there are limitations to benchmarking:
While every effort is made to ensure timeliness of the data, there is a natural lag in collating comparable official statistics across the selected countries. There are also factors that are difficult to benchmark (e.g. the benefit of being in the GMT time zone or of speaking English fluently);
Secondly, given the different historical contexts and economic, political and social goals of various countries, and their differing physical geographies and resource endowments, it is not realistic or even desirable for any country to seek to outperform other countries on all measures. There are no generic strategies to achieve national competitiveness; and
Finally, it is important to note that trade and investment between countries is not a zero-sum game; economic advances by other countries can, in aggregate terms, lead to improvements in living standards for the Irish population.
Interpretation of the Charts
We have endeavoured to ensure that all charts are self-explanatory. However, with reference to the sample chart in figure 1.08, the following points may be of value when interpreting the charts:
Figure 1.08: Sample Chart
Figure 2.01 Levels of GDP per capita at Current Prices (€000 PPPs), 2009F
In terms of GDP per capita, Ireland ranks as one of the wealthiest countries in the EU. In terms of GNP per capita, a better measure of national income, Ireland ranks slightly above the EU-15 average.
However, GNP per capita declined rapidly in the second half of 2008 and this is
expected to continue in 2009.
EU-15 Ranking:
GDP: 2 (Ĺ3) GNP: 10 (Ĺ1)
Source: Eurostat, Economy and Finance
The best performing country is located at the left of the chart (in vertical bar charts) or at the top of the chart (in horizontal charts). In a limited number of charts, it is not possible to designate a best performer.
In charts that assess output/income or other factors relative to these, Irish figures are provided in GDP and GNP terms. GDP (national output) is significantly greater than GNP (national
income) in Ireland due to the repatriation of profits and royalty payments by multinational firms based here. Other countries are assessed in GDP terms.
The text at the right of the chart provides additional information and commentary on Ireland’s performance across each indicator.
The majority of chart titles are given a traffic light colour, green, orange or red, in order to provide a general indication of Ireland’s performance. Green indicates a strong performance (top third of OECD-28, EU-15, or comparator group), orange signals an average performance, while red means that Ireland is ranking within the bottom third of the OECD-28, EU-15, or comparator group. Certain indicators, which are not ranked, are also given a traffic light colour, in which case the colour is determined (somewhat subjectively) based on Ireland’s performance over time.
Rankings are provided where appropriate, but in a limited number of charts, it is not possible to designate a best performer - these chart titles are coloured grey.
x In interpreting the ranking for each indicator, a low ranking (i.e. close to 1st) implies a healthy competitiveness position, while a high ranking implies an uncompetitive position.
x Changes in rankings refer to the change in Ireland’s position, generally since 2000. Exceptions to this base year are highlighted in footnotes.
x ( ) refers to an improvement in Ireland’s competitive position, so 4 means an
improvement of four places in Ireland’s ranking. (--) means that there has been no change in Ireland’s ranking, while ( ) refers to a fall in ranking.
Summary charts are also placed at the start of each major section. They follow the same principles as above with respect to rankings and the traffic light system.
€0 €5,000 €10,000 €15,000 €20,000 €25,000 €30,000 €35,000 €40,000 €45,000
Ne
th
e
rla
n
d
s
US
Sw
it
z
e
rl
a
n
d
Ir
el
an
d
J
apa
n
S
w
e
den UK
De
n
m
a
rk
Fin
la
n
d
Ge
rm
a
n
y
Ir
el
an
d
G
N
P
EU
1
5
It
a
ly
Fr
a
n
c
e
Sp
a
in
Hu
n
g
a
ry
Po
la
n
d
2. Sustainable Growth
Competitiveness is not an end in itself, but is a means of achieving sustainable improvements in living standards and quality of life. This section benchmarks Ireland’s performance regarding this desired outcome, under three headings: national income, quality of life and environmental sustainability. Chart 2.A summarises the indicators that are benc