University of Twente
Faculty of Psychology
EVALUATION OF CREATIVITY
Bachelor thesis
Merijn Besselink
s1363751
June 2016
First mentor: Prof. Dr. F. van der Velde
2
Evaluation of Creativity Merijn Besselink s1363751
Contents
Abstract ... 3
Introduction ... 3
Method ... 10
Participants ... 10
Materials ... 12
Design ... 13
Procedure ... 15
Analysis ... 16
Results ... 16
Discussion ... 27
Conclusion and limitations ... 30
Acknowledgements ... 30
References ... 31
Appendices ... 33
Appendix A ... 33
3
Evaluation of Creativity Merijn Besselink s1363751
Abstract
Although there has been written a great amount of scientific papers about creativity, the evaluation of this specific phenomenon has, except for neuroscientific purposes, not been extensively studied yet. The aim of this study was to see whether the output of the word association task could be used to establish differences in creativity levels of the word-association participants. To achieve this, an online survey was conducted in which 81 participants took part, from which two participants were excluded due to inconsistent
answering. The survey participants used 5-point likert rating scales which were based on the semantic map from the study conducted by Van der Velde et al. (2015). The participants rated on what level given word associations with their corresponding explanations were: original, novel, common, surprising and understandable. The results suggest that only small
differences were found between the word association participants on creativity. The rating scales however did show a significant correlation between each other for both filler items and test items. Further research is needed for the validation of rating scales for creativity, and it is also suggested to investigate if the rating scales can be used for evaluating creativity in problem solving and visual creativity like arts.
Introduction
What is creativity? In general, everybody has a somewhat more or less accurate assumption what creativity really is. Some people may think of a great musician or composer to be very creative in the craft of writing music that has never been heard before. Other people may think of an interior designer who can make a small room look big by using the available space more efficiently. Although there are a lot of ways to interpret creativity, it is hard to find a
comprehensive definition of this term. Even if there is a clear definition, how can it be evaluated? This paper will explore this and will address the following questions: What is creativity, and how can you evaluate it?
4
Evaluation of Creativity Merijn Besselink s1363751
approach to the term. With novel and useful, he stated that an idea can be described as
creative when it is novel for an individual that comes up with this idea while it not necessarily has to be novel for someone else (Boden, 1994; Kaufmann 2003). In a later stage, Kaufmann and Beghetto (2007) discussed that there was besides the usual signification of creativity, the “Big C” and “little c”, also a “mini c”. While the Big C includes the genius, breakthrough ideas which are fairly uncommon, the little c includes the more common smaller ideas like coming up with a new recipe. The mini c however includes the process of gaining personal knowledge (Hennessey & Amabile, 2010).
Runco and Jaeger (2012) discussed that creativity can be divided into two
components, namely originality and appropriateness, but that there was a problem with the definition, in the way it is presented in many articles. Runco and Jaeger (2012) found that the majority of recent publications on creativity cite articles or books only from the 1980s or later, while the definitions of creativity extracted from these publications have a long history. According to Runco and Jaeger (2012), it was Stein who published the first clear definition of creativity. Stein (1953) defined it as:
The creative work is a novel work that is accepted as tenable or useful or satisfying by a group in some point in time. By ‘novel’ I mean that the creative product did not exist previously in precisely the same form. The extent to which a work is novel depends on the extent to which it deviates from the traditional or the status quo. This may well depend on the nature of the problem that is attacked, the fund of knowledge or experience that exists in the field at the time, and the characteristics of the creative individual and those of the individuals with whom he (or she) is communicating. (p. 311-312)
Here again the word ‘novel’ is mentioned, which was also confirmed by Kaufman in his 2003 publication. Still there exists some vagueness about creativity, which will be clarified in further detail by Jordanous.
5
Evaluation of Creativity Merijn Besselink s1363751
considered the key factors of creativity. She made a comparison between scientific papers related to creativity with scientific papers unrelated to creativity. By using a log likelihood ratio statistic, she found that there were 694 words that appeared significantly more in the creativity papers than in the papers that were unrelated to creativity. She then used the
Chinese Whispers cluster algorithm and Lin’s semantic similarity measure to divide the words into clusters. This resulted in fourteen different aspects of creativity as can be seen in Figure 1. These clusters could be used as a base for the understanding of creativity and the
development of evaluation tools. A study that used Jourdanous’ findings as a base for their research, is mentioned later in this paper.
Figure 1. 14 key aspects of creativity (Jordanous, 2012)
Now that there is a basic understanding of how creativity is described, it is also interesting to shortly address how creativity can be seen from a neurological point of view. Dietrich and Kanso (2010) found that creativity does not lie solely in the right parts of the brain
hemisphere, which is often stated. To localize how the brain is processing creativity, Dietrich and Kanso (2010) studied 63 articles concerning mostly divergent thinking tasks and found that with the use of electro-encephalography (EEG) scans, creativity is likely processed by the whole brain. Although divergent thinking was significantly associated with creativity,
6
Evaluation of Creativity Merijn Besselink s1363751
With divergent thinking you come up with multiple solutions to open ended problems (Guilford, 1956), for example: find 10 different ways to cross a road. The opposite term to divergent thinking is convergent thinking, in which you use straightforward common problem solving (Guilford, 1956). A standard IQ test is a good example of using convergent thinking. Because the goal of this paper is to address creative thinking and not typical intelligence (convergent thinking), some tools for measuring creativity will be clarified.
A well-known divergent thinking task for enticing creativity is the alternate uses task. In the alternate uses task, participants have to use divergent thinking to come up with original uses for common everyday objects (Jauk, Benedek & Neubauer, 2012). If the target word is for example ‘table’, the appropriate/common use for it can be ‘to have dinner at the table’. An alternate/uncommon use for a table however can be something like ‘you can stand on a table and use it as a stage’. Jauk et al. (2012) found that when engaging in such a divergent task, there is a higher task-related EEG alpha power in the frontal cortical areas than when engaging in a convergent task. A possible explanation for this is that it took more effort for the participants to come up with uncommon responses than with common responses. The classic alternate uses task is developed for measuring creativity on a level of Originality and Appropriateness combined (Runco and Jaeger, 2012). Kröger, Rutter, Hill, Windman, Hermann and Abraham (2013) however used a modified version of the alternate uses task, in which the two components Originality and Appropriateness were both rated separately as well as together. Word pairs, consisting of a common object and the potential use of this object, were presented to the participants. The participants were asked to decide if these pairs were novel, appropriate or both while being measured by fMRI. This resulted in three possible outcomes: creative use (the object and its use is novel and appropriate),
7
Evaluation of Creativity Merijn Besselink s1363751
uses are indeed inducing conceptual expansion. As an implication Kröger et al. (2013) found that the N400 component did not discriminate between novelty in nonsensical uses and novelty in creative uses. A modulation of the N400, the post-N400 late component, did not discriminate between appropriateness in common uses and appropriateness in creative uses. To understand which cognitive operations are most relevant for conceptual expansion, it is important to examine the influence of both the N400 component (novelty) and the post-N400 late component (appropriateness) together. This finding fits with the definition given by Stein (1953) and Runco and Jaeger (2012) which stated that novelty and appropriateness are the key aspects of creativity. Kröger et al. (2013) also concluded that within neuroscientific research it is important to not only study the fundamental aspects of creative thinking, but also study the aspects of the underlying semantic cognition.
Another well-known test for the measurement of creativity is the word association task. In this task a participant is presented a list of words for which he or she needs to mention a new word related to the given target words (Merten and Fischer, 1999). Word association tests were primarily used as a diagnostic tool for psychiatric disturbances, but it was
Maltzman (1960) who started using word associations for evaluating creativity (Gough, 1976). This present day there are a lot of variations of word association techniques. Merten and Fischer (1999) for example used five different variations: a free single-word association test, a multiple choice association test, a common association test, an individual association test and a five point rating on (un)commonness on someone’s own free associations.
The previous mentioned findings of Jordanous (2012) were further examined in an association study, conducted by Van der Velde, Wolf, Schmettow & Nazareth (2015). Their goal was to establish a method on how creativity can be evaluated. In their first association study, Van der Velde et al. (2015) used a restricted association method, in which 36
participants (29 Dutch and 7 German) were asked to give a maximum of three words
associated with creativity. The wordlist derived from this association method was reviewed by three human raters. They selected a list of words on which they all agreed were words
8
Evaluation of Creativity Merijn Besselink s1363751
participants included 10 words from Jordanous’ (2012) list which were selected by the human raters. Eight words appeared both in the participants list and the list of Jordanous (2012) which were not selected by the human raters. This gave a total set of 80 words, which then was used for their second association study. In this study Van der Velde et al. (2015) used a reverse discrete association method, in which50 participants took part. For each of the 80 words from the first association study, the participants had to provide one word that was associated with that word. Van der Velde et al. (2015) wanted to obtain reversed associations to the words associated with creativity, to see if words like ‘to create’ or ‘creative’ are
associated with the words associated with the word ‘creativity’. Another aim of this association study was to see whether words from the list of 80 words associated with each other. The whole list that was obtained of reversed associations was used as one of the lists for a card sorting study, which will be discussed next.
In their follow up study, Van der Velde et al. (2015) used the wordlists of the two previous association studies to select the words for the card sorting study. The words were selected based on three conditions: a word had to appear in both word lists, a word had to appear more than once as an answer in their second association study and thirdly the word could not be ‘creative’ or a derivative of that word (to create etc.). Eventually they came up with a list consisting of 42 words to use in the card sorting study. In the card sorting study the 40 subjects who did not participate in any of the two association studies before, were
instructed to categorize the words from the list into smaller groups. Then the results of the study were analyzed with a Hierarchical Cluster Analysis, in which the highest associated words will be replaced by a single item (Van der Velde et al. 2015). This resulted into five main clusters/categories: Originality, Emotional value, Innovative, Intelligence and Ability. Van der Velde et al. (2015) concluded that these five clusters, all related to creativity, can be seen as a foundation for a semantic map which can be used for the development of rating scales for evaluating (computational) creativity, although more research was needed.
The previous findings of Stein (1953) and Kaufman (2003) stated that one of the main aspects of creativity is usefulness, however the term useful did not appear in the above
9
Evaluation of Creativity Merijn Besselink s1363751
with other terms found in the card study. Therefore it has raised the question if human subjects would see useful as an aspect of creativity and if this term is a necessity for evaluating creativity. To find out how useful and creativity are related as seen by human subjects (instead of by definition), a new card sorting study was conducted in which both the terms useful and creative were included. This follow up study was part of the European project ConCreTe (abbreviation for Concept Creation Technology), to investigate the relation of useful to other creativity-related words (as found in the first card sorting study) and
creativity itself.
For the second card sorting study Van der Velde et al. (2015) decided to include a neutral set of words that was unrelated to useful or creative. Van der Velde et al. (2015) chose the word agile and nine words related to agile to include in the card sorting study. This
resulted in a set of 48 words: 28 of the 42 words from the first card sorting study; the word creative itself; the word useful and eight words related to useful; and 10 words related to agile including agile itself. The words related to useful and agile where found based on a WordNet search. The neutral set of words could provide more information if useful is indeed more related to creativity in Van der Velde’s et al. (2015) study than it is to agile, which then indicates that useful is indeed an aspect of creativity.
The card sorting study was carried out in a hardcopy study and an online study, in which a total of 96 participants (Dutch and German) took part. There were no differences found in the results between the two versions or nationalities, so all the results were
combined. The results were analyzed with a Hierarchical Cluster Analysis, as done in the first card sorting study which can be found in appendix A. This resulted in the following five main clusters: Innovation/skill, Imagination, Creative/novel/original, Useful/valuable and
Agile/resourceful. The scores for the words creative and useful were compared for all of the five clusters. Surprisingly there was a low score directly between creative and useful, so apparently human subjects do not indicate useful as a necessary aspect for creativity per se. Further examination of the results reveal that creative scored high on the clusters
10
Evaluation of Creativity Merijn Besselink s1363751
creative and useful was only found in the Agile/resourceful cluster, although there was a higher score between creative and the Agile/resourceful cluster, than between useful and creative itself.
For the evaluation of creativity, the main clusters as presented in the semantic map from the first and the second card sorting study can be used as a starting point for developing rating scales (see appendix A). Van der Velde et al. (2015) stated that if the clusters represent the assumptions that participants have about creativity, then the clusters also could be used for evaluating creativity. The semantic maps related to creativity could also serve as a base for the development and evaluation of paradigms for the investigation of the neural basis of creativity.
Although there has been written a great amount of scientific papers about creativity, the evaluation of this specific phenomenon has, except for neuroscientific purposes, not been extensively studied yet. For this present study the output from a recent word association task conducted by ConCreTe, will be evaluated by using five 7-point likert scales. In this
particular word association task, participants were asked to give uncommon associations with an explanation to a given target word. It is important to mention that the rating scales were based on the semantic maps and clusters from the card sorting studies conducted by Van der Velde et al. (2015). The rating scales still need to be tested, which will be described into more detail in the Methods-section of this paper. Based on the findings of i.a. Jordanous (2012), Van der Velde et al. (2015) and the ConCreTe project, the main goal of this paper is to see whether the output of the word association task can be used to establish differences in
creativity levels of the participants. This research goal will be tested by using the rating scales mentioned above.
Method
Participants
11
Evaluation of Creativity Merijn Besselink s1363751
[image:11.595.149.454.140.399.2]from which 27 (34,2%) were male and 52 (65,8%) were female. The age range was 18-66 years, with M: 28,66 and SD: 12,286. In Figure 2 is an overview of the education levels of the participants.
Figure 2. Bar chart of the education levels (‘opleidingsniveau’) of the participants.
Prior instructions stated that participants must have a minimum age of 18 years old, their native language should be Dutch and they should not have any language or reading disorders. The participants did not participate in this study or the study: ‘Use a spoon as a spade.
Brainwaves of object use.’ before.
12
Evaluation of Creativity Merijn Besselink s1363751
which they need for their bachelor’s degree. All participants gave informed consent by agreeing to participate online.
Materials
For this study was a quantitative research method used by the means of an online survey. This survey was created entirely within the online survey program Qualtrics1 (Provo, UT). The
original format used for the surveys can be found in Appendix B. The survey was in Dutch, due to the fact that the data used for creating this survey was also in Dutch. By using an online survey, participants were able to decide for themselves where and when they wanted to participate. Using an online survey simplifies the gathering of participants, because of the flexibility and ease of distribution. It also helps to control the answer order and requirement of completing the whole survey (Evans and Mathur, 2005). According to Evans and Mathur (2005) it also helps to minimize human input errors in data analysis, because most online survey tools have an integrated analysis program.
In the online survey used for this study, different word associations were given with an explanation. For example (in Dutch):
Tulp → tuin
Uitleg: Je zult tulpen sneller associeren met een vaas dan met tulpentuin
In English it reads:
Tulip → Garden
Explanation: you will associate tulips quicker with a vase than with tulipgarden
1 The output for this paper was generated using Qualtrics software, Version 7889524
13
Evaluation of Creativity Merijn Besselink s1363751
In this example the target word was ‘tulip’ for which the association ‘garden’ was given with a short explanation for this particular association. In the next section, a more comprehensive description will be given about the further design of the surveys.
Design
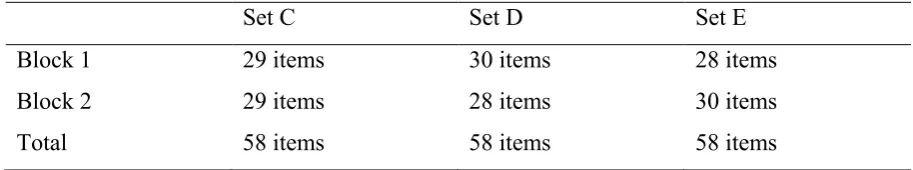
[image:13.595.68.525.310.395.2]From the original dataset there were three sets: C, D and E in which the data was presented from four different participants per set. Each set was divided into two blocks. Set C 1-2, Set C 2-1, Set D 1-2, Set D 2-1, Set E 1-2 and Set E 2-1. Presented in Table 1 is an overview of the total items/questions per set and block
Table 1
Overview of Amount of Items per Set and Block
Set C Set D Set E
Block 1 29 items 30 items 28 items
Block 2 29 items 28 items 30 items
Total 58 items 58 items 58 items
Each block contained 9 filler items, which were common word association and explanations. For example; in Dutch: BED → SLAPEN, uitleg: ‘In mijn bed slaap ik’. In English: BED → SLEEPING, with the explanation: ‘I sleep in my bed’. These filler items were used purely for validation reasons. Each set consisted out of two versions in which the order of the blocks was mirrored. Also this counterbalancing of the data sets was used as a validation tool.
The design for the evaluation of the surveys consisted of five 7-point likert scales. The scales ranged from strongly disagree to strongly agree. The scales were being used to rate in which way each word associations with their corresponding explanations were:
• Original → How original is the word association with the corresponding explanation?
14
Evaluation of Creativity Merijn Besselink s1363751
• Common2 → How common is the word association with the corresponding
explanation?
• Surprising → How surprising is the word association with the corresponding explanation?
• Understandable → How understandable is the word association with the corresponding explanation?
[image:14.595.74.523.300.408.2]In Figure 3 are the rating scales displayed in Dutch as how they appeared in the survey. The order of the rating scales was randomized per question. The order in the example reads from top to bottom: it is understandable, surprising, common, novel and original.
Figure 3. Rating scales used for the online survey, ranging from strongly disagree (‘sterk mee oneens’) to strongly agree (‘sterk mee eens’).
Prior to the distribution of the surveys, there were three pilot tests for sets C 2-1, D 2-1 and E 2-1. The 2-1 versions were used for distribution on Facebook and thus were openly accessible and the most convenient to use for feedback. For each set a new participant was asked to complete the survey and to provide feedback about their experience walking it through. The feedback received from the participant was analyzed and discussed to make adjustments for improvement. The first set that was provided with feedback was set C 2-1.
15
Evaluation of Creativity Merijn Besselink s1363751
The participant stated that it was unclear what needed to be rated (only the word-associations or the word-associations including the explanation). This lead to a small adjustment in the instruction part of the survey, to clarify that the word-association including the explanation needed to be rated. This feedback was processed in all versions of the surveys. The next survey that was rated was set D 2-1 (including the adjusted instructions). The feedback provided for this set stated that the informed consent and the instructions for the rating scales needed more spaces in the text to improve readability.
After the feedback was processed in all surveys, set E 2-1 was provided with feedback. According to the participant there was no further need for improvement, other than correcting typos in the associations. Because the typos were already present in the original data obtained from the word association task, there were no further corrections made to the surveys. The surveys now were ready for distribution. For the final six versions of the surveys a quota was set at a maximum of 13 participants per set. This would make a total of 78 participants who could participate in this study. As can be seen in the participants section of the method, a total of 81 participants participated. The quota was set at 14 for three surveys, because three
surveys were not entirely completed. After further analysis, the data of one of this three surveys however was useable. This resulted in 81 participants, from which two were excluded.
Procedure
The surveys started with questions, which were approved by the Ethics Committee of the University of Twente, about the requirements for this study, followed by a brief
introduction and the informed consent. After accepting the informed consent a fixed sequence of demographic questions about i.a. gender, age, native language and level of education were presented. The next part consisted out of an instruction about the task with three sample questions and a brief explanation of the five rating scales. If someone did not comply with the prior stated requirements or informed consent they were automatically redirected to the end of the survey and their recorded data was annulled.
16
Evaluation of Creativity Merijn Besselink s1363751
random order and only one question was presented per page. The five rating scales were presented all at the same time with their order changed randomly per question. Every question needed to be answered completely, for the participant to be able to proceed to the next
question. This was for the sake of certainty that all surveys were completed entirely. Also a progression bar was displayed in the bottom of the page, for letting the participants track their progress. Participants were not able to go back to a previous question.
After completing all the questions, the participants were given the opportunity to give their SONA ID to receive 0,5 credit points as a reward for their participation. If a participant was not interested in obtaining SONA credit points, a short note of appreciation was
displayed. On the last page contact-details of the researchers were displayed, if a participant wanted to receive more information about the study. The total duration of completing a single survey was approximately 30 minutes.
Analysis
First the data for all participants who completed the surveys was analyzed. All means were calculated for the rating scales per filler items and test items per participant. Based on a normality test, potential outliers of participants who provided inconsistent answers were identified (for example if someone rated items as highly original and highly common at the same time). If inconsistency was found on multiple items, the matching participants were excluded from the study. Then the means of the rating scales for each single test and filler item were calculated, for all of the three sets. Because each original data set was compiled from the word-associations (test items) of four participants, the last step of the analysis was providing an overview of the rating scale means, for each test items belonging to each specific participant. This overview was used to compare the potential differences in creativity between the participants of the word association study conducted by ConCreTe.
Results
17
Evaluation of Creativity Merijn Besselink s1363751
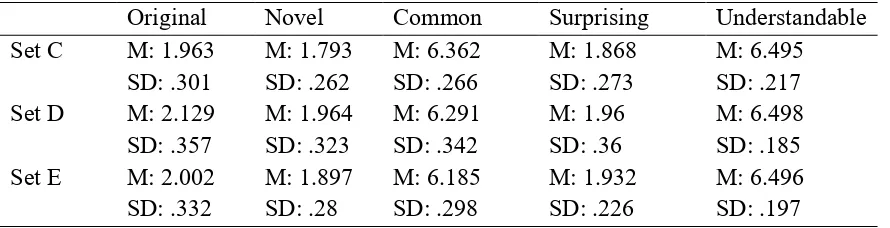
participants who took part in the survey, first the filler items were analyzed. The filler items were the same for each set, which is reflected in the similarities between the means in Table 2. The results in Table 2 also illustrate that common word associations scored high on the
common and understandable scale, while they scored low on the original, novel and surprising scale. This indicates that the participants were successfully able to rate common word-associations with the given rating scales.
Table 2.
Rating scale scores on filler items per set.
Original Novel Common Surprising Understandable
Set C M: 1.963
SD: .301 M: 1.793 SD: .262 M: 6.362 SD: .266 M: 1.868 SD: .273 M: 6.495 SD: .217
Set D M: 2.129
SD: .357 M: 1.964 SD: .323 M: 6.291 SD: .342 M: 1.96 SD: .36 M: 6.498 SD: .185
Set E M: 2.002
SD: .332 M: 1.897 SD: .28 M: 6.185 SD: .298 M: 1.932 SD: .226 M: 6.496 SD: .197
[image:17.595.71.516.264.378.2]This finding is further confirmed when the Pearson correlations between the rating scales in Table 3 are examined. All rating scales have a correlation of r >.70, which confirms that the scales are strongly related to each other.
Table 3.
Pearson correlations between the rating scales on the filler items.
Original Novel Common Surprising Understandable
Original 1 .847** -.752** .810** -.702**
Novel .847** 1 -.759** .882** -.767**
Common -.752** -.759** 1 -.788** .798**
Surprising .810** .882** -.788** 1 -.782**
[image:17.595.71.526.529.659.2]18
Evaluation of Creativity Merijn Besselink s1363751
**. Correlation is significant at the 0.01 level (2-tailed).
[image:18.595.75.533.220.597.2]Table 4 gives an overview of how the items provided by the participants from the word-association task were rated by the participants of the survey.
Table 4.
Ratings of the test items per participant of the word association (WA) task.
WA participant
Item count
Original Novel Common Surprising Understandable
5 18 M: 4.192
SD: .910 M: 3.824 SD: .906 M: 4.173 SD: 1.142 M: 4.2 SD: 1.004 M: 5.291 SD: .859
6 18 M: 4.454
SD: .784 M: 4.268 SD: .830 M: 3.509 SD: .986 M: 4.627 SD: .871 M: 4.101 SD: .976
7 18 M: 4.503
SD: .490 M: 4.186 SD: .429 M: 3.542 SD: .671 M: 4.551 SD: .430 M: 4.611 SD: .567
8 18 M: 4.743
SD: .644 M: 4.409 SD: .64 M: 3.609 SD: .825 M: 4.664 SD: .696 M: 4.782 SD: .748
9 8 M: 4.94
SD: .423 M: 4.596 SD: .542 M: 2.805 SD: .597 M: 4.88 SD: .570 M: 4.048 SD: .811
10 10 M: 4.338
SD: .422 M: 4.037 SD: .455 M: 3.731 SD: .896 M: 4.408 SD: .565 M: 4.749 SD: .901
11 10 M: 4.256
SD: .568 M: 4.001 SD: .728 M: 3.5 SD: .897 M: 4.334 SD: .697 M: 4.994 SD: .944
12 10 M: 4.782
19
Evaluation of Creativity Merijn Besselink s1363751
[image:19.595.71.406.70.344.2]Figure 4. Rating scale scores participant 5.
[image:19.595.69.409.384.662.2]20
Evaluation of Creativity Merijn Besselink s1363751
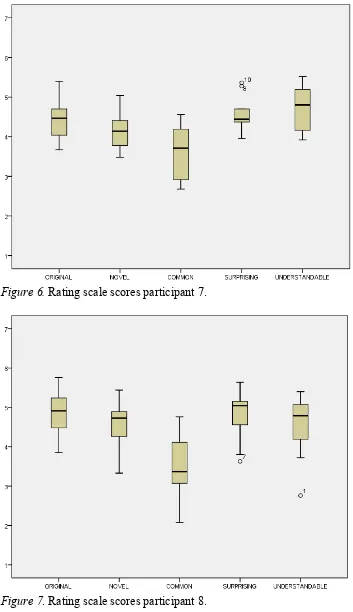
[image:20.595.70.423.69.681.2]Figure 6. Rating scale scores participant 7.
21
[image:21.595.74.432.67.683.2]Evaluation of Creativity Merijn Besselink s1363751
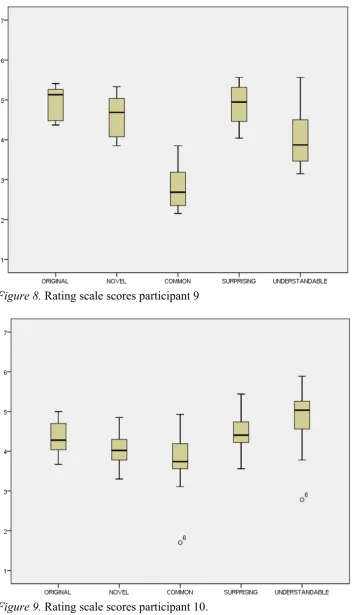
Figure 8. Rating scale scores participant 9
22
Evaluation of Creativity Merijn Besselink s1363751
[image:22.595.68.420.69.369.2] [image:22.595.67.418.378.680.2]Figure 10. Rating scale scores participant 11.
23
Evaluation of Creativity Merijn Besselink s1363751
Figure 4 till Figure 11 represent the box plots of the scores of each WA participant on the scales. In Figure 6 on the surprising scale there are some outliers. This can be explained because these outliers represent some word associations given by WA participant 7, which were rated as more surprising than the other surprising word associations given by this participant.
As can be seen in Figures 4 till 11, the means for each scale did not really differ between the WA participants. All the means are around 4 and this number represents the neutral scale point: not disagree/not agree. To find an explanation for this small scatter, the answers of the survey participants were analyzed. Two survey participants were very hesitant in their answering. These two participants completed the survey versions C 1-2 and E 1-2. The participant from C 1-2 was hesitant on the original and surprising scales for some particular items and hesitant on all scales for some other items. The participant from E 1-2 was hesitant on all scales for some particular items or hesitant for the understandable scale for some items. They have chosen the not disagree/not agree option in about 30% of all their answers. Although these participants responded ‘neutral’ in 30% of the responses, they were not removed from the final dataset as the percentage was still low. The remaining participants had more variation in their answering on the scales, however there where not a lot of extreme scores (strongly disagree or strongly agree).
To see whether there are any items about which the survey participants were more hesitant than for the other items, a cut off score was calculated. For each item was counted how many times there was a neutral rating per scale. Then the neutral scores per item were counted and a mean was calculated. The cut off score was set at: mean plus two standard deviations. This resulted in 15.70 plus 2x5.783 = 27.266. In the data set, three items were found; one from set C with a total of 33 neutral ratings and two from set D with a total of 28 and 39 neutral ratings. For all three items the most neutral answers were given for the novel scale.
24
Evaluation of Creativity Merijn Besselink s1363751
[image:24.595.73.533.200.600.2]items for participant 10, 11 and 12 remained the same. This led to Table 5, in which the means per participant per scale are displayed again. Also the medians of the scores are included, which were used for the analysis of the differences between the WA participants.
Table 5.
Revised version of ratings of the test items per participant of the word association (WA) task.
WA participant
Item count
Original Novel Common Surprising Understandable
5 10 M: 4.063
SD: .948 M: 3.707 SD: .923 M: 4.218 SD: 1.215 M: 4.033 SD: 1.045 M: 5.305 SD: .855
6 10 M: 4.616
SD: .945 M: 4.388 SD: .957 M: 3.396 SD: 1.070 M: 4.792 SD: .992 M: 4.107 SD: .870
7 10 M: 4.480
SD: .517 M: 4.152 SD: .516 M: 3.643 SD: .667 M: 4.575 SD: .441 M: 4.707 SD: .545
8 10 M: 4.874
SD: .547 M: 4.573 SD: .629 M: 3.383 SD: .850 M: 4.835 SD: .664 M: 4.555 SD: .802
9 8 M: 4.94
SD: .423 M: 4.596 SD: .542 M: 2.805 SD: .597 M: 4.88 SD: .570 M: 4.048 SD: .811
10 10 M: 4.338
SD: .422 M: 4.037 SD: .455 M: 3.731 SD: .896 M: 4.408 SD: .565 M: 4.749 SD: .901
11 10 M: 4.256
SD: .568 M: 4.001 SD: .728 M: 3.500 SD: .897 M: 4.334 SD: .697 M: 4.994 SD: .944
12 10 M: 4.782
SD: .437 M: 4.412 SD: .531 M: 3.182 SD: .701 M: 4.811 SD: .562 M: 4.255 SD: .853
Median 4.575 4.290 3.500 4.670 4.710
25
Evaluation of Creativity Merijn Besselink s1363751
[image:25.595.69.531.223.434.2]higher than the median, were placed in one group and the participants who scored under or equal to the median where placed in the second group. This resulted in Table 6, which illustrates who had a higher mean score on the rating scales for their items, in comparison with the other WA participants.
Table 6.
Median split between the word association participants.
Original Novel Common Surprising Understandable
Median 4.575 4.290 3.500 4.670 4.710
WA participants with a mean score higher than the median.
6, 8, 9, 12
6, 8, 9, 12
5, 7, 8, 10
6, 8, 9, 12 5, 10, 11
WA participants with a mean score lower than the median.
5, 7, 10, 11
5, 7, 10, 11
6, 9, 11, 12
5, 7, 10, 11
6, 7, 8, 9, 12
As Table 6 shows, for each scale there is an equal distribution of participants for higher and lower mean scores, with the exception of the scale understandable. In Table 7 are the correlations displayed between the means of the rating scales on all test items.
Table 7.
Pearson correlations between the rating scales on all test items.
Original Novel Common Surprising Understandable
Original 1 .937** -.819** .914** -.610**
Novel .937** 1 -.865** .947** -.676**
[image:25.595.69.531.585.690.2]26
Evaluation of Creativity Merijn Besselink s1363751
Surprising .914** .947** -.894** 1 -.719**
Understandable -.610** -.676** .849** -.719** 1
**. Correlation is significant at the 0.01 level (2-tailed).
Deriving from Tables 6 and 7, a short evaluation per participant will be described next.
• Participant 5 and 10 scored low on the ‘creativity’ scales original, novel and
surprising and high on the common and understandable scales. This ratio can also be found in the negative correlations between these rating scales in Table 7.
• Participant 6, 9 and 12 scored low on the common and understandable scales and high on the original, novel and surprising scales. This ratio can also be found in the
negative correlations between these rating scales in Table 7.
[image:26.595.75.534.70.110.2]• Participant 7 scored low on the original, novel, surprising and understandable scales and high on the common scale. This finding differs from the correlations found in Table 7, because there was a positive correlation between common and
understandable.
• Participant 8 scored low on the understandable scale and high on the original, novel, common and surprising scales. This finding also contradict with the correlations in Table 7. Again there should be a positive correlation between common and
understandable.
• Participant 11 scored low on the original, novel, common and surprising scales and high on the understandable scale. Here happened the same as with participant 7 and 8, there should be a positive correlation between common and understandable.
27
Evaluation of Creativity Merijn Besselink s1363751
scores on the rating scales and the percentage of trials in which a use was indicated as
[image:27.595.71.528.285.411.2]common (CM), creative (CR) and anomalous (ANO) by the WA participants. As can be seen in Table 8, the original, novel and surprising scales have a negative correlation with the common (CM) uses and a positive correlation with the creative and anomalous uses. The correlations however were not significant because they ranged from -.700 > r < .700.
Table 8.
Pearson correlations between mean scores on the rating scales and the percentage of trials in which a use was indicated as common (CM), creative (CR) and anomalous (ANO) in the alternate uses task.
CM CR ANO
Original -.699 .219 .259
Novel -.436 .082 .256
Common .176 -.003 -.147
Surprising -.491 .123 .244
Understandable .297 -.135 -.060
*. Correlation is significant at the 0.05 level (2-tailed).
Discussion
28
Evaluation of Creativity Merijn Besselink s1363751
The boxplots in Figure 4 till 11, illustrate a similar parabolic shape between the rating scales for each WA participant, with the means distributed around 4, the ‘neutral’ rating option (not disagree/not agree). Because Table 4 showed a different item count amongst the WA participants, the item count was brought back to 10 randomly chosen items per
participant (except for participant 9, who only had eight items). After conducting a median split to see whether there were differences found, the results showed an even distribution per scale for participants having a higher and a lower mean score compared with the median. Participants 6, 9, 12 scored the highest on the creativity scales original, novel and surprising while having the lowest mean on the common scales common and understandable, although the differences between these participants were very small. On the other hand, according to the median split, participants 5, 7, 10 and 11 had the lowest mean scores on the creative scales. The low item count might be a reason that there were no greater differences between the means for the WA participants.
It was expected that the WA participants with lower mean levels on the original, novel and surprising scales chose more common uses on the alternate uses task (negative
correlation). The correlations indeed appear to be all negative, although they do not seem to be significant. The highest negative correlation was found for the scale original and the percentage of trials choses as common: -.699. This correlation does not reach significance, but it does show a possible trend if more participants are included. There were positive
correlations expected between higher mean levels on the original, novel and surprising scales and more creative uses on the alternate uses task. These positive correlations were found as can be seen in Table 8, but they do not reach significance. These low correlations might be caused by potential difficulties the WA participants had in discriminating between creative uses and anomalous uses.
29
Evaluation of Creativity Merijn Besselink s1363751
WA participants on the scales. This neutral mean scores were not merely caused by survey participants choosing only the neutral option on the scales, but rather by the lack of choosing extreme scores as totally disagree/totally agree. The WA participants perhaps did differ on an individual level of creativity, however the survey participants were not able to point this out. If the survey participants were explicitly told beforehand that they were evaluating the word associations on creativity, they might have chosen more extreme scores.
Another explanation for the small differences between the WA participants might be caused by the reason that there is no definitive consensus on what creativity exactly is (Jordanous, 2012). Survey participants might find it difficult to use the rating scales in a consistent way. One of Jordanous’ 14 key aspects of creativity was social interaction and communication. There was no social interaction in this study, because the data was collected by using online surveys. Maybe if someone spoke out an uncommon association and gave a corresponding verbal explanation, it might have been easier for a participant to use and understand the rating scales for evaluation.
Stein (1953) stated that the extent to which a work is creative may depend on the nature of the problem, the experience that exists in the field and the characteristics of the creative person and those of the individuals with whom the person is communicating. This statement might be the important factor to address the lack of differences in creativity found in the WA participants. All WA participants took part in an alternate uses task, before participating in the word association task. This might have caused them indirectly to give ‘comparable’ associations amongst each other, in such a way that the items reached a similar level of creativity in the eyes of the survey participants. This so-called priming effect, in which exposure to a stimulus can influence the reaction to another stimulus, might have caused this. According to Loersch & Payne (2011) priming may not cause direct effect, instead it can alter the accessibility of mental content like creative thinking. Because the survey participants did not engaged in a creativity study before, this might be the reason that the associations might have appeared indifferent from each other.
30
Evaluation of Creativity Merijn Besselink s1363751
from within a group, then perhaps they are also better at evaluating in a group. This might lead to greater variation on the ratings scale scores.
Conclusion and limitations
The results show that it appears to be difficult for lay people to effectively use rating scales to evaluate word associations on creativity. This immediately reflects the importance for more research on evaluating creativity conducted by human raters. For this present study the rating scales have been used to evaluate word associations. The next step for validating these rating scales, is using them in different creativity studies apart from evaluating word associations. They might be useful for the evaluation of creativity in problem solving or for the evaluation of more visual creativity like art.
The limitations of this study consist of a relatively small participant sample per survey version. This might be the main reason that there seemed to be little differences between the WA participants. 50% of the survey participants were students from the University of Twente who participated through SONA. There is a possibility that they were biased by other surveys on SONA, which could make them not representative as a sample for this study. However, this present study can be a helpful starting point for the further development and validation of rating scales to evaluate creativity. It points out that indeed a consensus about the exact aspects of creativity is hard to find and apparently, as Aristotle has already stated it; to understand creativity ‘the whole is greater than the sum of its parts’.
Acknowledgements
31
Evaluation of Creativity Merijn Besselink s1363751
References
Beghetto, R.A., & Kaufman, J.C. (2007). Toward a broader conception of creativity: A case
for" mini-c" creativity. Psychology of Aesthetics, Creativity, and the Arts, 1(2), 73-79.
Boden, M.A. (1994). What is creativity? Dimensions of creativity, 75-117.
Dietrich, A. and Kanso, R. (2010). A Review of EEG, ERP, and Neuroimaging Studies of Creativity and Insight. Psychological Bulletin, 136, 822-848.
Evans, J. and Mathur, A. (2005). The value of online surveys. Internet Research, 15(2), 195- 219.
Guilford, J.P. (1956). The Structure of Intellect. Psychological Bulletin, 53, 267-293.
Gough, H.G. (1976). Studying Creativity by Means of Word Association Tests. Journal of Applied Psychology, 61(3), 348-353.
Heller, P., Keith, R. & Anderson, S. (1992) Teaching problem solving through cooperative grouping. Part 1: Group versus individual problem solving. American Journal of Physics, 60(7). 627-636
Hennessey, B.A. & Amabile, T.M. (2010). Creativity. Annual Review of Psychology, 61, 569-598.
Jauk, E., Benedek, M. & Neubauer, A.C. (2012). Tackling creativity at its roots: Evidence for different patterns of EEG alpha activity related to convergent and divergent modes of task processing. International Journal of Psychophysiology, 84(2), 219-225.
Jordanous, A. (2012). A Standardised Procedure for Evaluating Creative Systems:
Computational Creativity Evaluation Based on What it is to be Creative. Cognitive Computation, 4(3), 246-279.
32
Evaluation of Creativity Merijn Besselink s1363751
Kröger, S., Rutter, B., Hill, H., Windmann, S., Hermann, C. & Abraham, A. (2013). An ERP study of passive creative conceptual expansion using a modified alternate uses task. Brain Research, 1527, 189-198.
Kutas, M. & Federmeier, K.D. (2011). Thirty years and counting: Finding meaning in the N400 component of the event related brain potential (ERP) Annual Review of Psychology, 62, 621-647.
Loersch, C. & Payne, B.K. (2011). The Situated Inference Model: An Integrative Account of the Effects of Primes on Perception, Behavior, and Motivation. Perspectives on Psychological Science, 6(3), 234-252.
Merten, T. & Fischer, I. (1999). Creativity, personality and word association responses: associative behaviour in forty supposedly creative persons. Personality and Individual Differences, 27(5), 933-942.
Runco, M.A. & Jaeger, G.J. (2012). The Standard Definition of Creativity. Creativity Research Journal, 24(1), 92-96.
Stein, M.I. (1953). Creativity and culture. Journal of Psychology, 36, 31-322.
33
Evaluation of Creativity Merijn Besselink s1363751
Appendices
Appendix A
34
Evaluation of Creativity Merijn Besselink s1363751
35
Evaluation of Creativity Merijn Besselink s1363751
U heeft aangegeven dat Nederlands niet uw moedertaal is. Helaas kunt u alleen deelnemen aan dit onderzoek als uw moedertaal Nederlands is.
In ieder geval bedankt voor uw interesse!
Druk op 'Volgende' om verder te gaan
Bent u 18 jaar of ouder?
Ja Nee
Druk op 'Volgende' om verder te gaan
U heeft aangegeven dat u jonger bent dan 18. Helaas kunt u alleen deelnemen aan dit onderzoek als u minimaal 18 bent.
In ieder geval bedankt voor uw interesse!
Druk op 'Volgende' om verder te gaan
Heeft u een taalstoornis of een leesstoornis?
Ja Nee
Druk op 'Volgende' om verder te gaan
U heeft aangegeven dat u een taalstoornis of leesstoornis heeft. Helaas kunt u alleen deelnemen aan dit onderzoek als u geen taalstoornis of leesstoornis heeft, omdat in het onderzoek een leestaak wordt gebruikt.
In ieder geval bedankt voor uw interesse!
Druk op 'Volgende' om verder te gaan
Introductie
Welkom bij het onderzoek!
In dit onderzoek gaat u woordassociaties evalueren op 5 korte schalen in een vragenlijst. Het doel van het onderzoek is om meer te weten te komen over hoe woordassociaties worden geïnterpreteerd.
36
Evaluation of Creativity Merijn Besselink s1363751
evalueren op 5 korte schalen.
Het onderzoek zal ongeveer 20-30 minuten duren. Meedoen aan dit onderzoek is vrijwillig. U mag op elk moment stoppen met het onderzoek. De data zal volledig anoniem worden verwerkt en niet door derden worden ingezien. Er bestaat geen goed of fout antwoord: het gaat immers om uw mening. Mocht u mee doen als student voor SONA
proefpersooncredits van de Universiteit Twente, dan wordt u gevraagd om aan het eind van het onderzoek uw
SONA ID in te vullen.
Klik op ‘Volgende’ om verder te gaan naar het informed consent
Informed consent
Ik wil u vragen de volgende informatie over de vertrouwelijkheid en de verwerking van de gegevens goed door te lezen voordat u aan het onderzoek begint.
Het onderzoek zal ongeveer 20-30 minuten duren. Uw deelname aan dit onderzoek is vrijwillig. U mag op elk moment stoppen met het onderzoek, zonder hiervoor een reden aan te geven. U mag tot 24 uur na het onderzoek uw medewerking intrekken, wat betekent dat uw verzamelde gegevens vernietigd zullen worden. De data zal volledig anoniem worden verwerkt en niet door derden worden ingezien. Indien de onderzoeksresultaten gebruikt zullen worden in wetenschappelijke publicaties, dan wel op een andere manier openbaar worden gemaakt, zal dit volledig geanonimiseerd gebeuren. Na afloop van het volledige onderzoek kunt u, indien u dat wenst, middels een debriefing over de verkregen resultaten op de hoogte worden gesteld. Voor verdere informatie en/of debriefing kunt
u contact opnemen met Merijn Besselink, te bereiken op: [email protected]
"Ik heb de voorafgaande informatie goed doorgelezen en stem toe dat mijn data voor wetenschappelijk onderzoek gebruikt mogen worden."
Ja Nee
U heeft 'Nee' geselecteerd in de informed consent. Helaas kunt u alleen deelnemen aan dit onderzoek als u de informed consent accepteert.
In ieder geval bedankt voor uw interesse!
Er zullen nu een paar demografische vragen worden gesteld
Wat is uw leeftijd?
Wat is uw geslacht?
Man Vrouw Anders
37
Evaluation of Creativity Merijn Besselink s1363751
Klik op 'Volgende' om verder te gaan
Instructies
U krijgt straks woordparen te zien die een associatie hebben met elkaar. Voor elk woordpaar is het 1e woord,
bijvoorbeeld ‘voeten’, een woord waarvoor een associatie is gemaakt, bijvoorbeeld ‘schoenen’. Deze woorden
zullen in het onderzoek als volgt worden weergegeven:
Voeten → Schoenen
In het onderzoek zal er een uitleg staan van de associatie onder elk woordpaar:
Voeten → Schoenen
Uitleg: Want schoenen draag je aan je voeten
In dit voorbeeld wordt voor het woord ‘Voeten’ (1e woord) de associatie ‘Schoenen’ (2e woord) gegeven, met als uitleg dat u schoenen aan uw voeten draagt.
Een ander voorbeeld is:
Sleutel → Brieven
Uitleg: Je kan je sleutel gebruiken om brieven te openen, zoals een briefopener
In dit voorbeeld wordt voor het woord ‘Sleutel’ (1e woord) de associatie ‘Brieven’ (2e woord) gegeven, met als uitleg dat u een sleutel kunt gebruiken als een soort briefopener om zo brieven te openen.
Nog een voorbeeld is:
Fiets → Komma
Uitleg: Beiden zijn zwart
In dit voorbeeld wordt voor het woord ‘Fiets’ (1e woord) de associatie ‘Komma’ (2e woord) gegeven, met als uitleg dat beiden zwart zijn.
Klik op ‘Volgende’ om verder te gaan
Uw taak zal zijn om elk woordpaar samen met de uitleg te evalueren op 5 rating schalen. Elke schaal bestaat uit 7
punten, uiteenlopend van sterk mee oneens tot sterk mee eens. De schalen zijn als volgt:
38
39
Evaluation of Creativity Merijn Besselink s1363751
Het is dus de bedoeling dat u de woordparen samen met de uitleg beoordeelt. Als we de eerdere 3 voorbeelden
zouden evalueren op deze 5 schalen, dan zouden ze als volgt kunnen worden geëvalueerd: 1e voorbeeld:
Klik op 'Volgende' om verder te gaan
Voor het 2e voorbeeld:
Klik op 'Volgende' om verder te gaan
40
Evaluation of Creativity Merijn Besselink s1363751
Klik op 'Volgende' om verder te gaan
U gaat nu beginnen met het 1e deel van het onderzoek.
Klik op 'Volgende' om te starten
Dit is het einde van deel 1. Nu volgt het 2e gedeelte.
41