Public summary
Exploring the influence
of multiple parameters
on incomplete packages
A simulation study on the influence of multiple parameters and variables at assembly and outbound logistics
Master thesis Gerard Veerbeek
Industrial Engineering and Management
Supervisors:
dr. Peter Schuur
ir. Wieteke de Kogel-Polak Pieter de Jongh, MSc. (plant engineer)
Gerlof Keulen, MSc. (production control and supply chain management)
Introduction
For the completion of my master Industrial Engineering and Management at the University of Twente, specialization Production and Logistics Management, I conducted my graduation project at Scania Production Meppel B.V. The subject of this graduation project is the influence of different parameters and variables on the performance of the assembly and outbound logistics. Due to the complete confidentiality of this report, only an overview of this research is discussed here.
This summary is divided into different sections. First of all, the company profile is presented and the reason for this research is explained. Secondly, the research itself is described including research questions and the methods used to analyse the situation. Finally, some results and recommendations following from this research are presented.
Company profile
Scania is one of the leading companies regarding production of heavy trucks, buses, industrial and marine engines and services. In 1891, Vabis started with the production of trucks in Södertalje in Sweden. The headquarter of Scania is still located in this city, whereas more factories were opened across Europe and South-America. (Scania, 2017)
[image:2.595.72.523.414.676.2]In the last decades Scania has focused on efficiency, low-carbon solutions that enhance the customer profitability, while creating value for customers, employees and society. With over 44.000 employees and still growing, Scania belongs to the top of the truck producing companies. Figure A shows where the production facilities are located: Luleå, Södertälje, Oskarshamn (all in Sweden), Lathi (Finland), Slupsk (Poland), Meppel, Zwolle (both in the Netherlands), Angers (France), São Paolo (Brazil), and Tucumán (Argentina).
Figure A Overview of Scania production facilities
this sequence is an important aspect of the production process. The production process at Meppel can be divided into multiple production steps:
1. Arrival of the parts 2. Painting process 3. Inspection & repair 4. Assembly
5. Outbound
To be able to do thorough research, not all production steps are taken into account for this research. A distinction is made based on the moment when parts are inspected. From that moment parts can get out of sequence which has consequences as described later on in the summary. The production steps which are included in this research are repair, assembly, and outbound. Furthermore no parts are neglected during this research, since this would improve the performance, but not represent reality.
Research
IntroductionScania has launched a new truck type, which involves changes in production processes during a transition period. All departments within Scania Meppel are related and influence each other. The departments influenced the most by other departments are assembly and outbound logistics. Deviated parts get out of sequence which causes incomplete packages. These packages must be stored until the last part of a package arrives, which requires space. How this number of packages is influenced by multiple variables and parameters is unknown, which makes it difficult to reduce the number of incomplete packages in an efficient way. This problem resulted in the following research question:
Which parameters and variables influence the assembly and outbound logistics and which
values should they have to meet the requirements given a certain assembly feeding concept?
To answer this question different sub questions are created and answered during this research.
1. What does the current situation look like at Scania production Meppel? 2. Which problems occur due to the introduction of the new truck? 3. What does literature tell about dealing with out of sequence products? 4. How can simulation be used to provide insight in the variables?
5. What conclusions can be drawn from the model? 6. Which recommendations follow from this research?
These questions will be treated as detailed as possible, however not all details can be given due to the confidentiality of this report.
Answering the research questions
First of all the current situation at Scania Meppel can be described as a transition period from the old to new truck. The main production steps as described earlier remain almost the same, but the parts itself change. A lot of different variables and parameters are found during observations and brainstorm sessions. These parameters and variables influence the assembly and outbound logistic in some way. Goal is to provide insight in to what extent these variables influence the performance.
and the part arrives at the assembly department is called repair cycle time. This cycle time differs per repair option and is measured for each part. Using statistical software a distribution for these cycle times is found and used later on to simulate this production step.
To measure the performance of the assembly and outbound logistics, the total footprint is used in this research. Although more performance indicators are available, the footprint provides a lot of insight when different options are compared. The total footprint can be defined as the square metres necessary when all incomplete packages are placed at the floor without aisles and stacking. Another important aspect of the production process is the assembly feeding concept. Here, “first in first out”
(FIFO) is applied, which fits to a sequenced production process, although other concepts might be more suitable for specific products.
After knowing the problems and current situation, literature is used to find suitable feeding concepts
and methods to analyse the impact of variables. The first feeding concept discussed is “first in first out”
which is easy to apply, since it only consists of two rules:
• No parts can overtake each other
• There must be a clearly defined maximum capacity.
However, once there are rules they can also be ignored, which is useful in some situations. For example, when a part is missing: production can be stopped or parts can be taken out of sequence (Roser, 2014). The most important advantages of FIFO are a clearly defined material flow, a lean material flow and visual management.
Another option is to postpone assembly and wait until all parts of an outbound package are present. In this case no incomplete packages exist, but parts must be stored before they are assembled. Taking into account that the footprint of a single part is smaller than the footprint of a packaged part, this would increase the performance of the assembly department. However this method has some practical drawbacks. Tracing the parts and checking when a package is complete, takes a lot of time if there is no track and trace system involved. A suitable category of parts is the combined assembled parts. These parts are already stored in kits and grouped per chassis and therefore easy to check.
Suitable methods to analyse parameters and variables
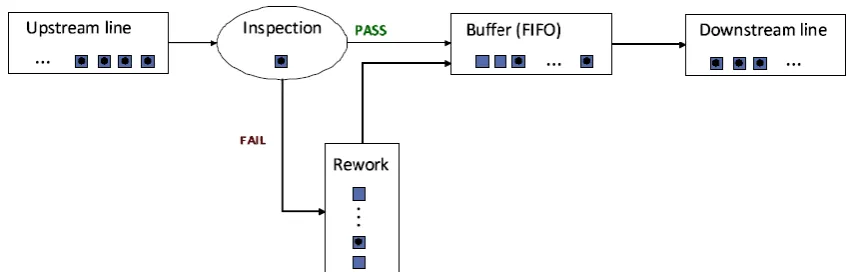
[image:4.595.87.511.611.747.2]When looking for a suitable analysis method, different options arise. They differ in the number of variables which can be analysed and to what extent they can be adapted in other circumstances. The first option is to use a Markov model, which is done for a simple process structure by R. Gábor et al (2015). Although the model is quite simple, the product flow has large similarities with the flow at Scania Meppel (Figure B).
By using a transition matrix, the direct run percentage for the parts is represented. Furthermore it contains the number of items at each location and the progress of rework. The model shows to what extent parts get out of sequence. Interesting is the relation between the direct run percentage and the rank change. The rank change increases for a direct run below 65%, decreases above 75% and remains constant in between. This effect is caused due to the number of items which have to be repaired, namely if all items should pass the repair, the sequence does not change at all.
Although the model shows some interesting results, the model does not include reruns, which add another flow and increase repair time. Also the number of incomplete packages cannot directly be related to the rank change of the individual items. Another issue with implementing this model is the number of different parts. Since parts have different transition probabilities, the model becomes significantly more complex by the increasing amount of parts. So the idea behind the research can be kept in mind when results are analysed, but the method itself is not applicable at Scania Meppel.
Since the number of parameters and parts is a weakness of the Markov model, methods without these weakness are examined. In literature two different methods can be found, Monte Carlo simulation and discrete event simulation, which is explained in this section (Leemis & Park, 2004).
The first method is Monte Carlo simulation, which uses a large number of runs to investigate different scenarios based on input variables. The outcome of those runs is analysed and used to draw conclusions. In general a Monte Carlo simulation has 5 different properties, which together result in a tool used to investigate a specific problem. These are:
• Probabilistic Results • Graphical Results • Sensitivity Analysis • Scenario Analysis
• Correlation of Inputs. (Palisade, 2017)
All these properties correspond with the requirements for this research, especially the correlations between input variables and performance can also be used to investigate a repairman problem (Rubinstein & Kroese, 2016). However the consequences, in terms of incomplete packages, of the different scenarios are hard to determine. The analysis works fine for the changes in direct run percentages, but this is not directly correlated to the number of incomplete packages, since the method does not include the sequence of products arriving at assembly.
Another method which can be used is discrete event simulation (Leemis & Park, 2004). This method is more sophisticated and more applicable in stochastic situations than Monte Carlo simulation. A definition is given by (Albrecht, 2010):
Discrete event simulation utilizes a mathematical/logical model of a physical system that portrays state changes at precise points in simulated time. Both the nature of the state change and the time at which the change occurs mandate precise description.
Different from the Monte Carlo simulation is the use of time and the opportunity to change a state at a precise point in time. These properties enable the use of discrete event simulation for more sophisticated analysis. Other arguments to use discrete event simulation are given by G. Fisherman (2013):
1. Enables an investigator to organize his theoretical beliefs and empirical observations about a system to deduce the logical implications of this organization
2. Leads to improved system understanding
4. Expedites the speed with which an analysis can be accomplished
5. Provides a framework for testing the desirability of system modifications 6. Is easier to manipulate than the system
7. Permits control of more sources of variation than direct study of a system allows 8. Is generally less costly than direct study of the system.
As explained, discrete event simulation is an analysis method which gives a lot of freedom and options to investigate the influence of different parameters and situations. This has great similarities with the goal of this research and therefore is the preferred analysis method. Other benefits of this method for Scania Meppel is the future use of the model. With the introduction of the new truck circumstances change rapidly. A static analysis method would not be suitable to easily adapt to the changing situation. During the programming of the model this requirement is kept in mind and the model is made dynamic enough to adapt easily. Furthermore the purpose of this research is to investigate a large number of variables and parameters, which is important to take into account when programming the situation.
How to simulate reality
To construct a simulation model, different aspects must be taken into account. For example, the model should represent the reality in such a way that the conclusions and recommendations are reliable. Furthermore, assumptions are made to be able to program some of the production steps. The assignment of parts to packages is done by using an algorithm. With testing and debugging this algorithm is tested and compared with observations to make sure it represents reality. Another validation step is the comparison of the results, with measurements during a certain period. These numbers were almost the same and therefore the model can be used to investigate the influence of the parameters. Furthermore a structured approach is used during the modeling which are the following steps:
1. Problem formulation
2. Setting of objectives and overall project plan 3. Model conceptualization
4. Data collection 5. Model translation 6. Verification 7. Validation
8. Experimental design
9. Production runs and analysis 10. Documentation and reporting 11. Implementation
After the model is verified and validated experiments are set up. Using a broad range of values for all variables combined with a full factorial experimental design, interferences between variables are shown. Based on the outcomes and using statistical software regression models are created for the total footprint as well as for individual packages. Due to confidentiality, these formulas cannot be presented, but the most important variables can be mentioned.
run and offline repair cycle time showed a large influence at the total footprint. Most of the other interferences can be neglected due to their small contribution to the total footprint.
Conclusions and recommendations
Using the results from the simulations and the analyses done, the four parameters can be ranked in order of influence at the total footprint. The most important one is the direct run percentage followed by offline repair cycle time, division between repair options and rerun cycle time. This ranking can be used when new projects are defined and improvements are made.
When looking at the different assembly feeding concepts, postponed assembly does influence the footprint, but does not show a large decrease in footprint. However, when looking at other performance indicators, this different feeding concept might be the best option. Research to feasibility of this project is therefore recommended with multiple performance indicators. Since improving all parts at the same time can be difficult, research is done to parts which contribute the most to the total footprint. Analysing these specific parts results in an advice per part. This makes it possible to improve the overall performance in an efficient way. Also differences between the packages came up, as the number of parts per package influenced the total footprint of incomplete packages.
Also, it should be mentioned that these results are probably dependent on the performance indicator. If on time delivery was taken as performance indicator rerun cycle time would probably be the most important. In this case, a long repair time can cause a missed delivery date, while a lot of short repairs does not influence this.
For future research different options are possible. First of all, the significance level of this model can be increased by adding more variables and increasing the accuracy of the input data. Another option is to extend the model by adding more departments. This would add a lot of value for Scania, since the number of variables simulated would increase. Furthermore, adding departments would not only improve the current analysis but also makes it possible to investigate changes in those departments. When for example new robots are added to the paint shop, the consequences at the assembly department can be investigated easily.
This bibliography only contains the references used in the public summary.
Bibliography
Albrecht, M. C. (2010). Introduction to Discrete Event Simulation.
Fisherman, G. S. (2013). Discrete-event simulation. New York: Springer Science & Business Media.
Leemis, L., & Park, S. (2004). Discrete-event simulation: A first course. Williamsburg.
Palisade. (2017, 04). Monte Carlo simulatie. Retrieved from Palisade: http://www.palisade.com/risk/monte_carlo_simulation.asp
Roser, C. (2014, 8 14). Theory and Practice on FiFo Lanes – How Does FiFo Work in Lean
Manufacturing? Retrieved from AllAboutLean: http://www.allaboutlean.com/fifo-lane/
Rubinstein, R. Y., & Kroese, D. P. (2016). Simulation of discrete event systems. In D. P. Reuven Y. Rubinstein, Simulation and the Monte Carlo Method (p. 101). Hoboken, NJ: John Wiley & Sons.
Rudolf, G., Noyan, N., & Giard, V. (2015). Modeling sequence scrambling and related phenomena in mixed-model production lines. European journal of Operational Research.
Scania. (2017, 6). Heritage. Retrieved from Scania Global: