http://go.warwick.ac.uk/lib-publications
Original citation:
Barnes, A. D. et al. (2005). On the origin of the absorption features in SS 433. Monthly
Notices of the Royal Astronomical Society, 365(1), pp. 296-302
Permanent WRAP url:
http://wrap.warwick.ac.uk/48767
Copyright and reuse:
The Warwick Research Archive Portal (WRAP) makes the work of researchers of the
University of Warwick available open access under the following conditions. Copyright ©
and all moral rights to the version of the paper presented here belong to the individual
author(s) and/or other copyright owners. To the extent reasonable and practicable the
material made available in WRAP has been checked for eligibility before being made
available.
Copies of full items can be used for personal research or study, educational, or
not-for-profit purposes without prior permission or charge. Provided that the authors, title and
full bibliographic details are credited, a hyperlink and/or URL is given for the original
metadata page and the content is not changed in any way.
Publisher’s statement:
"The definitive version is available at
www.blackwell-synergy.com
"
DOI: 10.1111/j.1365-2966.2005.09725.x
A note on versions:
The version presented here may differ from the published version or, version of record, if
you wish to cite this item you are advised to consult the publisher’s version. Please see
the ‘permanent WRAP url’ above for details on accessing the published version and note
that access may require a subscription.
arXiv:astro-ph/0510448v1 14 Oct 2005
On the Origin of the Absorption Features in SS 433
A. D. Barnes
1⋆, J. Casares
2, P. A. Charles
1,3, J. S. Clark
4,5, R. Cornelisse
1,
C. Knigge
1and D. Steeghs
61School of Physics and Astronomy, University of Southampton, SO17 1BJ, UK 2Instituto de Astrofisica de Canarias, 38200 La Laguna, Tenerife, Spain
3South African Astronomical Observatory, PO Box 9, Observatory 7935, Cape, South Africa
4Department of Physics and Astronomy, University College London, Gower Street, London, WC1E 6BT, UK 5Department of Physics and Astronomy, The Open University, Walton Hall, Milton Keynes, MK7 6AA, UK 6Harvard-Smithsonian Center for Astrophysics, MS-67, 60 Garden Street, Cambridge, MA 02138, USA
ABSTRACT
We present high-resolution optical spectroscopy of the X-ray binary system SS 433, obtained over a wide range of orbital phases. The spectra display numerous weak absorption features, and include the clearest example seen to date of those features, resembling a mid-A type supergiant spectrum, that have previously been associated with the mass donor star. However, the new data preclude the hypothesis that these features originate solely within the photosphere of the putative mass donor, indicating that there may be more than one region within the system producing an A supergiant-like spectrum, probably an accretion disc wind. Indeed, whilst we cannot confirm the possibility that the companion star is visible at certain phase combinations, it is possible that all supergiant-like features observed thus far are produced solely in a wind. We conclude that great care must be taken when interpreting the behaviour of these weak features.
Key words: binaries: close stars:binaries:individual:SS 433 stars:winds,outflows -binaries:spectroscopic
1 INTRODUCTION
The bizarre object SS 433 is a galactic X-ray binary at the centre of the supernova remnant W 50. It is observed as a weak (∼1036erg s−1) X-ray source (X1909+048), which com-bined with the high orbital inclination (i ∼ 78◦
) and low LX/Loptratio (V∼14.2) suggests that it may be an
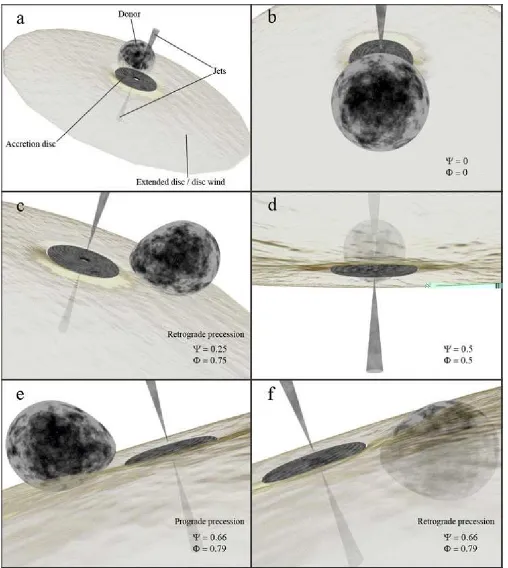
accre-tion disc corona source. In addiaccre-tion to its pair of relativistic jets (v ∼ 0.26c), recent radio observations have detected extended emission in a direction that is perpendicular to the main jet outflow (Blundell et al. 2001). This provides evidence for some form of circumbinary outflow such as a disc-like outflow of matter from the outer parts of the accre-tion disc (Zwitter et al. 1991). The overall system geometry suggested by these recent studies is illustrated in Fig. 1a, a schematic that we will use extensively throughout this pa-per.
The system displays two key periodicities, a ∼ 162d precession period of its jets and a ∼ 13d orbital period. The precession of the jets is revealed in the radial velocity curves of the strong, blue- and red-shifted ’moving’ Balmer emission lines (Margon 1984). This 162d modulation is also
⋆ E-mail: [email protected] (ADB)
present in the optical flux, a result of the changing ori-entation of the precessing accretion disc. The orbital pe-riod was first discovered through the radial velocity vari-ations of the ’stationary’ Balmer and He I emission lines (Crampton et al. 1980), which reach maximum velocity at superior conjunction of the X-ray source. However, the He II
λ4686 has a different radial velocity curve, with a velocity maximum occurring when the compact object is receding (Crampton & Hutchings 1981; Fabrika & Bychkova 1990). This may indicate an origin in or around the accretion disc/compact object.
Due to the strong and broad emission lines, the detection of any spectroscopic signatures of the donor star has proved rather more difficult, and the sugges-tions for its spectral type range from OB to Wolf-Rayet (Crampton & Hutchings 1981; van den Heuvel et al. 1979). Since the interpretation of the radial velocity curves requires assumptions about the mass donor, esti-mates for the mass of the compact object have ranged as widely as 0.8 M⊙ (d’Odorico et al. 1991) and 62 M⊙
2
A. D. Barnes et al.
is most open to the observer (Ψprec ∼0, Fig. 1b). During
this configuration of phases, light from the donor should be least ’obscured’ by the extended circumbinary disc or disc wind. Based on observations taken during this combi-nation of phases, Hillwig et al. (2004) discovered features corresponding with a mid-A supergiant (SG) and suggested that these could originate upon the donor star. This con-strained the binary system to be a low mass black hole (2.9
±0.7M⊙) with a 10.9±3.1M⊙companion, consistent with
the predictions of King et al. (2000).
However, these calculations were based upon limited or-bital phase coverage. In this paper we will test the possibility of observing the A SG features over a much broader range of phases in order to confirm their origin and provide a more secure estimate of the system parameters. In Section 2 we give an overview of the observations. In Section 3 we will be-gin with a general description of all our spectra, then discuss the three best spectra in more detail (Sections 3.1-3.3), and finish by presenting the radial velocities in Section 3.4. We will begin Section 4 with a discussion of the consequences of the model proposed by Gies et al. (2002b) and then discuss our findings.
2 OBSERVATIONS
SS 433 was observed using three different telescopes and instruments in the blue spectral range (λλ4000-5000) be-tween 2000 and 2004. Four high-resolution spectra of SS 433 were obtained with the TWIN spectrograph mounted on the 3.5 m telescope at Calar Alto observatory. A 1200 lines mm−1grating together with a 1.5′′
long slit coveredλλ 3700-4800 at 0.51 ˚A pix−1, yielding a spectral resolution of 67 km s−1 (FWHM) at 4550˚A. Two intermediate resolution
spec-tra (0.63 ˚A pix−1) were obtained using the Intermediate
Dispersion Spectrograph (IDS) attached to the 2.5 m Isaac Newton Telescope (INT) at the Observatorio del Roque de Los Muchachos on the nights of 15-16 August 2002. We used the R900V grating in combination with the 235 mm camera and a 1.2′′slit to provide a spectral resolution of 83 km s−1 (FWHM) at 4550˚A.
Nine high resolution spectra of SS 433 in addition to an A SG comparison star were also obtained using the blue arm of the ISIS spectrograph with the 4.2 m William Her-schel Telescope (WHT) at the Observatorio del Roque de Los Muchachos in June/July 2004. The R1200B grating was used with a central wavelength setting of 4550 ˚A and a 0.93′′
slit, giving a spectral resolution of 29 km s−1 (FWHM)
4550˚A. A complete log of the observations is presented in Table 1. Orbital phases have been calculated using the light-curve ephemeris of Goranskii et al. (1998), whilst disk pre-cession phases are based on the ephemeris of Gies et al. (2002a).
The images were bias corrected and flat-fielded, and the spectra subsequently extracted using conventional optimal extraction techniques in order to optimize the signal-to-noise ratio of the output (Horne 1986). Frequent observations of comparison arc lamp images were performed in the course of each run and the pixel-to-wavelength scale was derived through polynomial fits to a large number of identified refer-ence lines. The final rms scatter of the fit was always<1/30 of the spectral dispersion. Finally, the spectra have been
rec-tified using a high-pass filter to remove any low-order vari-ations (0.001–0.08 cycles/˚A) caused by the broad jet lines, and then the data were combined to produce an average spectrum for each night.
3 ANALYSIS
We analysed a portion of the continuum that is free of sta-tionary emission lines and rich in absorption features. The best available region encompasses the range between∼4500 – 4630 ˚A, which is bracketed by emission from He I λ4471 and the N III/C III complex∼4640-4650 ˚A.
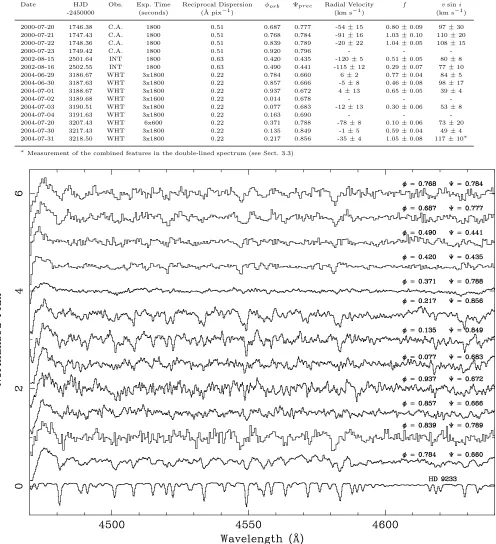
Spectra from twelve of the fifteen separate nights, cov-ering a broad range of orbital phases, display photospheric features that appear to be similar to that of an A SG (Fig. 2). Whilst the strongest Fe II absorption lines (λ4549 & λ4584 ˚
A) are present in each of these spectra, the morphology of these features, and indeed the presence of other weaker fea-tures, is highly variable, a fact which seems difficult to rec-oncile with the donor star being the only system component producing these lines.
We have extracted velocity measurements from each of the spectra which display clear A SG-like photospheric fea-tures by cross-correlating with an optimally broadened com-parison star (HD 9233). The systemic velocity of the compar-ison star was first removed (γ= -34±2 km s−1, Hillwig et al.
2004) and then the data were re-binned into velocity space and cross-correlated with the optimally broadened spectrum of HD 9233 across the range∼4500 – 4630 ˚A. The compar-ison star was smoothed to the resolution of the spectra for the Calar Alto and INT runs using a Gaussian smoothing algorithm. We present these results in Section 3.4, after a more detailed description and comparison of three of these spectra which display the clearest absorption lines.
For each nightly average spectrum, we broadened our A SG template from 39 to 99 km s−1 in steps of 2 km s−1, taking into account that the template star HD 9233
already possesses an intrinsic rotational broadening of 39 km s−1 (Hillwig et al. 2004). A spherical rotational profile
(Gray 1992) was applied, with a linear limb-darkening law of coefficient ǫ = 0.62, interpolated for λ = 4500 ˚A and
Tef f≃8350 K (Kudritzki et al. 2003; Al-Naimy 1978). The
broadened versions of the template star were multiplied by fractionsf<1, to account for the fractional contribution to the total light, and subsequently subtracted from the nightly average spectra for SS 433. Minimisingχ2 yields an optimal value forfandvsiniin each case (see Table 1).
3.1 A supergiant spectrum in SS 433?
As can be seen in Fig. 3 (Ψprec ∼0.66, φorb ∼ 0.78), we
have a remarkable match between the SS 433 spectrum and the A4 Iab comparison star. All of the key absorption lines present in this region of the comparison star also manifest themselves in our spectrum of SS 433, though broader and somewhat shallower, as might be expected due to the contin-uum emission of the accretion disc. Aχ2test on the residuals yieldsvsini= 84±5 km s−1, whilst the depth of the lines
are equivalent to an optimal scaling factor of 0.77 ±0.04.
Figure 1. Cartoon picture of the SS 433 system with an equatorially expanding extended disc, from the point of view of an observer on earth. In all panels the sense of precession is represented as being anti-clockwise, with orbital motion clockwise in the retrograde case and anti-clockwise in the prograde case.a) Overview. Note the extended disc is arbitrarily cut-off in the radial direction, and its opening angle is rather narrow, neither of which are confirmed physical parameters.b) Preferred phase combination of Hillwig et al. (2004). Donor could still be visible above the extended disc fromφorb∼0.75–0.25.c) Later Ψprec, but the donor could still be visible
above the extended disc at this combination of phases.d) Donor star becomes fully masked behind the extended disc, but will become partially visiblebelowthe disc fromφorb∼0.75–0. 25.e) &f) The system alignment on 2004 June 29. Here the donor is mostly visible
4
A. D. Barnes et al.
Table 1.Observing log of our SS 433 spectroscopy, and derived parameters. For each observation we give the orbital phase, φorb, and
precessional phase, Ψprec, at the time of the observation. We also give the radial velocities obtained via cross-correlation fitting, the
estimated scaling factor of the absorption lines compared to a mid-A SG comparison star,f, and the optimal broadening applied to the comparison star,vsini(see Sect. 3). The spectra from 2000-07-23, 2004-07-02 and 2004-07-04 do not display clear A SG-like features.
Date HJD Obs. Exp. Time Reciprocal Dispersion φorb Ψprec Radial Velocity f vsini
-2450000 (seconds) (˚A pix−1) (km s−1) (km s−1)
2000-07-20 1746.38 C.A. 1800 0.51 0.687 0.777 -54±15 0.80±0.09 97±30 2000-07-21 1747.43 C.A. 1800 0.51 0.768 0.784 -91±16 1.03±0.10 110±20 2000-07-22 1748.36 C.A. 1800 0.51 0.839 0.789 -20±22 1.04±0.05 108±15
2000-07-23 1749.42 C.A. 1800 0.51 0.920 0.796 - -
-2002-08-15 2501.64 INT 1800 0.63 0.420 0.435 -120±5 0.51±0.05 80±8 2002-08-16 2502.55 INT 1800 0.63 0.490 0.441 -115±12 0.29±0.07 77±10 2004-06-29 3186.67 WHT 3x1800 0.22 0.784 0.660 6±2 0.77±0.04 84±5 2004-06-30 3187.63 WHT 3x1800 0.22 0.857 0.666 -5±8 0.46±0.08 98±17 2004-07-01 3188.67 WHT 3x1800 0.22 0.937 0.672 4±13 0.65±0.05 39±4
2004-07-02 3189.68 WHT 3x1600 0.22 0.014 0.678 - -
-2004-07-03 3190.51 WHT 3x1800 0.22 0.077 0.683 -12±13 0.30±0.06 53±8
2004-07-04 3191.63 WHT 3x1800 0.22 0.163 0.690 - -
-2004-07-20 3207.43 WHT 6x600 0.22 0.371 0.788 -78±8 0.10±0.06 73±20 2004-07-30 3217.43 WHT 3x1800 0.22 0.135 0.849 -1±5 0.59±0.04 49±4 2004-07-31 3218.50 WHT 3x1800 0.22 0.217 0.856 -35±4 1.05±0.08 117±10∗
∗Measurement of the combined features in the double-lined spectrum (see Sect. 3.3)
Figure 3. Average spectrum of SS 433 from 2004 June 29 (Ψprec ∼ 0.66, φorb ∼ 0.78), together with the template star
HD 9233 broadened by different amounts (below), and the resid-ual of SS 433 - optimally broadened template (top).
Subtracting the optimally broadened template star from the average spectrum of SS 433 provides a remarkably clean residual spectrum (Fig. 3, top), with the only unusual features in the region of interest being the He Iλ4471 P Cyg profile, and a blue-shifted jet line bump (He Iλ4713) which has not been fully eliminated during the high-pass filtering process.
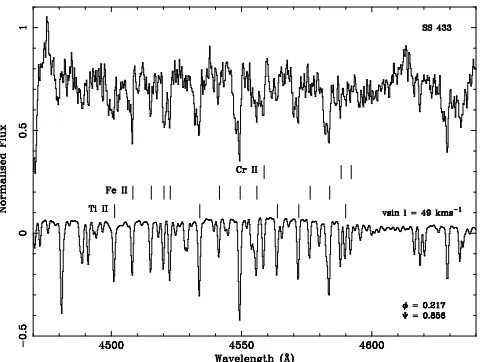
3.2 Narrow Absorption Lines
The spectrum displayed in Fig. 4 (Ψprec ∼ 0.85, φorb ∼
0.14) is also very rich in the A SG-like features identified by Hillwig et al. (2004), including many Fe II, Cr II and Ti II lines. However, it is immediately apparent even by eye that these absorption lines possess a much narrower and sharper profile (49±4 km s−1 compared to 84 km s−1) than those
from the observation in Sect. 3.1.
The fractional contribution of 0.59±0.04 is somewhat lower too, indicating that a large proportion of the light in this spectral region, at this particular time, may be produced elsewhere in the system, e.g. the accretion disc.
The family of absorption lines are slightly blue-shifted compared to the observation discussed in Sect. 3.1, with a velocity of -1±5 km s−1. If these lines are coming from the
donor star then this is not the expected behaviour, which should have been close to its maximum blue-shift in the earlier observation, and approaching maximum red-shift at this orbital phase.
3.3 Double Absorption Lines
Even more anomalously, the spectrum from the following night (Ψprec∼0.86, φorb∼0.22, Fig. 5) appears to possess
[image:6.612.43.283.97.279.2]absorption lines which are doubled (Fe II and Ti II), with a narrower red component blended with a broader, shallower blue. This feature is evident in each of the individual spec-tra from the night, and is not therefore the signature of some systematic error introduced when producing the aver-age spectrum for the night.
Figure 4. Average spectrum of SS 433 from 2004 July 30 (Ψprec ∼ 0.85, φorb ∼ 0.14). The template star HD 9233 is
shown below for comparison, broadened by different amounts, and the residual of SS 433 - optimally broadened template (top). The emission feature at∼4475 ˚A is a component of the He Iλ4471 P
Cyg profile (see text).
Figure 5. Average spectrum of SS 433 from 2004 July 31 (Ψprec∼0.86, φorb∼0.22). Note in particular the doubled
ab-sorption lines of Fe II and Ti II. Again, the template star HD 9233 is shown for comparison below, broadened to the optimal value from the previous night’s observations.
Cross-correlating the data from this night against the A SG comparison star gives a velocity of -35±4 km s−1. This
is again much bluer than expected, with the observation co-inciding with the expected maximal red-shift of the donor star. However, the cross-correlation technique in this case fails to fit either of the apparent absorption components in this spectrum, instead picking out an ’in-between’ velocity. Gaussians fitted individually to the red and blue features indicate velocities of -10±10 and -100±15 km s−1.
[image:6.612.306.546.380.561.2]6
A. D. Barnes et al.
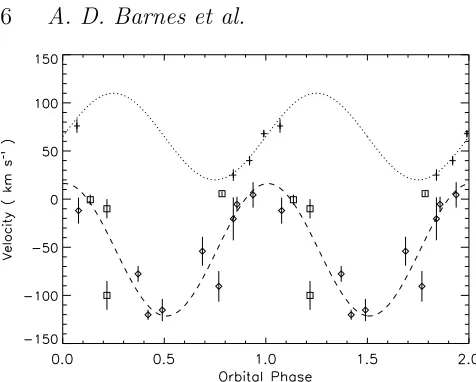
Figure 6. The radial velocities obtained via cross-correlation fitting in the λ4500–4600 ˚A region. The results obtained by Hillwig et al. (2004) are shown marked by pluses, together with their best-fitting sine curve (dotted line). The remaining points are the results of our own campaign, with those marked by squares representing the spectra selected for discussion in Section 3. The dashed line represents the best-fitting sine curve to these data. Note that two orbits have been plotted for clarity.
3.4 Absorption Line Velocities
Our data cover a broad range of orbital phases, and are dis-played in Fig. 6 as diamonds. The three spectra discussed in Sections 3.1–3.3 are marked with squares. Note that all the velocities used in this analysis were the result of cross-correlation with a comparison star, with the exception of the individual line fits discussed in Section 3.3. The results re-ported by Hillwig et al. (2004) are indicated by pluses, with the dotted line representing their best-fitting sine curve to these data. The best-fit sine curve to our data is marked by a dashed line, with semi-amplitude K = 69±4 km s−1, systemic velocityγ= -53±3 km s−1and with velocity
max-ima occuring at orbital conjunction, 0.26±0.01 out of phase with the motion of the accretion disc (Fabrika & Bychkova 1990).
4 DISCUSSION
4.1 A model for SS 433
Gies et al. (2002b) and Hillwig et al. (2004) state that the mass donor is ideally observed around the primary eclipse and when the accretion disc has precessed to its most face-on position (Ψprec∼φorb∼0). The donor star would then have
the highest chance of being positioned above and between any extended disc and an observer (Fig. 1b). Extending this idea, it should also be possible to detect the donor star at certain other combinations of phases. In Fig. 1cwe show an example, with the companion being positioned clearly above the extended disc, whilst in Fig. 1dwe have the inverse situa-tion, with the companion star being totally obscured behind the extended disc. However, at this Ψprec the companion
could become partially visiblebelowthe extended disc from
φorb ∼0.75– 0.25. The extent to which we may be able to
observe the companion will be determined by the opening angle and radial size of the extended disc, parameters which
are currently not well constrained, in addition to the degree of irradiation of the inner face of the donor star from the accretion disc (Cherepashchuk et al. 2005).
If this scenario is correct, it can provide direct observa-tional information about the precession evident in the sys-tem. Confirming whether it be prograde or the preferred retrograde model (Newsom & Collins 1982) with respect to the donor star could perhaps cast further light upon the physics driving the precession (Katz 1981; Leibowitz 1984). From Figs. 1 e & f, representing the system alignment of the spectrum discussed in Section 3.1, it becomes clear that the companion star could only be visible above the disc at this combination of phases if the precession were prograde in nature, with the extended disc masking the donor in the case of retrograde precession.
The presence of the same A SG-like features reported by Hillwig et al. (2004) in many of our spectra, at a range of dif-ferent orbital and precessional phases, would at first glance seem to indicate that our data support this scheme. In par-ticular, the observation discussed in Section 3.1 (where the accretion disc is close to edge-on, Ψprec∼0.66, φorb∼0.78)
provides an unsurpassed match between an A4 Iab compari-son star and SS 433 (Fig. 3). If these features really do orig-inate upon the donor star, then the depth and strength of the lines are equivalent to a scaling factor of 0.77± 0.04. This would indicate a surprisingly high contribution to the total light at this combination of phases, compared to ob-servations with the disc face-on, where Hillwig et al. (2004) find a fractional contribution of 0.36±0.07.
We can compare our estimated scaling factor with that expected from observed light curves of SS 433 in a simi-lar manner to Hillwig et al. (2004). The key assumption re-quired is that the donor star is totally eclipsed by the disc at Ψprec= 0 andφorb= 0.5, and at all other times both the
donor and the accretion disc are contributing to the total light. The V-band light-curves of Zwitter et al. (1991) im-ply a potential fractional contribution for the donor star of roughly 0.70± 0.15 at Ψprec∼ 0.66, φorb ∼0.78. Whilst
this prediction appears to be consistent with our observa-tional data, we must note that there is a large degree of scatter evident in the observed precessional light curves, in-troducing a degree of systematic error into these calcula-tions. Indeed, if we use the same method to predict the donor contribution at phase combination Ψprec ∼φorb ∼0 from
the Zwitter et al. (1991) light curves, the resulting estimate is too high by a factor of three.
If we presume the absorption features noted in Section 3.1 to be a signature of the donor star, then retrograde pre-cession may be immediately ruled out. However, the same features also occur in the spectra discussed in Sections 3.2– 3.3. These observations were performed at a phase combina-tion where the donor should be obscured assuming prograde precession, and visible in the retrograde case. In addition to this apparent conflict, we must also account for the unusual velocity behaviour of these weak absorption features.
4.2 A disc wind origin?
Cross-correlating our spectra of SS 433 with an A supergiant spectrum produces a velocity curve (Fig. 6,γ= -53±3 km
s−1) which is far removed in terms of systemic velocity from
though it is close to the result of Gies et al. (2002b), where
γ = -44 ± 9 km s−1. Additionally, it is almost exactly a
quarter out of phase with the Fabrika & Bychkova (1990) He II curve (where γ= -22 ±14 km s−1) which traces the
motion of the compact object.
The occurence of a velocity maximum at orbital con-junction essentially precludes the possibility that these fea-tures were produced in the photosphere of the companion. Whilst it is extremely difficult to pin down a particular re-gion within the system which could produce this velocity signature, it is interesting to note that this behaviour has been reported before. Gies et al. (2002a) find the ’station-ary’ He I and Hαemission lines display a remarkably similar semi-amplitude and phasing to the A SG-like features inves-tigated here. This is attributed to a clumpy wind outflow from the accretion disc rather than the disc itself or to a gas stream (Goranskii et al. 1997; Gies et al. 2002a). Although there is a large disparity in line widths between the station-ary emission lines and our narrow absorption lines, if what we observe in SS 433 is a structured outflow then we would expect to see narrow absorption components from localised density enhancements in the wind. This would appear to indicate that for at least some combinations of orbital and precessional phases the A SG ’photospheric’ features arise not from the donor but instead from a localised area that can be associated with the region where the He I and Hα
stationary emission lines are produced.
We also have some longer wavelength data collected during the 2004 observing campaign in La Palma with ISIS (∼8400-8900˚A), to be published in a later paper. Here we identify heavily blended Ca II and weak N I absorption lines, which again correspond to the absorption features expected for an early-mid A SG. Interestingly, there appears to be a strong positive correlation between the strength of the P Cygni profiles seen in the Paschen lines and the strength of the Ca II and N I lines, implying another link between traditional wind features and those typical of the proposed companion star.
The strongest evidence to date for an A SG donor is the data presented by Hillwig et al. (2004). They base their identification on three criteria which suggest an association with the donor, namely the radial velocity curve charac-teristics, the absorption line depths and the absorption line width. However, their data do not cover the key phases when there should be a turnover in velocity space (φorb ∼0.25,
0.75), which would unambiguously associate the lines with the donor. Interestingly, a number of our own spectra which can be clearly associated with an outflow also meet at least two of the above criteria (see Table 1), with only the velocity curve excluding an association with the donor.
The large offset between the systemic velocity detected by Hillwig et al. (2004) and in our data could be a poten-tial problem for a purely circumbinary outflow origin. How-ever, this velocity offset could be explained by a consider-able cycle to cycle variation in the semi-amplitude of the ’stationary’ emission lines originating in the accretion disc wind (Gies et al. 2002a). Another problem could be the dou-bled absorption lines shown in Fig. 5. This could perhaps be indicative of two entirely separate regions with identical spectral signatures, though neither component corresponds to a possible donor star origin. It seems more likely that two different components of a clumpy wind outflow could
concurrently pass through the line-of-sight, as proposed by Gies et al. (2002a) and L´epine et al. (2000).
5 CONCLUSIONS
Our series of high-resolution optical spectra of SS 433 clearly display numerous typical A SG photospheric features, as reported by several authors and attributed to a putative mass donor. However, the velocities of these features do not correspond to the expected motion of the mass donor, but rather to the Hαand He I ’stationary’ emission lines noted by Gies et al. (2002a) and assumed to originate in a clumpy, accretion-driven outflow.
Although the observations of Hillwig et al. (2004) are suggestive of an A SG-like donor, we cannot exclude the possibility that these features originate from the same highly variable accretion-driven wind. If these lines are consistent over a number of observations at Ψprec∼φorb∼0 then it
would seem likely that they are a signature of the donor. In this case the large off-set in systemic velocity between the Hillwig et al. (2004) data and ours could be due to the velocity of the outflow towards our line of sight. However, if the lines originate exclusively in some form of outflow, then we would expect them to be rather variable in terms of width, depth, shape and velocity. In any case, considerable care must be taken to correctly interpret these features and thus determine the nature of the stellar components within the SS 433 system.
ACKNOWLEDGMENTS
We gratefully acknowledge A.B. Hill and D. Moss for artis-tic direction, and Ph. Podsiadlowski and the referee D.R. Gies for helpful comments. ADB is supported by a PPARC Studentship. JSC is supported by an RCUK Fellowship. DS acknowledges a Smithsonian Astrophysical Observatory Clay Fellowship. JC acknowledges support from the Span-ish MCYT grant AYA2002-0036. Based on observations col-lected at the Centro Astronomico Hispano Aleman (CAHA) at Calar Alto, operated jointly by the Max-Planck Institut fur Astronomie and the Instituto de Astrofisica de Andalu-cia (CSIC). The INT and WHT are operated on the island of La Palma by the Isaac Newton Group in the Spanish Ob-servatorio del Roque de los Muchachos of the Instituto de Astrofisica de Canarias. We gratefully acknowledge the use of themollypackage developed by T.R. Marsh.
REFERENCES
Al-Naimy, H. M. 1978, Ap&SS, 53, 181
Antokhina E.A., Cherepashchuk A.M., 1985, SvAL, 11, 4A Blundell K.M., Mioduszewski A.J., Muxlow T.W.B.,
Pod-siadlowski P., Rupen M.P., 2001, ApJ, 562, L79
Cherepashchuk A.M., Sunyaev R.A., Fabrika S.N. et al., 2005, accepted by A&A, (astro-ph/0503352)
Crampton D., Cowley A.P., Hutchings J.B., 1980, ApJ, 235, L131
Crampton D., Hutchings J.B., 1981, ApJ, 251, 604 D’Odorico S., Oosterloo T., Zwitter T., Calvani M., 1991,
8
A. D. Barnes et al.
Fabrika S.N., Bychkova L.V., 1990, A&A, 240, L5 Fabrika S.N., 1997, Ap&SS, 252, 439
Gies D.R., McSwain M.V., Riddle, R.L., Wang Z., Wiita P.J., Wingert D.W., 2002a, ApJ, 566, 1069
Gies D.R., Huang W., McSwain M.V., 2002b, ApJ, 578, L67
Goranskii V.P., Fabrika S.N., Rakhimov V.Yu., Panferov A.A., Belov A.N., Bychkova L.V., 1997, Astron. Rep., 41, 656
Goranskii V.P., Esipov V.F., Cherepashchuk A.M., 1998, Astron. Rep., 42, 209
Gray, D. F. 1992, The Observation and Analysis of Stel-lar Photospheres (2nd ed.; Cambridge: Cambridge Univ. Press)
Hillwig T.C., Gies D.R., Huang W., McSwain M.V., Stark M.A., van der Meer A., Kaper L., 2004, ApJ, 615, 422 Horne K., 1986, PASP, 98, 609
Katz J.I., 1981, A&A, 95, L15
King A.R., Taam R.E., Begelman M.C., 2000, ApJ, 530, L25
Kudritzki R.P., Bresolin F., Przybilla N., 2003, ApJ, 582, L83
Leibowitz E. M., 1984, MNRAS, 210, 279
L´epine S., Moffat A.F.J., St-Louis N. et al, 2000, AJ, 120, 3201
Margon B., 1984, ARA&A, 22, 507
Newsom G.H., Collins G.W., 1982, ApJ, 262, 714
van den Heuvel E.P.J., Ostriker J.P., Petterson J.A., 1979, A&A, 81, L7