A Thesis Submitted for the Degree of PhD at the University of Warwick
Permanent WRAP URL:
http://wrap.warwick.ac.uk/107576/
Copyright and reuse:
This thesis is made available online and is protected by original copyright.
Please scroll down to view the document itself.
Please refer to the repository record for this item for information to help you to cite it.
Our policy information is available from the repository home page.
Novel Silicate Matrix Composites.
by
A.Chamberlain, BSc (Hons).
For submission
to the degree of
Doctor of Philosophy.
University of Warwick
Department of Physics
Contents.
Chapter 1. Engineering Ceramics.
1.1. Ceramic Materials. 1.
1.2. Current Gas Turbine Materials and Structural Composites. 2.
1.3. Monolithic Ceramics. 5.
1.3.1. Examples of Monolithic Ceramics for Engineering 10. Applications.
1.4. Composite Ceramics. 14.
1.5. Fibre Reinforced Ceramics. 16.
1.6. Glass Ceramics. 19.
Chapter 2. Continuous Fibre Reinforced Ceramic Matrix
Composites.
2.1. Composite Theory. 22.
2.1.1. Introduction, Matrix Microcracking and
Residual Stress. 22.
2.1.2. Composite Ultimate Strength. 27. 2.1.3. Measurement of the In-situ Materials Properties. 29. 2.1.4. The Behaviour of 2D Composites. 31. 2.2. Ceramic Matrix Composites : Fabrication and Properties. 32. 2.2.1. Fibre and Matrix Properties. 32. 2.2.2. Methods of CMC Fabrication. 36. 2.3. Glass Ceramic Matrix Composites. 43. 2.4. Selection of Fibre and Matrix. 47. 2.5. Research Program Objectives. 52.
Chapter 3. Experimental Techniques.
3.1. Scanning Electron Microscopy. 53.
3.1.1. Specimen Preparation. 53.
3.1.2. SEM Imaging. 54.
3.2. Transmission Electron Microscopy. 55.
3.2.1. Specimen Preparation. 55.
3.2.2. TEM Imaging. 56.
3.3. X - Ray Diffraction. 57.
3.4. Differential Thermal Analysis ( DTA ). 57.
3.5. Mechanical Testing. 58.
3.5.1. Room Temperature Mechanical Testing. 60. 3.5.2. Elevated Temperature Mechanical Testing. 63. 3.5.3. Creep Deformation Testing. 65. 3.6. Micromechanical Measurement. 65. 3.7. Miscellaneous Characterisation Techniques. 67.
Chapter 4. Composition Selection and Composite Fabrication.
4.1. Composition Selection. 69.
4.1.1. Silicate Ceramic Phases and the Glass Ceramic Process. 69. 4.1.2. Glass Preparation and Crystallisation. 76.
4.2. Composite Fabrication. 83.
4.2.1. Chopped Fibre Systems. 83.
5.1. Chopped Fibre Materials. 97. 5.2. Unidirectional Composite Materials. 106. 5.2.1. Microstructural Investigation. 106. 5.2.2. Interfacial Structure and Micromechanical Behaviour. 115. 5.3. Discussion of the Microstructure and Interfacial Properties of the
Composites. 120.
5.3.1. Matrix Densification and Crystallisation. 120. 5.3.2. Composite Interface, Microstructure and Properties. 122.
Chapter 6. Mechanical Behaviour of MAS Matrix
Composites.
6.1. Mechanical Response of Monolithic Glass Ceramics. 136. 6.2. Thermal Expansion Characterisation. 137. 6.3. The Mechanical Behaviour of Composite Materials. 140. 6.3.1. Room Temperature Testing in Flexure. 141. 6.3.2. Room Temperature Tests in Tension. 150. 6.3.3. The Mechanical Behaviour of Composite Materials at
Elevated Temperature. 153.
6.3.4. The Mechanical Behaviour of Composite Materials
Subjected to Thermal Aging Treatments in Air. 155. 6.3.5. The Creep Deformation of Composite Materials in Air. 163.
Chapter 5. M icrostructure and Interfacial Properties o f M A S M atrix C om posites.
iii
Chapter 7. C om parative Studies o n C A S M atrix C om posites.
7.1. Composition Selection and Composite Fabrication. 169. 7.2. Mechanical Properties of CAS Composite Materials. 172. 7.3. Conclusion from the Comparative Study. 173.
Chapter 8. Overview, Conclusions and Future Work.
8.1. Overview. 175.
8.2. Conclusions. 179.
8.3. Future Work. 181.
List of Figures and Tables.
Figures.
Chapter 1.
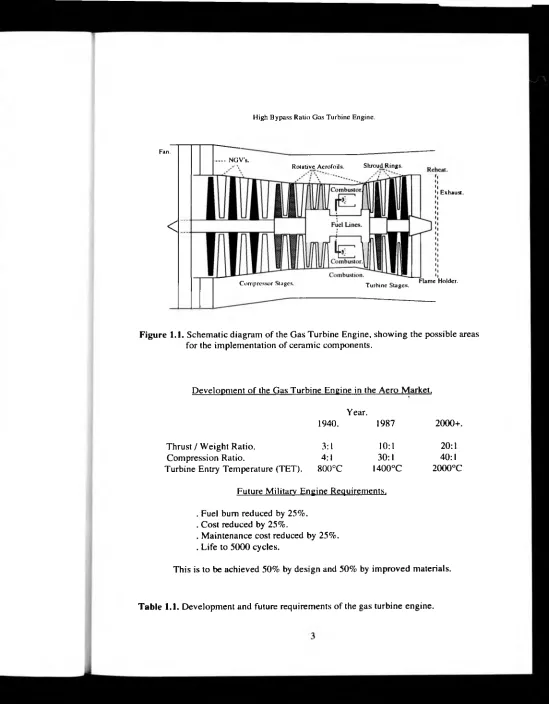
Figure 1.1. Schematic diagram of the gas turbine engine, showing the possible areas for the implementation of ceramic
components.
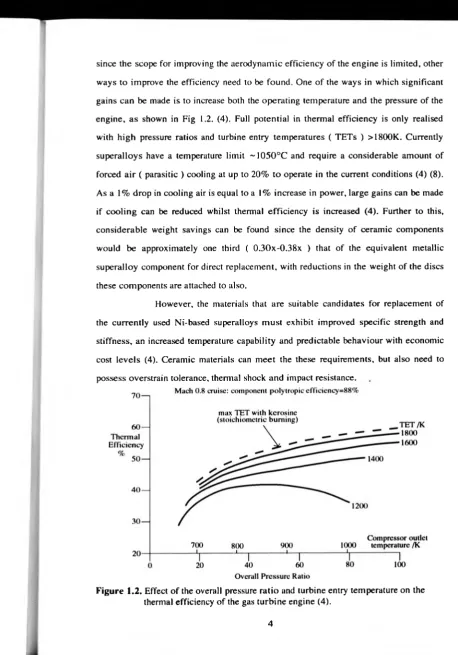
Figure 1.2. Effect of the overall pressure ratio and the turbine entry temperature on the thermal efficiency of the gas turbine engine (4).
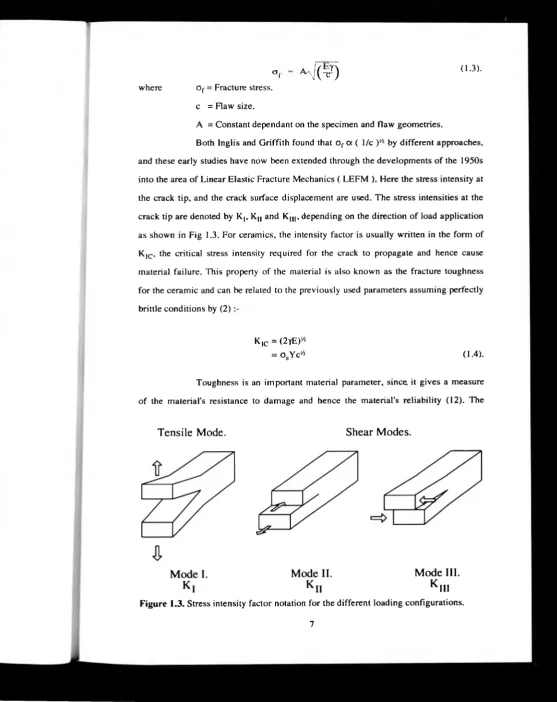
Figure 1.3. Stress intensity factor notation for the different loading configurations.
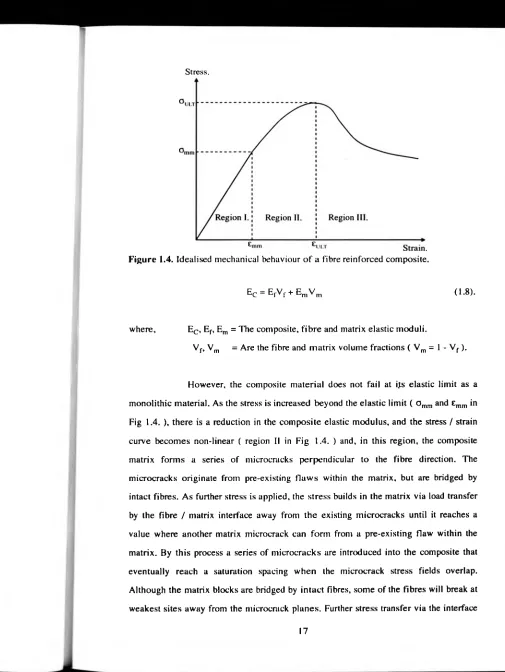
Figure 1.4. Idealised mechanical behaviour of a fibre reinforced composite.
Chapter 2.
Figure 2.1. Evolution o f matrix cracks in a CMC system. As the applied stress increases, failure occurs at the defect sites.
Figure 2.2. The ACK model schematically depicting the transition from single to multiple fracture dependence on fibre volume fraction.
Figure 2.3. Composite ultimate strength dependence on Weibull 'm' value. From Curtin (65).
Figure 2.4. Schematic illustration of materials parameters used for the determination of the in-situ composite properties.
Figure 2.5. Schematic stress / strain curve for a 0° / 90° composite. Figure 2.6. Schematic o f the interface formation in silicate matrix
composites showing the direction of ionic or molecular diffusion.
Figure 2.7. Processing compromises in the fabrication of GCMCs.
Chapter 3.
Figure 3.1. Schematic DTA trace illustrating the type of features obtained.
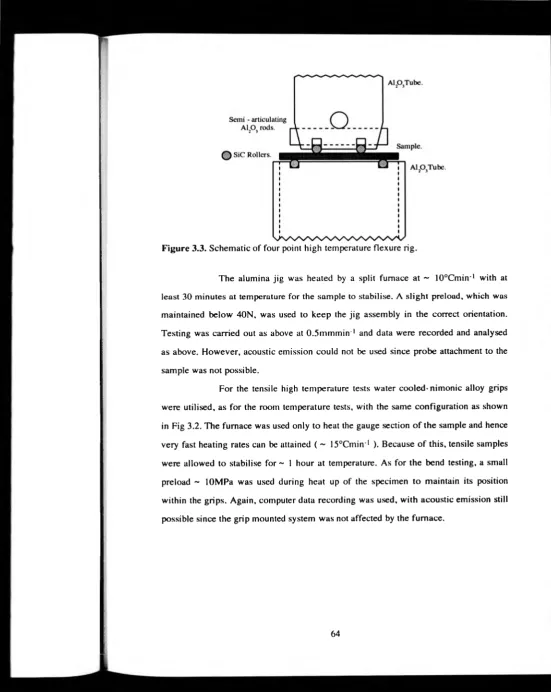
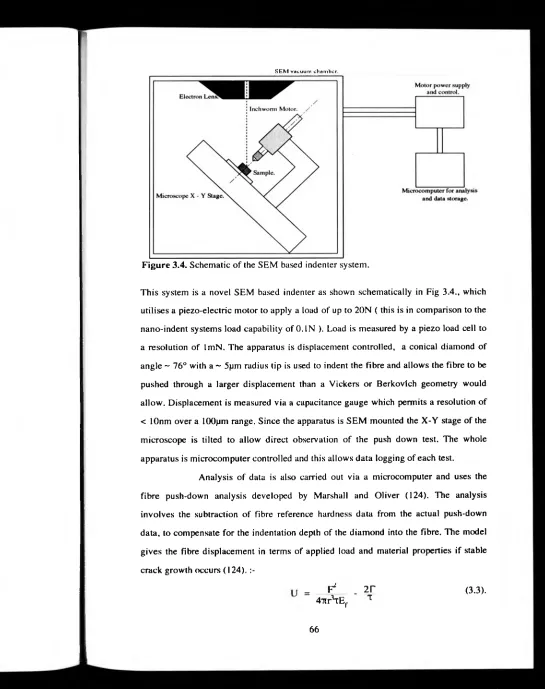
Figure 3.2. Tensile gripping arrangement and specimen geometry. Figure 3.3. Schematic of the four point high temperature flexure rig. Figure 3.4. Schematic of the SEM based indenter system.
Chapter 4.
Figure 4.1. Part of the MAS ternary diagram.
Figure 4.2. Nucleation and growth for a glass ceramic system.
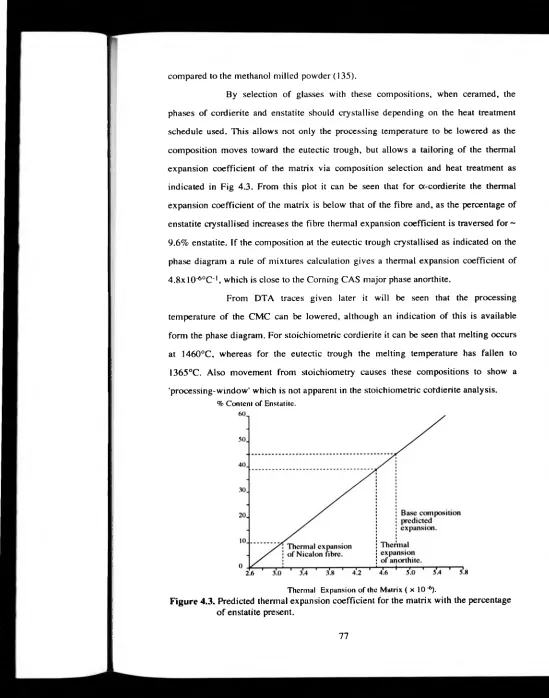
Figure 4.3. Predicted thermal expansion coefficient for the matrix with the percentage of enstatite present.
Figure 4.4. DTA traces for the powders studied. Figure 4.5. Schematic of the hot press system.
Figure 4.6. Schematic process routes for Window I and Window II schedules.
Figure 4.7. XRD trace for CF1.
Figure 4.8. Schematic of the pre - preg apparatus developed in this program.
Figure 4.9. Schematic of the optimised process route for composite fabrication.
Chapter 5.
Figure 5.6. SEM backscattered micrograph of CF14.
Figure 5.7. SEM backscattered micrograph of the BGMC glass ceramic. Figure 5.8. SEM backscattered micrograph of the CDM glass ceramic. Figure 5.9. TEM micrograph showing the fibre / matrix interface in CF2. Figure 5.10. SEM backscattered micrograph indicating the structure of
UDM2.
Figure 5.11a. Low magnification SEM backscattered micrograph of CUDM5.
Figure 5.1 lb. Higher magnification SEM backscattered micrograph of CUDM5.
Figure 5.12a. Lower magnification SEM secondary electron micrograph of CUDM17.
Figure 5.12b. Higher magnification SEM backscattered micrograph of CUDM17.
Figure 5.13a. Lower magnification SEM backscattered micrograph of CUDM18 unidirectional.
Figure 5.13b. Higher magnification SEM backscattered micrograph of CUDM18 unidirectional.
Figure 5.14a. Lower magnification SEM backscattered micrograph of CUDM19 unidirectional.
Figure 5.14b Higher magnification SEM backscattered micrograph of CUDM19 unidirectional.
Figure 5.15. High magnification SEM secondary electron micrograph of CUDM19 cross-ply.
Figure 5.16. SEM backscattered micrograph for450°C aging. Figure 5.17. SEM backscattered micrograph for 1000°C aging of
CUDMI2.
Figure 5.18. TEM micrograph and light element analysis results for UDM4.
Figure 5.19. TEM micrograph and light element analysis results for CUDM7.
Figure 5.20. TEM micrograph and light element analysis results for CUDM7 after aging at 700°C for lOOhrs.
Figure 5.21. SEM micrograph showing indented fibre.
Figure 5.22. Load versus tip displacement plots for the NL-201 and NL-607 fibres.
Figure 5.23. Graphical plot of the interfacial micromechanical properties 2T and 1, compared to thermal aging temperature.
Figure 5.24. Schematic diagram indicating the degradation of the composite at intermediate and high temperatures by 'pipe line' oxidation.
Chapter 6.
Figure 6.1. Thermal expansion coefficients for composites with Vf = 0.5 versus the percentage of enstatite.
Figure 6.2. Stress / deflection curve for CUDM7, with a backscattered SEM micrograph of the tensile face of a composite specimen. Figure 6.3. Stress / deflection curve for CUDM11.
Figure 6.4. Plot of modelling strength verses Vf. The models used are the simple bundle failure, TSSE (67) and Curtin (65). Also plotted are literature values for comparison with the materials fabricated in this study.
Figure 6.5. A typical tensile test curve for cross ply CUDM18 sample at room temperature is shown in a), and a hysteresis curve in b).
Figure 6.6. Stress / deflection curve for CUDM15 tested in four point flexure at 450°C during a short term exposure.
Figure 6.8. Summary plot for the aged 3hr isotherm composites indicating the trends in Omm and o UBS.
Figure 6.9. Stress / deflection curve for CUDM 12 aged at 450°C. Figure 6.10. Stress / deflection curve for CUDM11 aged at 700°C. Figure 6.11. Stress / deflection curve for CUDM 14 aged at 1000°C. Figure 6.12. Stress / deflection curve for CUDM 14 aged at 1200°C. Figure 6.13. Summary plots for the Rolls-Royce fabricated composites
indicating the trends in omm and o UBS. Figure 6.14. Typical creep deformation curves.
Chapter 7.
Figure 7.1. Part of the CAS ternary system. Figure 7.2. DTA traces for the CAS glasses.
Figure 7.3. Typical stress / deflection curve for a CAS / NL - 607 composite.
Tables.
Chapter 1.
Table 1.1. Development and future requirements of the gas turbine engine.
Table 1.2. Mechanical property data for some monolithic engineering ceramics.
Table 1.3. Mechanical property data for some whisker and platelet reinforced ceramic matrix composites.
Table 1.4. Mechanical property data for some glass ceramics.
Table 1.5. Thermal expansion data for some commonly used crystalline phases in glass ceramics ( All data taken from (51) and (52)).
Chapter 2.
Chapter 4.
Chapter 5.
Chapter 6.
Table 2.1. Properties of fibre reinforcements.
Table 2.2. Process routes available for CMC fabrication. Table 2.3. Properties of CMC fabricated systems.
Table 2.4. Possible maximum use temperatures of some glass ceramic and glass systems ( from (39) ). § denotes a Coming Glass Works designation.
Table 2.5. Measured interfacial properties for some GCMCs.
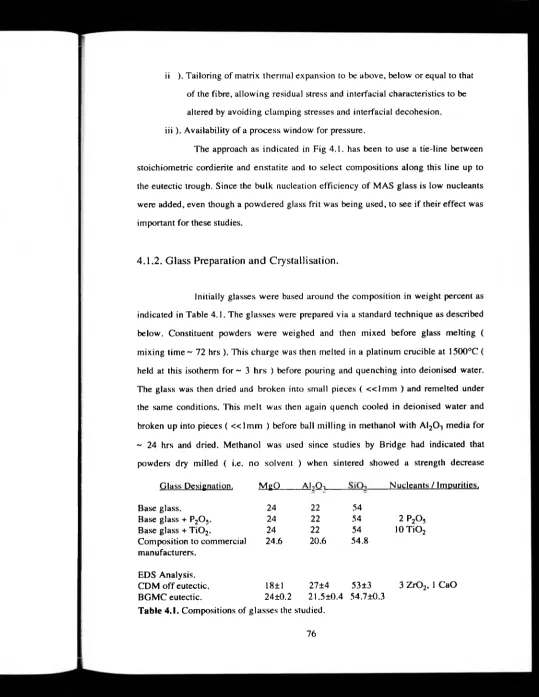
Table 4.1. Compositions of the glasses studied.
Table 4.2. Particle size analysis results for the glasses studied.
Table 4.3. Chopped fibre pressings, the pressure used was lOMPa in all cases.
Table 4.4. Identification of the composite samples fabricated.
Table 5.1. Micromechanical property measurements fo.r composites in this study.
Table 6.1. Flexural test data for the glass ceramics fabricated in this study.
Table 6.2. Thermal expansion coefficients for the materials fabricated in this study.
Table 6.3. Summary of the mechanical test data for the UDM series of composites.
Table 6.4. Summary of the mechanical test data for the CUDM series of unidirectional composites.
ACKNOWLEDGEMENTS.
I would like to thank a number of people for their help, patience, guidance and encouragement during the course of this work. To begin, I would like to thank my supervisor. Professor Mike Lewis for his help and guidance. Both Rolls- Royce and the SERC are gratefully acknowledged for financial support during the three year duration of this work.
Over the three years, I have had the privilege and pleasure of working with many people within the Physics Department at the University of Warwick all of whom have helped and encouraged me during this work. Gerry Smith and Steve York have shown both considerable expertise as well as patience. Thanks also to Steve ' Flash' Carpenter, Dave Hammond, Bob Lamb, Pat Beecraft, Rebecca Cain, and Keith Briggs. Past and present members of the Centre for Advanced Materials have given valuable time and insight over a wide variety of topics and so I have been fortunate to work with Markys Cain, John Lumby, Mark Pharaoh, Tony Razzell, Stuart Sutherland, Adrian Daniel, Hong Feng, Olwen Pullum, Czaba and Marianna Rappensberger, Stefan Bjorkert and Hywell Jones. Notably, 1 must thank Adrian Daniel for the use of his indenter system, Tony Razzell for the loan of a computer, and Martin Lockyer for particle size analysis.
Within Rolls-Royce, help and encouragement was also to be found, and I would like to thank Colin Beesley, Andy Bennet, Bob Minor, Paul Doleman, Ted Butler and all of the ceramics team for their help.
Away from the world of ceramics, I would like to thank a number of people. Thanks goes to good friends Squash and Mickey, all the gym goers at Warwick, Arts Fed and the Ballingham Boys.
Declaration.
This thesis is submitted to the University of Warwick in support o f my application for the admission to the degree of Doctor of Philosophy. It is an account of my work carried out in the Department of Physics, University of Warwick during the period October 1990-July 1994, and except where specifically acknowledged in the text, is a result of my own independent research. No part of this thesis has been submitted in respect of a degree to this or any other University.
Part of this work has been presented previously at conferences, appearing in the proceedings as follows
1. Lewis M.H., Daniel A.M., Chamberlain A.. Pharaoh M.W. and Cain M.G., J. Microsc. 169, 109(1993).
2. Chamberlain A. and Lewis M.H.. Ceram. Eng. Sci. Proc. 14[9-10], 939 (1993). 3. Chamberlain A., Daniel A.M., Pharaoh M.W. and Lewis M.H., HTCMC 1,321.
Ed. Naslain R., Lamon J. and Doumiengts D. ECCM-6 Bordeaux 1993. Woodhead Publishing.
4. Lewis M.H., Chamberlain A.. Daniel A.M., Pharaoh M.W., Razzell A.G. and Sutherland S. Ref 10. AGARD - R - 795. "Introduction of Ceramics into Aerospace Structural Composites.". Antalya Turkey 1993.
xiii
Abstract.
Within this study, a novel matrix selection principle, within the MAS glass ceramic system, has been developed with emphasis placed on the use of this matrix in a ceramic fibre reinforced composite. Matrix selection was applied in order to develop a diphasic microstructure to allow tailoring of the matrix thermal expansion coefficient via a phase mixture. The phases selected were a-cordierite and enstatite, with a Nicalon fibre reinforcement. Initial studies centred on the use of chopped fibre systems in order to develop a processing methodology giving the correct phase structure, microstructure and interface development between the matrix and the fibre. It was found that variations in process route including the use of window I and window II pressing regimes ( below and above the maximum crystallisation rate ) caused large differences in the matrix microstructure. During this part of the study the effects of added nucleants were investigated ( P2O5 at 2wt%, and T i02 at 10wt% ), the results indicating that, with the use of glass frit, the added nucleant was not necessary. Initial studies upon composite fabrication indicated the criticality of pressure application during processing indicated by a fall in the elastic modulus of the composite from the rule of mixtures calculation.
A pre-preg methodology was developed to produce high quality green state composite, including a T-piece traverse head arrangement for the fibre tow infill, 'walls' on the winding cage and rollering the pre-preg sheets. Following this, a refined process route for hot pressing was developed with application of pressure during heating in a 'process-window' identified using DTA. Composites were fabricated using the NL-607 fibre type with optimised properties reaching a matrix microcracking stress of c mm = 665±75MPa, ultimate flexure strength of o UBS = 1168±41MPa and E = 157±12GPa ( within the rule of mixtures calculation ). TEM analysis indicated an interface width of 25-70nm. with carbon enrichment occurring. Measurement of the micromechanical properties of the interface used an indentation technique giving the interfacial debond energy 2T = 12.4±5.4Jnv2, and shear sliding resistance T = 48±15MPa. Tensile studies indicated that two regions could be identified associated with microcracking in the 90° and 0° plies by a modulus drop and acoustic emission.
Thermal aging in air ( lOOhrs ) indicated that channelled oxidation via fibre / matrix interfaces was occurring at intermediate temperatures ( 450° - 700°C ) and partial silica bridging of the interface at higher temperatures in this interval. Micromechanical property measurements indicated that for 450°C aging 2T = 13.6±4.4Jnr2 with T = 108±54 MPa, whereas for 700°C aging 2T = 35.6±29.2Jnr2 with T = 248±120MPa. At higher temperatures ( 1000°C ), rapid silica bridging of the interface caused plugging to occur and the retention of as-fabricated mechanical properties for the bulk material. Fibres in the bulk of the composite had micromechanical properties similar to as fabricated materials, whereas fibres ~ 30pm from the edge of the sample had very high micromechanical properties indicative of fully silica bridged interfaces. Above 1000°C microstructural degradation was observed with the formation of a surface layer on the composites ( 60-80pm at 1000°C, 80-
140pm at 1200°C ).
Chapter 1. Engineering Ceramics.
1.1. Ceramic Materials.
Ceramics form a group of materials offering a diverse and sometimes unique set of properties. They are inorganic, non-metallic materials, usually consisting of more than one elemental species, processed at an elevated temperature. The applications of ceramics are numerous, particularly with respect to the more traditional roles of whiteware and earthenware. However, more recently, ceramics are being used for their unique properties.
This increase in the use of ceramics has been realised through the refinements in processing technology that have allowed a controlled synthesis with consistent reproduction of microstructure and properties. An excellent introduction to ceramics can be found in Kingery, Bowen and Uhlmann (1). There are now specialist areas developing, and broadly ceramics may be divided into 5 classes; traditional, electronic, magnetic, optical and engineering. This thesis is concerned with the engineering applications of ceramics, a broad review of which is given in Richerson (2), with the current status reviewed by French (3).
The reason that there is a considerable interest in ceramics for engineering applications is that they can offer, in comparison to more conventional metallic systems, the following properties
i ). High specific strength. ii ). High specific stiffness.
iii ). Higher temperature capability ( refractoriness ). iv ). Lower thermal expansions.
v ). Lower density.
vi ). Greater resistance to chemical attack ( higher durability ). vii ). Improved hardness.
viii). Improved wear resistance. ix ). Lower thermal conductivity.
Because of these properties, engineering ceramics have already found
uses as high speed machining parts, wire drawing dies and application in energy conversion systems. The driving force for use in energy conversion is the ability to operate at a higher temperature which allows higher thermal efficiency and less forced ( parasitic ) cooling of engine parts. One of the ultimate goals, and part of the driving force behind this research, is to evaluate the suitability of ceramics for use in the advanced gas turbine environment, where the payoffs would be substantial, but the service conditions severe.
1.2. Current Gas Turbine Materials and Structural Composites.
The gas turbine environment presents interesting challenges to the materials scientist. Components within the gas stream are subjected to a variety of conditions which can include high temperatures, high mechanical loadings and large thermal shocks. A simplified diagram of a gas turbine is shown in Fig 1.1. The principle of operation is as follows; air is compressed on the inlet side of the engine before being mixed with fuel. This mix is then ignited and allowed to expand through a turbine that is connected to the compressor at the front of the engine. For aircraft propulsion this exhaust can be used to propel the aircraft or. by the addition of an extra turbine, the engine can be used in electrical power generation and marine propulsion.
Since the introduction of the gas turbine over 50 years ago, the increase in performance of the engine has been considerable, as summarised in Table 1.1.. along with the future requirements for the engine (4) (5). Increases in performance have been achieved both by improved aerothennal design and by enhanced materials performance. The Ni-based superalloys currently employed in the hot areas of the gas turbine engine operate at a higher proportion of their melting temperature than any other alloy system (6) ( up to 80% Tm (7) ). However, these alloys are nearing the end of their development, the composition ( including trace elements ), heat treatments for fabricated parts and the manufacturing processes ( both directionally solidified and single crystal) have all been refined (6).
High Bypass Ratio Gas Turbine Engine.
Fan.
<
. . . . NGV's.
Rotative Aerofoils. Shroud Rings.
Exhaust.
Compressor Stages. Turbine Stages. Ram e Holder.
Figure 1.1. Schematic diagram of the Gas Turbine Engine, showing the possible areas for the implementation of ceramic components.
Development of the Gas Turbine Engiitie in the Aero Market. Year.
1940. 1987 2000+.
Thrust / Weight Ratio. 3:1 10:1 20:1
Compression Ratio. 4:1 30:1 40:1
Turbine Entry Temperature (TET). 800°C 1400°C 2000°C Future Military Engine Requirements.
. Fuel bum reduced by 25%. . Cost reduced by 25%.
. Maintenance cost reduced by 25%. . Life to 5000 cycles.
This is to be achieved 50% by design and 50% by improved materials.
[image:20.607.24.573.1.705.2]since the scope for improving the aerodynamic efficiency of the engine is limited, other ways to improve the efficiency need to be found. One of the ways in which significant gains can be made is to increase both the operating temperature and the pressure of the engine, as shown in Fig 1.2. (4). Full potential in thermal efficiency is only realised with high pressure ratios and turbine entry temperatures ( TETs ) >1800K. Currently superalloys have a temperature limit ~1050°C and require a considerable amount of forced air ( parasitic ) cooling at up to 20% to operate in the current conditions (4) (8). As a 1% drop in cooling air is equal to a 1% increase in power, large gains can be made if cooling can be reduced whilst thermal efficiency is increased (4). Further to this, considerable weight savings can be found since the density of ceramic components would be approximately one third ( 0.30x-0.38x ) that of the equivalent metallic superalloy component for direct replacement, with reductions in the weight of the discs these components are attached to also.
However, the materials that are suitable candidates for replacement of the currently used Ni-based superalloys must exhibit improved specific strength and stiffness, an increased temperature capability and predictable behaviour with economic cost levels (4). Ceramic materials can meet the these requirements, but also need to possess overstrain tolerance, thermal shock and impact resistance.
[image:21.602.60.519.14.670.2]The potential areas for application of ceramics within the gas turbine are indicated on Fig 1.1., and are rotative and static aerofoils, shroud rings, reheat, exhaust and combustor components. These components depending on application need to possess high mechanical strength, tolerate transient overstress, have good creep, fatigue and erosion / corrosion resistance and be able to withstand thermal shock, impact, high frequency vibration and fretting / abrasion.
As can be realised from the above list there are many potential application areas for ceramics within the gas turbine engine both in structural and non- structural areas. Primarily, within this study, the structural requirements are of most interest. Ceramics offer a number of advantages over their metal alloy counterparts, not only in materials performance areas, but also in the abundance of raw materials and in some cases their non-strategic compositions. The typical in-service stress values for components are in the range 100-3()0MPa, which is readily achieved by monolithic ceramics as shown in Section 1.3. (4). A small amount of work has been carried out on the integration o f ceramics into gas turbines with limited success (8). However, ceramics can suffer from brittle fracture behaviour, which means that direct replacement of metal alloys can be difficult in high integrity parts. This is where the development of structural ceramic matrix composites may allow the wider introduction of ceramics into the gas turbine environment.
1.3. Monolithic Ceramics.
Monolithic ceramics can possess outstanding mechanical and other properties, but suffer from one significant problem in that they fail in a brittle and hence catastrophic manner. This is because dislocation motion does not occur, or occurs to such a limited extent that the crack tip remains atomically sharp ( at higher temperatures, the diffusion of point defects can be important and it is possible for both rock salt and fluorite structures to deform plastically when carefully prepared ) (2).
The theoretical strength of a solid can be calculated from the tensile stress required to break the atomic bonds within the material and form new fracture
surfaces
(2):-where E = Young's Modulus of the material ( E= (o /£ )). Y = Fracture Surface Energy.
a()= Interatomic Spacing.
Near theoretical strength materials can be produced, such as 'E' glass fibres or even bulk glass, however most ceramic materials do not possess strengths near that of their theoretical limit ( usually, the experimentally determined strength is ~0.001x-0.002x E ) (9). The reason for this is the presence of flaws within the material which act as stress concentrators. Flaws may be introduced into ceramics during processing ( intrinsic ), or during the service life of the ceramic. Intrinsic flaws can arise from porosity, foreign or impurity particles, inclusions, agglomerates, and large grains. During service, flaws can be introduced by machining damage, impurity ingress, and the growth of voids at grain boundaries due to stress. Improved processing has led to a reduction in the flaw population, but removal of flaws is impossible.
The first evaluation of a theoretical relationship between the actual strength of ceramics and the flaws contained within them was carried out by Inglis (10) and Griffith (11) in the early 1900s. The Inglis approach was to use the stress distribution around an elliptical hole ( when the ellipse is infinitely narrow, this can be a crack ) to give
= 2a
(1.2).
where o m = Stress at the crack tip. O = Applied stress.
2c = Length of the major axis of the crack. p = Crack tip radius.
(1.3).
cti a/\|(t?)
where o f = Fracture stress. c = Flaw size.
A = Constant dependant on the specimen and flaw geometries.
Both Inglis and Griffith found that o f a ( 1/c ) Vl by different approaches,
and these early studies have now been extended through the developments of the 1950s into the area of Linear Elastic Fracture Mechanics ( LEFM ). Here the stress intensity at the crack tip, and the crack surface displacement are used. The stress intensities at the crack tip are denoted by K(, Kn and Kln, depending on the direction of load application as shown in Fig 1.3. For ceramics, the intensity factor is usually written in the form of KIC, the critical stress intensity required for the crack to propagate and hence cause material failure. This property of the material is also known as the fracture toughness for the ceramic and can be related to the previously used parameters assuming perfectly brittle conditions by (2)
KIC = (2yE)*
= o.,Y c'/j (1.4).
Toughness is an important material parameter, since it gives a measure of the material's resistance to damage and hence the material's reliability (12). The
Tensile Mode.
Shear Modes.
Mode III.
K III Figure 1.3. Stress intensity factor notation for the different loading configurations. [image:24.607.23.581.13.715.2]resistance to fracture can also be characterised by the work of fracture ( WOF ). This considers the fracture process from an energetic viewpoint and, in this case, fracture only becomes possible if the release of elastic energy per unit area of crack advance ( Gc ) equals the work of fracture. It can be found that, for a homogeneous material
intensity to the various parameters and, in particular, the flaw size within the ceramic. The strength of a ceramic not only varies because of inaccuracies in the test method, but because of actual variations in the material's strength. Strength depends on test methodology and the volume of material under stress. This information, coupled with the existence of a flaw size distribution in the ceramic, means that failure can occur over a wide range of applied stress.
can be used. The most straight forward is the empirical or trial and error approach. Alternatively the deterministic approach may be employed, where analysis ( i.e. Finite Element Methods ( FEM )) is used but no account of the variation of the stress with volume, or area, or the flaw distribution is made.
level is required. Hence, much design work is carried out using the probabilistic approach, where the flaw size and stress distribution within the component are taken into account. The Weibull distribution proposed by a Swedish engineer of the same name has been found to be applicable in many cases. However, some specific cases require other statistical distributions. The Weibull function in its simplest form is based on the 'weakest-link' theory, where the volume of material under stress will fail at the most severe flaw. The probability of failure can be expressed as a function of the applied stress and the volume and area under this stress. Weibull proposed that, for ceramics, the function has the following form
(1.5). The above discussion has related the material failure stress or the stress
Thus, for the design of a ceramic component, a number of approaches
For a ceramic component, the probability of failure at a particular stress
where O = Applied stress.
o u = Threshold stress ( the stress below which the probability of failure is zero ).
o„ = Normalising parameter.
m = Weibull modulus, which gives an indication of the scatter in the data and hence the flaw size distribution.
The Weibull function with the stressed volume taken into account can now be written
:-(1.7).
For practical application of this theory, it is usual to plot lnln [ 1/ ( 1 - F )] vs lno to give a straight line whose gradient gives m. For ceramics, the above 3- parameter Weibull function is not used, as ou, the threshold stress, is set to zero. It is important to point out that the test configuration used alters the volume under consideration. For instance, uniaxial tension puts the whole volume under investigation, with a decrease in volume stressed for 4-point bending and a further decrease for 3- point bending.
For actual component design, the stress distribution within the component needs to be taken into account, as the above analysis only gives the failure probability for an applied stress. The analysis does however allow for trade off between high strengths and low scatters, but suffers from problems in defining the peak stresses, stress distributions and the strength-flaw size distribution. For an actual component the stress distribution is complicated by thermal and mechanical loadings and, unlike metals, ceramics do not redistribute stress via ductility. It is difficult to identify accurately the strength-flaw size distribution since there can be a large scatter in the results, requiring large numbers of specimens to be tested, and care must be taken to ensure that the strength-flaw distribution is unimodal for the above analysis and not multimodal.
Finally, LEFM is a design approach that uses probabilistic design considerations but does account for fast and slow fracture data which may affect the
component life. Given that currently, for monolithic ceramics, m ranges typically from 5-20, failure probabilities are too high for gas turbine applications except for the case of very small components which operate at low stresses (4) (9).
1.3.1. Examples of Monolithic Ceramics for Engineering Applications.
Although, from the above data, it may seem that monolithic ceramics cannot satisfy the requirements for use in applications such as the advanced gas turbine, monolithic ceramics still have many useful stiuctuial piupeities. Woik on composite ceramics using carbon fibres began in the late 1960s and the properties achieved were very good (13). However, in the early and mid 1970s considerable promise was being shown by monolithic ceramics and in particular SiC, Si1N4 (14) and the SiAlON systems (15) - (18). Refinements in processing led to improved properties that, at the time, were believed to be suitable for application in heat engines if the Weibull modulus could be improved sufficiently. In combination with this improvement in the properties of monolithic ceramics, the development of composite ceramics was hindered by the lack of availability of thermally stable and low cost reinforcements. Hence monolithic ceramics received considerable research . and development expenditure; the properties of some engineering monolithics are given in Table 1.2.
As can be seen from Table 1.2., the toughness of monolithic ceramics can be high, and this is one of the reasons that their use has increased. The toughness of a monolithic ceramic can be increased by several mechanisms, with detailed reviews found in Mah et al (28), with more mathematical approaches in Evans (29) and Weiderhom (30). Toughening of monolithics occurs by modification of the microstructure so that stresses near the crack tip are reduced, and can be summarised as below
Material. Flexural Strength ( MPa ). Klc ( MPam^ ). Comments & Reference
Glass 0.7 (2).
Si3N4 700- 1000 6 - 7 (19).
SiC 400 - 700 3 - 5 (19).
a i2o3 300 - 450 2 - 3 (19).
Z r02 700- 1200 8 - 15 (19).
AIN 466 La20 3 added (20).
3A120 3 - 2SiO z 400 4.5 (2).
Sialon - 0 935 3.6 no a (21).
Sialon - 30 717 4.3 30% a (21).
Sialon - 60 702 5.0 60% a (21).
Sialon - 100 552 4.9 100% a (21).
RBSN 2.5 Polycrystalline (2).
Si3N4 1020 7.4 6Y20 3 - 4MgO
- 0.5ZrO2 (2).
Si3N4 900 10 - 14 Hot pressed Y20 3
- MgO - Z r02 (2).
Si3N4 - Z r0 2 950 8.5 (2).
Al20 3 - 7.r02 1200 15 (2).
Mullite - Z r 0 2 250± 10 4.2 (22).
Mg - PSZ 9 - 12 (2).
Ce - TZP 10 - 16 (2).
Y - TZP 700 6.4 (2).
Y - TZP 1134±28 6.04 (23).
Y - TZP 1530 15.6 (24).
ZTA 1590 14.4 (24).
SiC /TiC 6 25Vol% (25).
SiC /T iC ~ 500 (26).
SiC / MoSi2 310 8 (16).
SiC - Z r02 5.9 (2).
Al20 3/T iB 2 -3 0 0 40Vol%(26).
Al20 3/T iC 800 20Vol%(26).
Al20 3/T iC 4.2 - 4.5 (2).
A120 3 / Y AG 373 4 (16).
Al20 3/ T i N / A l N 229 10.2 40/30/30(27).
Table 1.2. Mechanical property data for some monolithic engineering ceramics. a tilting component, with the twisting component giving the largest contribution. The mechanism depends on the density of the deflecting particles and their shape. Rod-like particles or grains can enhance the K[c value by up to 4x, then lower for disc shaped particles, followed by spherical particles (31).
ii ). Microcracking. The ceramic microstructure may possess areas with large residual stress concentrations which are susceptible to microcracking. These areas may arise
from thermoelastic mismatch or from a second phase. The effect is size dependent, with a critical size of particle being required for microcracking to occur within a limited zone of stress concentration near a large crack tip. Two crack tip shielding processes occur, firstly the local elastic modulus of the material is reduced and secondly there is a dilation induced by the microcracking. Dilation provides the largest toughening component, displaying an R-curve type behaviour, with enhancements in KIC up to 2x. iii ). Crack Pinning. The crack can be pinned by the microstructure or by added second phases. The pinning retards the motion of the crack, the main part bowing around the pinned sections. Two theories have been developed to explain the toughening mechanisms, the first by Lange and the second by Evans (29). For particulate composites K|C can be enhanced by 2x-6x (29).
iv ). Crack Bridging. Experiments carried out with large-grain alumina showed that events could occur at large distances from the crack tip, which can have a substantial effect on the toughness (28). The toughening effect depends on the mechanical interlocking of grains protruding from rough surfaces causing closure forces on the crack surfaces. It has been found that glass ceramics can exhibit crack bridging as can whisker toughened ceramics.
exhibit lower strengths ( o ~ 600MPa ).
Other effects may also contribute to enhanced toughness in monolithic ceramics, such as residual stresses, however, it is probable that more than one toughening mechanism will operate. It has been demonstrated that a doubling of K]c is possible in Si3N4 by use of an elongated, fibrous-grain structure (28). This grain structure can be formed by a high volume fraction of liquid phase present at the sintering temperature and hence mechanical properties at higher temperatures are degraded by the presence of residual glass at the grain boundaries ( maximum use temperature ~ 1200°C ) (2) (7) (32). Elongated grains are produced during liquid phase sintering via a solution-precipitation mechanism, giving a matrix of predominantly 3- Si3N4 from an initial powder mixture of mainly a-S i3N4 crystals (33) (34). For a material with an average grain size <lpm, a toughness of lO.SMPam^ has been achieved.
However, the largest enhancements of fracture toughness occur in transformation toughened ceramics. These materials have received significant attention because of their damage-tolerance potential; an introduction to this field is given by Stevens (35). Unfortunately, for high temperature applications, the use of Z r0 2 toughened ceramics is limited as the transformation temperature is approached. Other monolithic ceramics, although possessing good room temperature properties, as in the case of Z r0 2 toughened ceramics, can possess much degraded higher temperature properties. This is usually because the additions of sintering aids in the ceramic ( Si3N4 uses MgO. CaO and Y20 3, and SiC uses B, C or A120 3 ) can leave a glassy residual grain boundary phase which will cause a deterioration in the high temperature mechanical behaviour both in the short and long term. Studies have been carried out to try to eliminate these residual glassy phases with some success (7).
1.4. Composite Ceramics.
If composite ceramics were taken to be ceramics with more than one phase, then most high performance engineering ceramics would be classified as composites. However, we can distinguish between multiphase ceramics and composites, since, in the case of a composite, a second phase reinforcement such as particulates, platelets, whiskers or fibres is added. Since there is a second phase addition, a number of factors must to be taken into consideration
:-. Chemical compatibility between the reinforcement and the matrix:-.
. The thermal expansion mismatch between the reinforcement and the matrix. . The interface formed between the reinforcement and the matrix.
. Refractoriness of the system.
. Fabrication route and degradation of the reinforcement during processing. A number of different types of composite can be fabricated when using a ceramic matrix, which include ductile particle or fibre, ceramic platelet, whisker, short and long fibre reinforced composites. As this research project is concerned with the high temperature application of composites within the gas turbine environment, this review will be concerned only with ceramic reinforcements within ceramic matrices. A number of review articles concerned with ceramic matrix composites are available and can be found in references (36) - (39). More detailed reviews of ceramic fibre reinforced composites can be found in Sectionsl.5 and 2.2.
Material. Flexural Strength ( MPa ). I V ( M Pam *). Reference.
Si3N4 / SiCw 454 15.6 HP (37).
Si3N4 /S iC w 900 RB (37).
Si3N4 / SiCw 620±50 7.8±0.3 HPRBSN(42).
Si3N4 / SiCw 850±42 7.7±0.3 HPSN (42).
AI2O3 / SiCw 800 8.7 HP (37).
AI2O3 / SiCw 6 - 9 (2).
AI2O3 / SiCw 650 - 800 00 1 SO 22°C (39).
AI2O3 / SiCw 575 - 775 8 1000°C (39).
AI2O3 / SiCw 475 - 550 10 1200°C (39).
A120 3 / Glass / SiCw 463±58 3.3±0.5 15Vol%(41). A19Ot / Glass / Si9N4u/ 296±43 3.4±0.3 20Vol%(41).
Zircon / SiCw 342 (43).
Sodalime glass / SiCw 0.7 20Vol%(38).
Aluminosilicate / SiCw 0.8 20Vol%(38).
Mullite / SiCw 2.0 20Vol%(38).
Mullite / AI20 3w ~ 180 (44).
HfB2 / SiCp 380 (44).
HfB2 = SiC / SiCp 1000 ~ 8 (44).
ZrC ( Zr ) / ZrB2 pl 1800- 1900 18 (44).
Table 1.3. Mechanical property data for some whisker and platelet reinforced ceramic matrix composites.
VLS whiskers contain a small amount of 0(-SiC and can have properties attaining a strength of 15.9GPa, a Young's Modulus of 580GPa and a toughness of 3.2MPam^ (45). Many of the toughening mechanisms associated with whiskers and platelets have been dealt with in Section 1.3., with crack deflection being of great importance as well as crack-tip shielding, whisker bridging and whisker pullout. The interface between the reinforcement and the matrix plays a role in the determination of the mechanical behaviour of the composite, since, for bridging to occur, there needs to be load transfer from the matrix to the reinforcement (36). It is important to note that the toughness of the composite depends not only on the volume fraction of the dispersed particles, but also their shape. Finally, the effects of pullout of whiskers can be analysed as though the whiskers are short fibres. Detailed reviews of the whisker toughening process and analysis of these processes can be found in Becher et al (41), Becher (25), Lui et al (46) and Faber and Evans (31).
From Table 1.3., it can be seen that a considerable amount of research effort has been expended on the development of Al20 3 / SiCw composites with K|C
doubled and a 50% increase in strength retained to 1000°C for a 30vol% whisker content (46) (47). Also from Table 1.3., Si3N4 has been used both as a reinforcement and a matrix. Whiskers of Si3N4 have been produced by Los Alomos and Ube Industries Ltd (2), but when incorporated into a Si3N4 matrix have had only limited success, with improvements being similar to those achieved by a Si3N4 self-toughened microstructure. For the cases of Si3N4 matrices reinforced with SiCw, both crack deflection and whisker pullout contribute to enhanced toughness, but some effect of elongated 3-Si3N4 grains may have also enhanced toughness (48).
1.5. Fibre Reinforced Ceramics.
Although development work on ceramic fibre reinforced ceramic matrix composites began in the late 1960s, there has been a resurgence in research into these materials over the last decade (13). Monolithic ceramics have yet been unable to meet the toughness requirements for application in high stress, high integrity environments such as the gas turbine, whereas continuous Fibre reinforced ceramic matrix composites ( CMCs ) may fulfil these requirements. During the 1970s, more refractory reinforcements became available in the form of whiskers and also the invention by Yajima et al (49), of a polycarbosilane resin that can be spun and then pyrolysed to produce a high strength silicon-oxy-carbide fibre ( marketed under the name Nicalon ). Properties of CMCs are non-isotropic, but they can exhibit extremely high strengths in the fibre direction and show non-brittle failure. Because of this non-catastrophic failure mode under loading, a considerable amount of research effort has been expended on the development of CMCs. The possibility of tolerating transient overstress, without the failure of a component, in a high integrity environment with the benefits offered by ceramic materials ( see Sections 1. and 1.1.) clearly is a large benefit.
Stress.
Figure 1.4. Idealised mechanical behaviour o f a fibre reinforced composite.
Ec = EfVf + EmVm (1.8).
where, Ec , Ef, Em = The composite, fibre and matrix elastic moduli.
Vf, Vm = Are the fibre and matrix volume fractions ( Vm = 1 - Vf ).
However, the composite material does not fail at i.ts elastic limit as a monolithic material. As the stress is increased beyond the elastic limit ( o mm and £mm in Fig 1.4. ), there is a reduction in the composite elastic modulus, and the stress / strain curve becomes non-linear ( region II in Fig 1.4. ) and, in this region, the composite matrix forms a series of microcracks perpendicular to the fibre direction. The microcracks originate from pre-existing flaws within the matrix, but are bridged by intact fibres. As further stress is applied, the stress builds in the matrix via load transfer by the fibre / matrix interface away from the existing microcracks until it reaches a value where another matrix microcrack can form from a pre-existing flaw within the matrix. By this process a series of microcracks are introduced into the composite that eventually reach a saturation spacing when the microcrack stress fields overlap. Although the matrix blocks are bridged by intact fibres, some of the fibres will break at weakest sites away from the microcrack planes. Further stress transfer via the interface
[image:34.606.31.536.9.681.2]to the fibres causes fibre bundle failure, indicated in Fig 1.4. by o ULT, eu l t . This *s the maximum load that can be sustained by the composite. However, failure after this point is still not catastrophic, as the broken fibres within the matrix blocks carry load and dissipate energy via frictional means as they pull out of the matrix.
The interface between the fibre and the matrix is critical to mechanical properties in CMCs. It must allow load transfer to occur from the weaker matrix to the high modulus fibres for the beneficial mechanical response indicated. However, the interface must not strongly bond the two components together, since then there would be no load transfer and the composite would fail in a brittle manner as a monolithic with no toughening effect.
It should be pointed out that for these composite materials, o mm and o ULT are independent of the flaw size distribution and hence the component size, unlike the case for monolithic ceramics. The fracture toughness, KIC, is no longer a valid parameter and, for these materials, more typical design parameters would be o mm, Ou l t , and WOF (12). For the evaluation of these properties care has to be taken with the test methodology used, o mm can be measured in tension and flexure, but o ULT only in tension (12) (50). For design purposes, the matrix microcracking stress, O ^ , is probably the parameter for use, as, once this stress has been reached within the component, the environment has direct access to the fibre / matrix interface and hence can degrade the material property appreciably.
1.6. Glass Ceramics.
Glass ceramics are ceramic materials that are formed by the controlled crystallisation of glasses. The final material properties are a combination of those of the crystalline phases present in the glass ceramic and those of the small amount of the residual glassy phase. Because the final material is a ceramic it can possess all of the desirable properties shown in Section 1.1., and can be formed via standard glass preparation procedures. A considerable amount of research work has been conducted on glass ceramics and reviews of these and other aspects of glass ceramics can be found in McMillan (51) and Stmad (52). Following glass preparation by conventional means, carefully controlled heat treatments are used to produce fully dense polycrystalline multiphase ceramics. The devitrification of the glass and the formation of a fine grained microstructure can be aided by the addition of a nucleating agent to the glass composition ( i.e. T i0 2, Z r0 2, P2Os, Cr20 3, Ag, Au etc ).
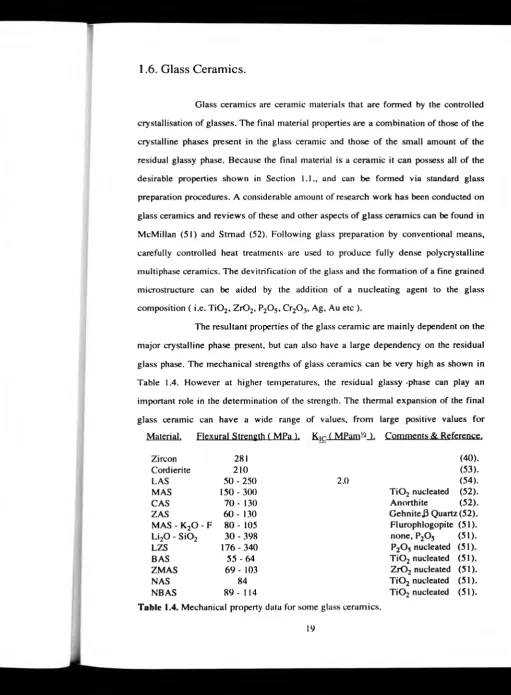
The resultant properties of the glass ceramic are mainly dependent on the major crystalline phase present, but can also have a large dependency on the residual glass phase. The mechanical strengths of glass ceramics can be very high as shown in Table 1.4. However at higher temperatures, the residual glassy -phase can play an important role in the determination of the strength. The thermal expansion of the final glass ceramic can have a wide range of values, from large positive values for Material, Flexural Strength ( MPa ). Kic (, MPam^ J , Comments.& Reference.
Zircon 281 (40).
Cordierite 210 (53).
LAS 50 - 250 2.0 (54).
MAS 150 - 300 T i0 2 nucleated (52).
CAS 70 - 130 Anorthite (52).
ZAS 6 0 - 130 GehniteJ3 Quartz (52).
MAS - K20 - F 80 - 105 Flurophlogopite (51).
Li20 - S i0 2 30 - 398 none, P2Os (51).
LZS 176-340 P20 , nucleated (51).
BAS 55 - 64 TiOz nucleated (51).
ZMAS 6 9 - 103 ZrOz nucleated (51).
NAS 84 T i0 2 nucleated (51).
NBAS 8 9 -1 1 4 T i0 2 nucleated (51).
Table 1.4. Mechanical property data for some glass ceramics.
[image:36.603.22.534.11.707.2]Crystalline Phase. Thermal Expansion Coefficient a ( x ICtë ).
ß - Eucryptite ( LAS 1:1:2 ) - 6 .4 ( 2 0 - 1000°C ).
A120 3 - T i02 - 1.9 ( 20- 1000°C).
ß - Spodumene (LA S 1:1:4) 0.9 ( 20- 1000°C). Cordierite (MAS 2:2:5 ) 2.6 ( 25 - 700°C ). Celsian (B A S 1:1:2) 2.7 ( 20 - 100°C ). Willemite (Z S 2:1 ) 3.2 ( 20 - 1000°C ). Anorthite (C A S 1:1:2) 4.5 ( 20 - 100°C ). ZrOz : A120 3 ( ZA 1:1 ) 7.2 ( 20- 1300°C). Clinoenstatite ( MS 1:1 ) 7.8 ( 100 - 200°C). Magnesium
Titanate
( MT 1:1 ) 7.9 ( 25 - 1000°C ). Corundum ( a - A120 3 ) 8.7 ( 25 - 900°C ). Wollastonite ( CS 1:1 ) 9.4 ( 100 - 200°C ). Fosterite ( MS 2:1 ) 9.4 ( 100 - 200°C ). Lithium
Disilicate
(L S 1:2) 11.0 ( 20 - 600°C ). Quartz ( S i0 2 ) 23.7 ( 20 - 600°C). Cristobalite ( S i0 2 ) 27.1 ( 20 - 600°C ). Tridymite ( S i0 2 ) 14.4 ( 20 - 600°C ).
Table 1.5. Thermal expansion data for some commonly used crystalline phases in glass ceramics ( All data taken from (51) and (52)).
cristobalite to large negative values for 3-eucryptite. In general, the crystalline phases can be selected to give low thermal expansion values as shown in Table 1.5., and hence glass ceramics have very good thermal shock properties. The refractoriness of the final glass ceramic can be made very good by selecting refractory crystalline phases. However, problems can be caused by the presence of a residual glassy phase which melts at a lower temperature. Chemical durability is another property which can be very good and can be affected by the presence of a minor residual glassy phase. The heat treatment used during the fabrication of the glass ceramic can not only influence the phases present in the final ceramic, including the residual glass content, but can also affect the volume fractions of these phases, and hence it is possible to affect the thermal expansion coefficient of the glass ceramic during processing.
reactions and degradation.
Within this chapter the necessity for improved materials performance in the gas turbine engine has been described, as has the behaviour of monolithic and composite ceramics. The objective of this research has been to develop a novel compositional selection principle and to fabricate and evaluate the composites produced using this principle. The approach used has been to select a glass ceramic ternary system and, by movement away from stoichiometry, produce a diphasic matrix with the possibility of tailoring matrix thermal expansion coefficient and enable the use of lower processing temperatures. In order to fabricate composites the development of a method for pre-impregnation of the fibre tow and subsequent tow winding was required as well as hot press consolidation schedules. Composite evaluation has attempted to encompass mechanical property measurement in the as-fabricated, thermally aged and crept conditions to test the applicability of this class of materials to the gas turbine environment.
Chapter 2. Continuous Fibre Reinforced Ceramic Matrix
Composites.
This chapter reviews, in more detail, long fibre reinforced CMCs. Aspects o f composite modelling are covered initially, starting with the work carried out by Aveston, Cooper and Kelly ( A.C.K. ) in the early 1970s (55). Their model was based around an energy balance criterion. More modem theories have also used this approach, as well as the matrix cracking strain criterion, with incorporation of Weibull statistics into the fibre failure process within the composite.
Following this review of composite modelling a review is presented of currently available fibre and matrix systems and their fabrication routes, before a more detailed review of the glass ceramic composite field. Section 2.4. details the selection criteria for the fibre and matrix used in this study, and Section 2.5., states the objectives of this research program.
2.1. Composite Theory.
2.1.1. Introduction, Matrix Microcracking and Residual Stress.
Composite modelling for CMC systems began with the application of the currently available theories based on polymer composite systems. This allowed prediction of the longitudinal composite modulus using equation 1.8. For CMC systems, models are required that predict the onset of microcracking ( Omm ), the composite ultimate strength ( ouh ), and the contributions to the work of fracture from the fibre matrix debonding and the fibre pullout from the matrix.
incorporation of Weibull effects in the fibre failure process. The assumptions made within the models as well as the material parameters used can have a large effect on the predicted results as discussed by Yang and Knowles (56) and Cao et al (57).
For the A.C.K. model both the fibre failure and the matrix cracking stress are defined by unique stress levels. However, within the analysis the theory does account for the work done in applying the stress to the CMC, the work to fracture the matrix, the work for debonding the fibre from the matrix, the work done due to frictional sliding, the decrease in the strain energy of the matrix, and the increase in the strain energy of the fibres. For high strength fibres in a lower strength matrix the condition for multiple matrix cracking to occur is
°fi|V r > o muVm + OfVf (2.1). where o fu = The fibre ultimate stress.
Or' = The stress in the fibre required to exceed the strain to failure of the matrix.
o mu = The matrix ultimate strength.
If this condition is not true, then O is greater than Ofu and so brittle failure occurs. As stated in Chapter 1., microcracking occurs in composites by load transfer from the matrix to the fibres via the fibre / matrix interface. The A.C.K. theory allows calculation of the crack spacing by a force balance approach at the interface, the analysis indicating that the crack spacing is dependent on the fibre radius and inversely dependent on both the fibre volume fraction and shear sliding stress of the interface.
More sophisticated models using the LEFM approach have been proposed (58) (59) (62) (63) (68) (69). However, care must be taken when using these models as assumptions are contained in them to simplify the analysis. The fibre / matrix interface is critical to the material response, and crack deflection at the interface has been analysed in detail by He and Hutchinson (70). The interfacial debond energy needs to be low for crack deflection and many models assume that it is small enough to be neglected. Models also assume that the shear sliding stress at the interface can be regarded as a constant. However, the steady state matrix microcracking stress can be
evaluated for a unidirectional composite
(63):-O,mm (2.2) .
6 T r mV ^ EfE 2'
( 1 - V f )E^r
_ l/ 3
where
O
q = The axial residual stress in the matrix ( positive q is tension ).
t = The interfacial shear sliding stress.
Tm = The matrix fracture energy, r = The fibre radius.
At the matrix crack, for all applied stress o, the matrix carries none of the applied load and hence the bridging fibres carry the entire load. By assuming that no fibres are broken and that global load sharing applies, the approximate stress in each fibre can be evaluated (65)
Since the fibre matrix interface facilitates load transfer from the fibre to the matrix, in a linear manner, the stress in the matrix can build to the precracked value ( o m = oEm / Ec ) by this mechanism. This transfer length can be evaluated by use of a force balance equation
:-Hence for distances ±ls from the matrix crack, another matrix crack may be formed. By this mechanism multiple matrix cracking may occur as the stress applied to the composite is increased, as indicated in Fig 2.1. Note that saturation of cracks occurs when the slip lengths of the neighbouring cracks overlap, this is at approximately 21s, with the average crack spacing 1.3371s (65). Also from equation 2.3., it can be seen that there is a critical value for V,- when the equality in equation 2.1. is used. For a value of Vr there is a change over from a brittle type of fracture to a 'tough' multiple fracture mode as shown in Fig 2.2.
O ~ 1 o
appf V f aPP (2.3).
Stress applied.
5. 7. 6. 8. 1. 3. 2. 4. Location of weakest site.
Figure 2.1. Evolution of matrix cracks in a CMC system. As the applied stress increases, failure occurs at the defect sites.
By referring to equation 2.2., it can be seen that o mm is proportional to t, and so to increase the design stress omm the interfacial sliding resistance can be increased. However, there is a point at which the composite will behave in a brittle manner for a value of T. Studies have indicated that for composite behaviour to be realised three criteria need to be satisfied (57) (61) (62). These conditions indicate that for fibres to fail at a substantial distance from the matrix crack- plane then 2 <= T
Volume fraction of fibres ( Vf).
Figure 2.2. The ACK model schematically depicting the transition from single to multiple matrix fracture dependence on fibre volume fraction.
<=40MPa, for debonding at the fibre / matrix interface to occur r f / r f < ‘A and that to
avoid thermal cracking of the matrix the thermal mismatch Ether ~< 3 x 10'3. If these
conditions are met then the mechanical properties of the composite can be improved with higher fibre strengths Of, higher matrix fracture energies r m, and higher volume fraction of fibres Vf.
From equation 2.2., it can be realised that residual strain can influence the composite behaviour. This issue has been dealt with in a number of models in addition to the ACK approach. Residual stresses usually arise since fabrication occurs at elevated temperatures. The situation is complicated by plasticity of the matrix, creep effects and the possibility of phase transformations. These effects produce an initial matrix stress as well as an interfacial pressure, and it can be noted that generally a positive interfacial pressure ( tension ) is associated with a positive initial matrix stress. If the strain mismatch is caused by thermal effects only, then
^ £r ' £m
û = ( « r - «m ) AT (2.5). where £f = The fibre strain.
£m = The matrix strain.
c*f = The fibre linear thermal expansion coefficient o'ver AT. c*m = The matrix linear thermal expansion coefficient over AT. AT = The temperature difference between the residual stress
measurement temperature and the glass transition temperature, Tg. Authors (57) (63) (64) have shown that the residual stresses can affect T, and through this affect o mm. If the strain is due to thermal effects only then calculations can give the stress
X ,E mE fV ,n
( 2 . 6 ) .
X2EmE fV(n
q X E( 1 - V )
where v = the Poisson's ration o f the matrix. > _ , ( 1 - 2v ) / i E \
- 1
H1 - v ) I, 1
K {)This is illustrated by the results of Curtin (65) for a LAS GCMC where compressive radial residual stress increases x. The stress q can be difficult to calculate as AT is difficult to quantify.
2.1.2. Composite Ultimate Strength.
Many modern theories use weakest link statistics for the prediction of fibre failure within the composite (64) (65) - (67) (71). Most of the theories assume that both Tj and T are small and that the fibres are non-interacting with multiple matrix fracture occurring before composite failure. If global load sharing is being applied (65)
(2.7). where oc = the characteristic strength for the fibres ( a characteristic length can
be defined 5C = ( roc / x ). and the mean fibre pull-out length is given by h
:-_ \(m)roc (2.8).
n ¿fx where X(m) is close to unity for m>3 (63).
Other analysis uses the notion of tractions acting on the matrix crack surface by the fibre bridging and pull out (57) (61) (64) (67). Again here weakest link statistics apply, also interactions between surrounding fibres are small therefore the ultimate tensile stress of the composite may be represented by
:-= V(.Sexp [ ■ - < ' ■
s f ]
l UTS( m + 1 )[
' ■ ( ' ■ 3 ) 1
with( rS
l. t3
r - (
Ao \ ( rS„ \
2-nrH / \ xd /
(2.9).
where d = the slip length.
S = the elastic compliance associated with matrix cracks.
A,) = reference area of 1 m2. H = Specimen gauge length. S = Fibre strength.
S0 = scale parameter associated with the stress distribution.
Load carrying does not cease at this point, as successive fibres break and then pullout from the matrix. This efficient way of increasing the WOF has been modelled by a number of authors, the contribution to the WOF from the work of pullout has been modelled by Curtin (65)
, X fin)
w — 1__3__ y o S
p 12^(111) f c c
(2.10).
where X3(m) /X,(m) is the ration of a dimensionless third moment to that of a dimensionless first moment.
This is similar to the Sutcu (71) result except for the prefactor. From Evans and Marshall (61), if T is large, then the linear decrease in fibre stress away from the matrix is steep ( see equation 2.5. ) and hence the volume of fibre under stress is small. This suggests that fibre failure will occur nearer the crack plane and so contributions to the work of fracture ( WOF ) will be small. In comparison to this, for the case of a small T, the length is increased and hence longer pullout lengths are expected, especially with decreasing Weibull shape parameter'm'.
The value of the Weibull shape parameter 'm', also clearly has an influence on ouxs. This dependence was modelled by Curtin and the results schematically indicated in Figure 2.3. (65). Because of this it is important to be able to evaluate the Weibull parameter'm' for fibres within the composite so that T may be optimised (61) (64).
Wcibull Modulus 'in'.
Figure 2.3. Composite ultimate strength dependence on W eibull'm' value. From Curtin (65).
sliding at the interface. Hence, the composite strength scales with the strength of the fibres within the composite, so it is necessary to avoid fibre damage during composite processing. The values found for OUTS experimentally deviate from the theoretical predictions as the fibre can be damaged during fabrication and may fail in the crack wake or the strain localisation caused by a crack plane and hence, from modelling, o UTS is an upper bound (65). Further limitations of models are discussed by Yang and Knowles (56) who show that simplifying assumptions used can lead to predictions near that of the simple 'equal load sharing’ bundle model.
2.1.3. Measurement of the In-situ Materials Properties.
From the above discussion many authors have indicated the necessity to evaluate the material properties in-situ in the composite (65) (72) (73) (63) (67). The parameters that need to be found are T, r m, Tj, Q, S(l, and m. A number of methods exist to evaluate these parameters as summarised below ( for more detail see (72)). The fibre characteristic strength and shape parameter can be determined from the ultimate strength of the composite (65) or by the use of fracture mirror radii on broken fibres