SELF-ADAPTATION TO CONCEPT DRIFT IN
WEB-BASED ANOMALY DETECTION
M
ASTER
T
HESIS
JELTE ORIJ
ABSTRACT
CONTENTS
Abstract ... 1
1. Introduction ... 4
2. Security mechanisms - scope and terminology ... 4
3. Web-based attacks ... 6
3.1 Anatomy of an HTTP request ... 7
3.2 Attacks in the HTTP request line and request body ... 8
4. Web-based NIDS types - further narrowing down the scope ... 9
4.1 Signature based IDS ... 11
4.2 Anomaly based IDS ... 12
4.2.1 Scope within anomaly based IDS ... 13
4.2.2 Creating and updating the model ... 16
4.2.3 State of the art in web-based A-NIDS ... 17
5. Updating the model - the subject of research ... 22
6. Self-adaptation... 24
6.1 Detecting abrupt and gradual changes in observed traffic: threshold-based systems... 25
6.1.1 Systems that detect legitimate changes from observed traffic ... 25
6.1.2 Systems that detect legitimate changes by observing the underlying system ... 31
6.1.3 Retraining for threshold-based systems ... 34
6.2 Naive algorithms: continuous learning based on observed traffic ... 34
6.2.1 Semi-continuous learning from observed traffic: update the model at a certain time interval ... 36
6.3 A combination of continuous and threshold-based learning from observed traffic ... 36
6.3.1 Retraining the cluster-based model ... 38
6.4 General remarks on retraining ... 40
6.4.1 Algorithms suitable for real-time updating... 41
6.4.2 Observing traffic versus observing the underlying system ... 41
6.4.3 Determining the stabilization point after concept-drift ... 41
7. Proposed method ... 42
7.1 Limitations of detecting concept-drift from changes in the underlying system ... 42
7.2 The setup of the self-adapting IDS ... 43
7.2.1 The level of granularity that is used in the model ... 44
7.2.2 The feature extraction method that is used to reduce the dimensionality of the data ... 44
7.2.3 The modeling method ... 45
7.2.4 The methods to detect legitimate change and retrain the model... 47
7.3 Points of attention when it comes to the initial training ... 50
7.4 Summary of the implementation – Scandax ... 51
7.4.1 Main system - Appendix B.1 ... 52
7.4.2 Training monitor - Appendix B.2 ... 53
7.4.3 Trusted client monitor - Appendix B.3 ... 54
7.4.4 Suspicious entity monitor - Appendix B.4.1, B 4.2 ... 54
7.4.6 System variables – Appendix C ... 57
7.4.7 Miscellaneous system details ... 58
7.5 Review and comparison to state-of-the-art systems ... 59
7.5.1 Initial Training and Model creation ... 60
7.5.2 Retraining - Trigger and Process ... 61
7.5.3 Overview of unique properties ... 62
8. Results ... 63
8.1 Preparation of the tests ... 64
8.2 Description of the tests ... 66
8.2.1 Configurations that will be tested ... 66
8.2.2 Test cases ... 66
8.2.3 Determining parameter values for the trusted client mechanism ... 70
8.3 Test results ... 74
8.3.1 Training data set 1... 74
8.3.2 Training data set 2... 75
8.3.3 Training & live data sets – Analysis of IDS output ... 76
8.4 Discussion ... 78
8.4.1 Limitations... 78
8.5 Practical usability ... 79
9. Conclusions and future work ... 83
9.1 Conclusions ... 84
9.2 Future work ... 87
9.2.1 Automatic deduction of system parameter values ... 87
9.2.2 Negative confidence indexes ... 87
9.2.3 Further sanitizing the training data ... 88
9.2.4 Expanding the INTER AND INTRA-PROTOCOL scope ... 88
9.2.5 Efficient training ... 88
References ... 90
Appendix A ... 93
Appendix B ... 94
B.1 Main system ... 94
B.2 Training monitor ... 95
B.3 Trusted client monitor ... 95
B 4.1 Suspicious entity monitor (Part I)... 96
B 4.2 Suspicious entity monitor (Part II)... 97
B.5 Forgetting window monitor ... 98
Appendix C ... 99
Appendix D ... 101
D.1 Training data set 1 ... 101
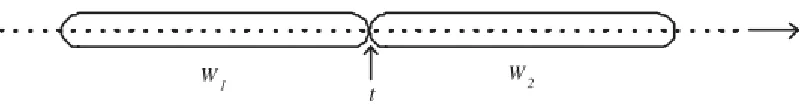
1.
INTRODUCTION
When it comes to web application development and deployment, the security of the application and the infrastructure behind it has become an important factor. Attacks on applications and their infrastructure may cause disruptions in the service, as well as unauthorized disclosure and modification of data. From a business perspective, this may deter users which results in financial losses. There may also be legal consequences when, for example, privacy related data is insufficiently being secured. Therefore, it is important that appropriate security mechanisms are in place in order to prevent these scenarios from occurring. This research will focus on a relatively novel but promising type of system within the body of security
mechanisms, namely an A-NIDS (Anomaly based Network Intrusion Detection Systems). More specifically, we will investigate certain improvements related to such a system as a way to enhance its overall effectiveness. In this report we will first narrow our scope within the broad field of “security mechanisms” in chapter 2. Then we will provide more detail on the possible “attacks” in chapter 3 and in chapter 4 we further narrow down the scope within our chosen “security mechanisms”, discuss how they deal with these attacks and provide an overview of the state of the art techniques that are used in these systems. In chapter 5 the research questions are presented. In order to answer these questions, we will propose and test a custom built self-learning detection system, which we named Scandax. In order to determine the most optimal setup for Scandax we will analyze the available literature on the topic in chapter 6. In chapter 7 we will propose a system based on this analysis, as well as provide an overview of the implementation and in chapter 8 we will put the system to the test. Chapter 9 outlines the conclusions with the answers to the research questions and the report will end with a discussion about the possibilities for future work.
2. SECURITY MECHANISMS - SCOPE AND TERMINOLOGY
In the field of computer security, the level of security that is achieved is often measured as the extent to which confidentiality, integrity, and availability (CIA) are ensured. Confidentiality represents the rate at which unauthorized access of sensitive information is prevented, while integrity stands for the prevention of unwanted modification of data, and availability represents the rate at which systems are guaranteed to be available, i.e. able to perform their full functionality at all times.
Security measures inside the application may consist of secure coding practices and the automatic reporting of anomalies from within a certain application and security in the underlying infrastructure may be that the OS and running services are kept up to date.
When we look at the security of the system as a whole, different types of security systems can be applied. In general, at the highest level a distinction can be made between:
- Physical security; physical controls, such as security cameras, security guards, motion sensors. - Host based security; software installed on a system in order to monitor and alert on the OS and
application activity within that same system and possibly autonomously performs preventive actions. - Network based security; software to identify anomalous behavior based solely on network traffic. A
network based security system can be placed separately from other systems in the IT infrastructure, at least if it is ensured that the packets that reach the system that should be protected will also reach this security system.
A common principle when implementing security is to use different layers. In addition to the fact that it is probably impossible to prevent and/or detect all possible threats using one layer, using multiple layers can also aid in detecting a single kind of threat. For example, a malicious packet may go through two subsequent intrusion detection systems that are both inspecting the packet’s contents and that may both be configured to detect certain types of attacks. One detection system may lack the capability to detect one specific variant of such an attack, while the other in its turn may be able to detect it. Different layers also apply to different types of intrusion detection and prevention systems. Although in this report we will handle one specific type of security system, combining the different types of security systems that we listed before usually aids in the overall security of the infrastructure.
For this research we will focus on network based security systems. Within the types of security systems there are systems of which the purpose is to either detect attacks, prevent attacks or both. In this research we will handle network based security systems for the purpose of detecting attacks. This type of system is usually referred to as a Network based Intrusion Detection System (NIDS).
A general purpose NIDS can be used to detect attacks in a wide range of protocols. For this research we will solely focus on the detection of attacks within the HTTP(S) protocol, i.e. web traffic. More and more businesses are using the web as a way to reach potential customers by serving a public website, or allowing the remote management of core business processes by existing employees, suppliers, and customers with, for example, a web based ERP system. For some businesses, such as web shops, a website is at the core of their business. From the web based systems in these examples it can be inferred that web based applications may deal with highly confidential information which should not become public and/or be altered by
organization. Given these observations we conclude that it is essential for businesses to have proper security mechanisms in place that detect web-related attacks when serving a web-based application.
Because on a network based web-application level the systems for either detection and prevention are somewhat closely related, we will end this chapter by briefly discussing the main difference between network based systems related to detection and network based systems related to prevention, before we move on to the next chapter where an analysis on the possible attacks and the threats that come with those attacks are outlined.
With regard to prevention on a network based level, a commonly used tool is a firewall. We will briefly discuss a certain type of firewall that is used to prevent malicious events on a web application level and which is closely related to a NIDS, which in its turn is used for detection. This type of firewall is commonly referred to as a web application firewall (WAF), which can be used to restrict access based on whether the web server requests comply with the policy of the WAF.
The main difference between a NIDS and a WAF is that a WAF is mostly used for analyzing the 7th OSI layer, which is something most NIDS’s are not able to do and which makes the WAF especially useful for securing web applications [16], [17]. On the other hand, although most NIDS’s operate in higher layers of the OSI model, they are able to analyze many different protocols, while a WAF usually analyzes the HTTP(S) protocol. This makes the NIDS and the WAF supplementary layers of security, but there may be some overlapping functionalities. Both the NIDS and the WAF have in common that they detect anomalies based on a
predefined set of rules. A rule, for example, may contain a request URL that is often used in a certain type of cross-site scripting attack (signature based detection). Another example of a rule is one that specifies that an alert should be created whenever the amount of connections suddenly increases with a certain rate (anomaly based detection). It is important that rules are carefully configured, because they are the main factors in the detection of attacks. When configuring the rules one should take into account the acceptable level of false positives and false negatives that the system generates with these rules. Proper configuration of the system and the rules can aid in lowering the level of false positives, while keeping a fixed level of false negatives. For NIDS’s and WAFs there are both commercial and free open source products available. It may also be the case that the open source system is free but there are pre-configured rule-sets which can be purchased. Most of the times these commercial solutions are able to achieve an improved balance of false positives and negatives, as discussed before, because they have been carefully developed by trained professionals.
3. WEB-BASED ATTACKS
Web based attacks are considered by security experts to be one of the greatest risks related to
on layer 7 of the OSI. In web applications, data is sent from the client and interpreted by the server, which may generate a response to the client. The data that is sent from the client is in the form of HTTP requests.
3.1 Anatomy of an HTTP request
An HTTP request is a collection of text lines (separated by a CRLF) sent to a web server and includes a request
line, request header fields and the body of the request [44]. These are also the parts where the attack payload
will be present in case of an attack, and thus which are interesting from the point of view of intrusion detection.
The request line has three parts, separated by spaces. The first part is designated for the method name which must be applied, the majority of HTTP requests being of the GET method, but others exist, such as POST or HEAD. In or report we limit the analysis to the most common methods, being GET and POST. Following the method, comes the resource path (URI) and an optional query component. The path is a hierarchically structured sequence of string segments that usually represents a file, a directory in the file system, or a combination of both. The “?” character in the URI introduces the query component of a path and parameters are supposed to be in field-value pairs, in which the pairs are separated by an “&” character, and the field and value are separated by an “=” character, but real-world implementations tend to break this convention. This is because expressive path names in URLs are preferred by developers and users, which is done in URL
Rewriting [45]. However, for simplicity we assume in this report that we are dealing with field-value pairs of
parameters. Moving on to the last part of the request line, this final part indicates the version of the protocol used by the client (generally HTTP/1.0 or 1.1). An example of a request line is the following:
GET /path/to/file/view_employee.html?id=10 HTTP/1.1
Following the initial request line in a HTTP request, there are the request header fields, which provide information about the request. They contain data from the client in an unordered field-value structure. For example, headers inform the server which kind of content and encoding is understood by the client. The best example for client data in a header field that is processed by the web application is the so-called cookie. Attacks that have payloads in HTTP request header fields usually target the web server software that is hosting the web application, instead of the application itself. In our research we focus on attacks that target the web application and therefore we ignore the request header fields in our analysis. Note that we then also ignore the attacks on web application that do indeed take place via the header fields, such as via the Cookie field, but they are less common [44].
which is specified in the Content-Type header field. For this content type, a query-style string is included in the request body, such as:
name=John&gender=M&age=24
For simplicity we will assume this Content-Type throughout the report for POST requests. However, we will also handle the other common request body Content-Types later in this report, such as multipart/form-data,
application/xml and application/json.
3.2 Attacks in the HTTP request line and request body
Wrong handling of client data in any function of the web application can introduce a security weakness which may be exploited by an attacker. Most attacks on web applications make use of the HTTP request line, specifically the URI string and the request body to insert the payload. The Open Web Application Security Project (OWASP) has tracked and studied the trends of web vulnerabilities throughout the years, and periodically publishes their findings on this subject. Among their publications is a list of the 10 most critical web application security risks, a top 10 list of which an up-to-date version is periodically published. The latest version is the OWASP Top 10 from 2013 [46].
When we look at the top 10, we see that for many of the attack types the attack payloads contain valid data, where valid means that the attack cannot be distinguished from normal user behavior solely based on the payload. For example, with Broken Authentication and Session Management, which is placed 2nd in the list, an
attacker uses legitimate authentication data to trick a badly implemented authentication mechanism into believing that the attacker is some known valid user, possibly one that is already logged in, such that the attacker is provided with unauthorized access. This kind of an attack makes use of valid request data. For example, one scenario that is described in the OWASP document is a GET request with a valid session identifier in the URI. In order to detect such an attack, the detection system would have to evaluate more than just the request line and request body of the HTTP request. Another example is number 4 on the list,
Insecure Direct Object References. For this attack the attacker “changes a parameter value that directly refers to a system object to another object the user isn’t authorized for”. In this case the object is still a valid object,
so this attack cannot be detected by solely looking at the request URI and body. The same counts for the other types of attacks, except for numbers 1, 3, 4, and 10, which are the types of attacks which our research focuses on. They are based on an abnormal payload in the request URI and/or the request body, and they are among the most prevalent attacks given that two of these kinds of attacks are in the top 3 of the OWASP Top 10. Actually we could also state that number 9, Using Components with Known Vulnerabilities, is also partly covered by our research, because this type is linked to every kind of attack.
parameter value usually differs from the “normal” range of parameter values and the attack can thus be distinguished by only looking at the URI query string.
Where number 10 is mostly used to redirect other users to malicious web-based locations, number 4, i.e.
Insecure Direct Object References, will mainly be used by an attacker to personally gain access to local
unauthorized resources. This is another example of an instance where malicious user input can lead to unwanted effects when the input is not properly validated. A direct object reference occurs when a developer exposes a reference to an internal implementation object, such as a file, directory, or database key. Without proper sanitization of user input, attackers will be able to manipulate these references to access unauthorized data.
Number 3, Cross-Site Scripting (XSS), occurs when an application includes user supplied data in a page sent to the browser without properly validating or escaping that content. An attacker can send malicious scripts to these specific parts of the application, exploiting the interpreter of the client’s browser, which will execute these scripts. The scripts can be crafted to hijack user sessions, deface web sites, insert hostile content, redirect users, hijack the user’s browser using malware, etc. Although XSS is the most prevalent web application security flaw, it is not ranked 1st in the list because its impact is limited to the client side of the
application, not affecting the server of the web application itself. In order to send the data to the application, the attacker will generally use the request URI and request body, because these are the parts of the request from which the application usually retrieves the incoming data, not counting the exceptions such as the Cookie header. Because the XSS payloads contain script-related special characters, they can usually be distinguished from normal data by inspecting the request URI and request body.
Injection tops the OWASP Top 10 list. Injection flaws occur when an application sends untrusted data to a
server-side interpreter. A common example is SQL injection, which is a form of injection where user supplied data is included in an SQL command without properly validating or escaping that content. As opposed to XSS, which exploited a client-side interpreter, the SQL command is interpreted by the back end (in this case the database management system) of the application. This type of injection can result in the attacker having access and control over the entire database, which can cause data loss or corruption. Other types of injection, such as OS commands injection, can even cause the takeover of a complete host. As was also the case for XSS, the attacker will generally use the request URI and request body to send the payload, the content of which can usually be distinguished from normal data.
4. WEB-BASED NIDS TYPES - FURTHER NARROWING DOWN
THE SCOPE
flawless solution for the automation of a proper detection process that is able to distinguish these attacks from normal data. For state-of-the-art web-based NIDS’s there currently exists a trade-off between the detection of real attacks, called “true positives”, and the unwanted behavior of classifying legitimate data as attacks, called “false positives”. Different approaches to intrusion detection try to find an optimal trade-off, in which the rate of true positives is maximized and the rate of false positives is minimized. In the remaining part of this chapter we will discuss the most well-known approaches in web-based Network Intrusion Detection.
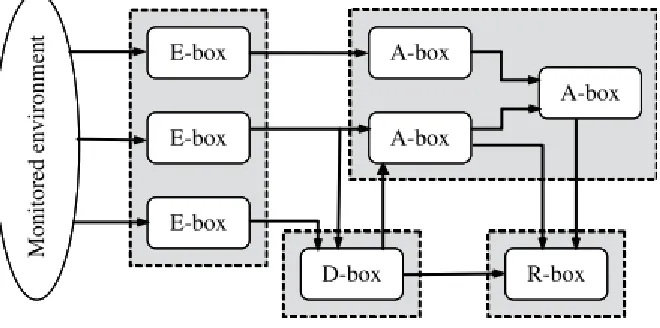
The CIDF (“Common Intrusion Detection Framework”) is a working group created by DARPA in 1998, mainly oriented towards creating a common framework in the IDS field. The group has defined a general IDS architecture based on four types of modules:
- E-blocks (“Event-boxes”). Consists out of sensor systems that monitor a system, acquiring information and sending relevant information to the other blocks.
- D-blocks (“Database-boxes”). The purpose of these blocks is to store information that was acquired by the E-blocks before the information is further processed in the other blocks.
- A-blocks (“Analysis-boxes”). These blocks process the information that is available from the D-blocks, trying to detect potential hostile events and raising alarms when necessary.
- R-blocks (“Response-boxes”). When the IDS also incorporates prevention in addition to detection, these blocks are responsible for executing the appropriate action in response to certain malicious events that were detected by the A-blocks.
[image:11.612.143.473.457.621.2]This structure is visualized in the following figure [1].
Figure 1 – IDS architecture as described by the CIDF
network based systems the sensors are of a different kind, capturing and dissecting network traffic into useful information on, for example, the payload, the IP address, and the protocol.
We already mentioned that we will handle the network based systems in this report, more specifically those that operate on the HTTP(S) protocol. Now when we look at the Analysis-boxes for this type of system, we can further make a distinction between the ways in which information is analyzed in order to detect malicious events. A distinction is made here between signature-based and anomaly-based systems.
4.1 Signature based IDS
Signature-based systems try to find certain patterns (“signatures”) in the traffic. The signatures specify certain filters, usually on a per-packet basis. These filters consist of, for example, the destination port
number, certain hexadecimal or ASCII codes in the packet payload, or a certain value in a packet header field. The signatures represent malicious behavior; in essence the total set of possible malicious behavior is specified and stored beforehand and the live traffic is analyzed and scanned for malicious behavior based on this model. The total set of possible malicious behavior is hard to define at a certain point in time. Moreover, the set is ever expanding as new attacks are crafted based on, for example, newly discovered security vulnerabilities in a certain application or protocol. Therefore the signatures usually represent the attacks that are currently known in the industry and in general a signature based IDS relies on these signature sets, which are either publicly available or can be purchased from certain parties. Since these signature sets are created based on all attacks that are known in the wild, the properties of a specific network are not taken into consideration. When implementing a signature based system in a network, it usually requires tweaking or disabling part of the signatures in order to make the system more effective for that specific network. Because the creation of new signatures is not automated based on newly discovered attacks which occur in the wild, there is a delay between the time a new kind of attack is discovered and the time the (publicly) available signatures are updated. Research has shown that signature updates are typically available later than software patching releases. Moreover, signature updates are generally released within the first 100 days from a vulnerability disclosure [2]. This means that for signature based systems, there can be quite a long period of time during which the IDS is incapable of detecting an attack which is already known to the public. Most of the time a signature is specified for (part of) a single attack, such as a certain shellcode payload or buffer overflow attack. In such cases, signatures perform well when it comes to detecting these specific attacks. However, a shortcoming is that in general an attacker only has to create a tiny variation for such an attack in order to already be able to circumvent the IDS. For example, the content of the attack could be scrambled by using some very simple form of encryption.
In addition, there are also signatures which cover a range of possible attacks, such as for SQL injection and XSS attacks. It has been shown that the default Snort rules against SQL injection are good but not
the entire set of possible malicious traffic patterns related to SQL injection using this signature based regular expression approach, mainly because the set of signatures will become so large that the processing time will become unacceptable. Note that for a signature based system such as Snort, traffic will be compared to each available signature, such that a larger set of available signatures will increase the processing time for each packet. This may become a serious burden on large-volume networks.
Based on this analysis we can conclude that although signature based systems perform well in detecting a wide range of attacks, it is hard to detect the more sophisticated attacks. In addition, a signature based IDS will not be able to detect zero-day attacks, although these occur less frequent in the web-application area which we are focusing on1.
4.2 Anomaly based IDS
In contrast to signature based systems, an anomaly based IDS compares traffic with a model of “normal” behavior and raises an alert whenever the traffic does not correspond to the model. Another important difference compared to signature based systems is that the model is created autonomously, in a period during which live traffic is observed. This is different for signature based systems, which usually rely on pre-defined signatures. Although these signatures may be disabled or tweaked to a certain extent and in some cases new signatures may be added based on the monitoring preferences on a specific network, this will all involve manual work. If not, such as a system which is able to identify normal behavior, but creates a signature for all behavior that does not correspond to this model (creates an anti-model), would actually be an anomaly based system. In such cases the system may raise an alarm whenever the difference between the observed behavior and the model falls below a given limit [1]. In this research we will focus on anomaly based systems which create a model that corresponds to normal behavior, as opposed to a model of anomalous behavior.
In addition to detecting attacks on the monitored system itself, an anomaly based IDS can also be useful to detect other kinds of abnormalities occurring in the applications that run on the system. For example, on a web application level a bank may be interested in knowing whether an anomalous value was entered in the “amount” field of an HTML form that is used to create a transaction. Although this sanitation seems more like a responsibility for the part of the application that handles the form processing, the implementation of these security checks within the application can be overlooked. In case an attacker performs such an attack on the application, the anomalous value does not necessarily contain attack-specific characteristics, such as special characters or SQL keywords. Instead, the submitted value could for example be an exceptionally big number. For a signature based system it would be harder to detect such an “attack” than for an anomaly based system, the latter of which could have a model wherein it is specified that the “amount”, which represents a
1 Note that the term “zero-day attacks” here refers to unknown SQL/XSS attacks which are not based on a
monetary value, contains a number of 1 to 7 digits, optionally followed by a dot and 1 to 2 digits for the decimal value.
4.2.1 SCOPE WITHIN ANOMALY BASED IDS
Within the field of anomaly based intrusion detection systems a certain IDS can further be classified based on several characteristics. Estevez-Tapiador et al. provide three criteria with a corresponding classification tree [7]. We will briefly describe the proposed taxonomy and based on this we will classify the type of system that is subject to this research.
4.2.1.1
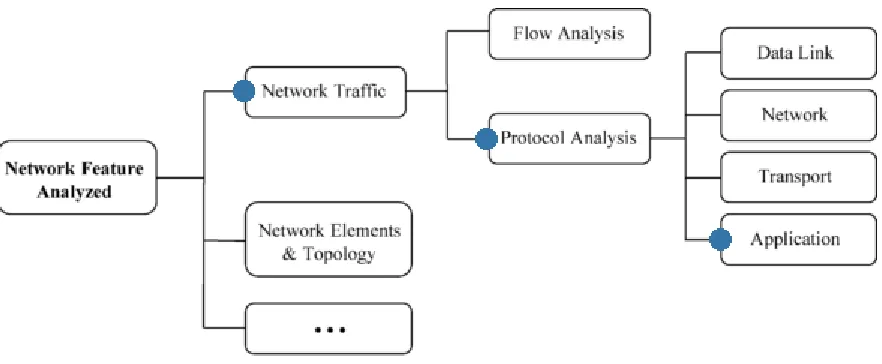
Network feature analyzed
A certain network can be studied from several points of view. The unique network related property that is analyzed by intrusion detection systems is the traffic within a network. Methods that create models from observed traffic can be divided into two groups, which are flow analysis and protocol analysis. Flow analysis is concerned with observing the variability of certain measures over time. For example, the number of
[image:14.612.86.527.414.596.2]IP/TCP/UDP/ICMP packets sent/received by a certain host during a fixed time interval can serve as a measure for flow analysis. This research is not about flow analysis, but instead we will focus on protocol analysis. Within protocol analysis the classification in [7] somewhat relates to the OSI model. Protocol analysis can be performed on a data link level (ethernet), network level (IP), transport/control level (TCP, UDP, ICMP, etc.), and application level (HTTP, DNS, FTP, SSH, etc.). The system in this research performs analysis on the application level, specifically focusing on the HTTP protocol.
Figure 2 - IDS scope: Network feature analyzed
4.2.1.2
Analysis scale
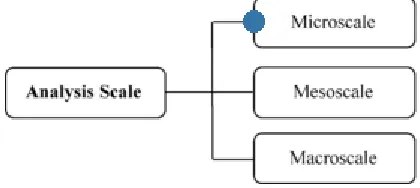
addresses are equal and can easily be detected by inspecting each packet separately [8]. On the other hand, detection of certain forms of DDoS attacks usually requires a certain correlation or aggregation mechanism among different sources and connections, since the anomaly will not be able to be inferred from the inspection of individual packets.
[image:15.612.201.411.226.320.2]On a level of protocol analysis, the microscale entails the analysis of individual packets. On the mesoscale connections or packet streams are analyzed and finally there is the macroscale in which analysis of several connections is performed simultaneously and event correlation is done within the whole network. The HTTP protocol analysis in this research is carried out on a microscale, i.e. the inspection of individual packets.
Figure 3 - IDS scope: Analysis scale
4.2.1.2
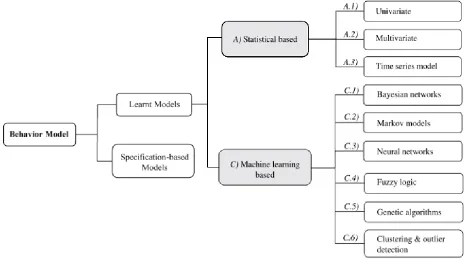
Behavior model
The model of normal behavior lies at the center of an anomaly based IDS. In general there are two main approaches for the construction of such a model. The first approach is based on self-learning techniques in order to automatically obtain a representation of normal behavior from the analysis of network traffic. The second approach is one in which the specifications for normal behavior are provided manually. Specification-based approaches are especially useful when the number of entities that is modeled as well as the
specifications of these entities remain relatively fixed and are not highly susceptible to change. For example, the description of the inner workings of many protocols are, in general, described in IETF RFC’s. When network traffic is to be analyzed for only a small and fixed number of protocols, these RFC’s could be translated into models of normal behavior. However, it has been reported that creating models from specifications is difficult and time-consuming [1][7]. Moreover, in environments in which new models should frequently be created and adapted, specification based modeling is often infeasible. In such cases learning-based techniques are preferred. Because in [1] a more elaborate overview of the different learning
Figure 4 - IDS scope: Behavior model
4.2.2 CREATING AND UPDATING THE MODEL
In order to generate the model that lies at the center of any anomaly based IDS, a certain model creation algorithm is used. This algorithm is usually fed with a simplified version of the data that is monitored, consisting only out of the characteristics that are of interest and which can serve to represent normal behavior. The process of converting the monitored data to a simplified, generic representation that can be included in the model is often called “dimensionality reduction” or “feature extraction”. As soon as the initial model has been created from observed traffic, the detection can start. For different model creation
[image:17.612.88.529.401.686.2]algorithms, there are different ways of determining at what moment the model has reached an acceptable level of accuracy in order to be able to start the detection phase with this model without triggering an unacceptable false positive rate due to the inaccuracy of the model. Finally, because the monitored environment is often subject to change, the model should also adapt to this change. This means that either the existing model is used and is retrained based on newly observed legitimate behavior, or a new model is created. This process is further described in chapter 6. An overview of the different phases that can apply to the model is in the figure below. Note that this schema applies to the situation when a model is constructed based on network traffic. As we will see in chapter 6, it is also possible that a model is created based on the inner workings of the software that is served to the user. For this purpose, the set of range of possible legitimate interactions that the user can perform with the software is derived from the application’s source code.
In Figure 5, the different stages that apply to the life-cycle of the model are displayed. All three stages make use of features that are extracted from events that take place in the monitored environment. In the first phase, these features are used to create a model. In this stage it is often preferable that the rate of attacks that is present in the environment is low, such that the model will not be polluted with this data. In the detection phase, the extracted features are compared with the model. Possibly, the features from the monitored event do not adhere to the model, such that an alarm or intrusion report will be generated. The third phase is optional; not every anomaly based IDS does incorporate this step. This retraining step is triggered in a response to newly observed legitimate behavior in the monitored environment which is not yet present in the model, and thus generates false positives. For the retraining phase either the existing model can be updated, or an entirely new model is constructed.
We conclude this chapter with the definition of an “autonomic” anomaly based IDS as described in [34], as it largely applies to the notions of model creation, updating and retraining. The authors describe that an autonomic IDS should have the following abilities:
- Self-labeling: automatically identifying the anomalies in unlabeled data streams;
- Self-updating: continuously updating the detection model by incorporating incoming labeled normal data in order to maintain an accurate detection model over time;
- Self-adapting: adapting the detection model to behavioral changes by re-building the model as soon as a change is detected in data streams.
The self-updating ability consists in updating the detection model to take into account the normal variability of the data. On the opposite, self-adapting consists in rebuilding the detection model in case of behavioral changes.
4.2.3 STATE OF THE ART IN WEB-BASED A-NIDS
4.2.3.1
Feature extraction techniques
With an anomaly based system we will compare traffic with an existing model that represents “normal” traffic. In general, this model has been created from data which does not necessarily contain the range of all possible legitimate behavior for the environment that is being monitored. With respect to the data that has been gathered during the data acquisition phase, it is therefore often desired to make a generalized representation of this data when creating the model, such that the system will not only allow the specific values that have been observed, but also all values within the range of the general representation. For example, when observing multiple requests that contain the attribute “id” for a certain web resource, we may acquire the following attribute values: 100, 540, and 9281. After observing more and more different values we would like our model not only to allow these specific values to be considered valid, but rather a certain range of integers, or simply all integers. This way of generalization allows us to reduce the
dimensionality of the problem significantly without losing relevant information needed for the intrusion detection. The flexibility that is included in this part determines the rate of false positives and false negatives; allowing less flexibility will result in more false positives, while more flexibility will increase the number of false negatives. Therefore, it is important that a well substantiated decision is made with respect to this flexibility. In order to increase the flexibility of the model relative to the situation where one would only allow the values that were observed during the training phase, we will try to generalize the values by extracting certain features that are of interest. Different features can be chosen as a way to generalize the data. Because our research is focused on web-based detection, we will limit the analysis of feature extraction methods to those that are applicable to web traffic.
One possible feature that is often used in web-based detection is that of overlapping character sequences (an n-gram model). This approach is, for example, used in [13] and [14]. Here the characters of the data strings first go through an abstraction function. Since, when making code injections, attackers use specific
attacks, cross-site scripting attacks and path traversal attacks in general have a different character distribution than legitimate requests. This specific feature can also be regarded as a 1-gram method. In addition to detecting attacks that are based on a single HTTP request, [14] also considers the detection of scanning and brute-forcing attacks by creating a model for network traffic with respect to time. In this method a time interval is split into parts of equal length, called “time bins”. Each request is characterized by a set of parameters that may serve in detecting certain attacks. The parameters include the user’s IP address, requested web resource with its attributes, the amount of transferred bytes and server’s response code. The parameters of a request will be put in a specific time bin that corresponds to the point in time at which the request took place. As a final feature the authors calculate what they call the “sample entropy” as a way to capture the degree of dispersal or concentration of the parameters’ distributions.
It is important to note that the features that have been extracted in the phase that has been described in this paragraph in itself do not directly compose the entire model for “normal” behavior. In order to create the final model against which we can classify newly observed requests, the features that were extracted during the training phase will be processed using certain data-mining techniques. We will handle these in the next paragraph.
4.2.3.2
Model creation techniques
Generally the literature about model creation techniques for web-based A-NIDS’s is about machine learning based techniques and less about statistical based techniques. This seems to be related to the advantages of machine learning based systems when it comes to changes in normal behavior in the monitored
environment, which were discussed in paragraph 4.2.1.2. A large part of the literature in which these techniques are proposed, also explicitly mention the advantages with respect to the self-adaptation capabilities of the model.
In [13] the combination of using n-grams with DBSCAN for the entire URI gave optimal results relative to other often used methods, although [14] is later work from the same authors and here the web resources and attribute values are treated separately. In this paper they also compare different classification methods, namely SVDD, K-means, DBSCAN, SOM and LOF when applied to web resources, attribute values and user agents. They have found that their method, which is using SVDD to classify web resources, K-means for attribute values and DBSCAN for user agents performs optimal with respect to the detection accuracy. It can therefore be assumed that this combination of techniques gives relatively good results. However, the advantages and disadvantages with respect to retraining also need to be taken into account. As was described earlier, with the approaches in [13] and [14] the retraining can be done on the fly, which makes them suitable for self-adaptation.
two-dimensional representation space, containing a grid of neurons. In a SOM the vectors that are closely related are located near each other in the neuron grid. The structure of the SOM automatically adapts as new inputs are provided. In [15] the SOM is used to determine the number of the neuron that most closely corresponds the payload, i.e. the “winning” neuron, which in its turn corresponds to a certain model that was created during the training phase. This model is subsequently used as the reference value in a classification algorithm called PAYL, which will eventually determine whether the observed request is anomalous based on an n-gram analysis. The authors substantiate the use of a SOM by stating that it is better able to deal with high-dimensional data than, for example, K-means and K-medoids. Actually the SOM and PAYL combination is only used for parameters that contain a certain minimal amount of special characters. Up to some amount of special characters, the researchers propose a method that is able to infer regular expressions from a series of example input values. The regular expressions are automatically adapted so that they also allow “similar” values. One argument in favor of using regexes is that they are easy to understand and tweak by a system administrator.
In [16], the authors put forward two main drawbacks of using a SOM. They mention that the size and dimensionality of the basic SOM model is required to be fixed prior to the training process and there is no systematic method for identifying an optimal SOM configuration. In addition, a traditional SOM cannot represent hierarchical relations that might be present in the data. A Growing Hierarchical SOM (GHSOM) would overcome these issues. A GHSOM consists of several SOM’s structured in layers, the number of which together with the number of neurons in each map and maps in each layer are determined during the
unsupervised learning process. Thus, as with a SOM, the structure of the GHSOM is automatically adapted to the structure of the data.
In [17] the limitations of the SOM are tackled by using a DGSOT (Dynamically Growing Self Organizing Tree), which is also hierarchical by nature. This clustering algorithm is augmented with a combination of SVM (Support Vector Machines) as a way to save computation overhead when creating the tree. Unfortunately, no empirical research was performed with this technique, so it is hard to compare its advantages to, for
example, the GHSOM approach that was proposed in [16]. This issue also applies to the tree structure used in [18].
In [19], a somewhat different approach is adopted. Here, the occurrence probability of each character in a payload is considered to model the traffic, the payload being the URI string. Following this idea, the authors extend the model by calculating the conditional probability, i.e. the probability of a character occurring given the previous one. The authors make clear that certain patterns exist with respect to this conditional
probability matrices, which can be used to differentiate between normal and abnormal traffic. In order to use the feature of the conditional probability as a way of classification, they make use of a Markov chain. The transition matrix is represented by the conditional probabilities and the initial probability vector consists of the probability of a given character being the first character in the payload. In order to determine whether an incoming request is anomalous with respect to the current Markov chain, a formula called LogMAP is
chain. In addition, the authors test some extensions to the algorithm and in the end they are able to achieve a 5% false positive ratio. However, even lower false positive ratios have been reported in [13] and [14]. In [13], first all unique n-grams and their frequencies of occurrence in the training set are determined.
Subsequently it is argued that for a certain request, the ratios of the frequency of appearance of abnormal n-grams in that request and those n-n-grams in the training set can be used to classify the request either as “normal” or “abnormal”. However, some attacks may contain many different n-grams with a low frequency of occurrence, which would lower the ratio, classifying the request closer to normal behavior. In order to overcome this issue, the authors have proposed a formula in which a large number of different, yet abnormal n-grams are also classified as abnormal. With this formula the “distances” of each request with respect to normal behavior can be defined. Once this has been done, this data is classified using a clustering technique called DBSCAN. This algorithm will create the final model against which outliers can be detected. The authors argue that this method is more simplistic and performs better than using K-nearest neighbor, N-gram in combination with GHSOM and N-gram in combination with Diffusion Maps with regard to the true positive rate, the false positive rate, the accuracy (i.e. the ratio of the total number of correctly detected requests to the total number of requests in the testing set) and the precision (the ratio of the number of correctly detected intrusions to the number of requests classified as intrusions).
For classification of the header fields the authors in [13] use the same technique as for the requested URI’s, but a simplified version that does not include the DBSCAN clustering step. They only use the custom formula that calculates the distance between the observed request and normal behavior. If at least for one header type the distance is greater than zero, the query is classified as intrusive, otherwise it is considered as legitimate.
In [14], the authors use SVDD (Support Vector Data Description) to classify the web resources. Support vector data description (SVDD) by is a method to find the boundary around a data set. SVDD has been successfully applied in a wide variety of application domains such as handwritten digit recognition, face recognition, pattern-denoising and anomaly detection [20]. The algorithm tries to define a spherical boundary, in feature space, around the data. The volume of this hypersphere is minimized, to minimize the effect of incorporating outliers in the solution. This as opposed to the related SVM (Supported Vector Machine) method, which creates an optimal hyperplane instead of a sphere. There is a lack of studies that compare the two methods and it is unclear in which situations one would perform better than the other. In [21] it is argued that both methods are different versions of the USVM (Unified SVM), an algorithm which the authors have proposed in the paper and which seems to perform better than when using SVDD or SVM separately. Future research could investigate whether USVM outperforms SVDD in the area of HTTP anomaly detection.
represents the largest possible variance among any projection of the data set (that is, accounts for as much of the variability in the data as possible), and each succeeding component in turn has the highest variance. In essence, with PCA one tries to fit an n-dimensional ellipsoid to the data, where each axis of the ellipsoid represents a principal component. A small axis in the ellipse will mean that the variance along that axis is also small. When one would omit that axis and its corresponding principal component from the representation of the dataset, only a small amount of information would be lost. In order to create this structure, the
eigenvectors of the covariance matrix of the feature vectors are required.
For classifying query attributes the researchers in [14] use a simpler method, namely K-means. This is an unsupervised partitioning technique that classifies a dataset into clusters. The number of clusters is provided beforehand and the algorithm tries to minimize the sum of distances between each feature vector and the mean of the cluster which the vector belongs to. For classifying the header fields, DBSCAN is used, the same way as it was used in [13] to classify the web resources and query attributes. Only the User Agent field is considered. Finally, time bin statistics are classified by applying z-score normalization to the time bin entropies that were obtained during the feature extraction phase and for the detection phase the authors propose a threshold formula in order to differentiate between anomalous sequences of requests. In the end the authors claim to have reached a 0.8% false positive ratio for web resources, a 0% false positive ratio for attribute values and a 2.5% false positive ratio for User agent strings.
5. UPDATING THE MODEL - THE SUBJECT OF RESEARCH
When a web-application is changed by its developers, this may cause noticeable changes in HTTP requests that are sent to the server. Web resources, attribute names and attribute values are therefore subject to change. Because of the fact that a model of normal behavior is at the basis of the anomaly detection engine, this model should be able to adapt to these changes in the environment. The notion of self-adaptation of a detection system to legitimate changes in the environment was already a subject of research several decades ago [38]. However, self-adaptation for web-based detection systems is a more recent topic, and the
availability of research on this topic is still quite scarce. Most papers that mention the concept of self-adaptation, actually refer to the fact that during the training phase the model is able to adapt autonomously to different inputs, which is a criterion that is often used in favor of certain machine learning based systems, such as the GHSOM in [16]. Several papers do not even mention the important aspect of self-adaptation and others, such as [13] and [16], simply suggest to retrain the system after a certain period of time, without further specifying the specifics related to this timespan and the retraining method.
period of time or after processing a certain number of requests. In order to fine-tune this definition so that we can come up with a better defined method for self-adaptation, it would be valuable to investigate the specifics regarding the number of requests or the time that passes before the system needs to be retrained. From a usability perspective it would be preferred to have the system determine this automatically. This could, for example, be achieved with historic data about changes in the application which could be inferred from HTTP requests by looking at changes in parameter names and values. A metric should be defined then that is able to classify a change in parameter value or name as being either a change in the application or a true positive, for example when requests that include a new web resource, attribute name or attribute value is requested for a certain number of times from different IP addresses. However, it is important that an attacker is not able to abuse this part of the system. Therefore, there is a trade-off between security and usability and the proper balance need to be found when creating this “legitimate change logic”. In the described case, an attacker could have control over different IP addresses and then initiate an attack. An additional measure may therefore be to only consider IP addresses of users that can be considered legitimate.
This research will focus on this trade-off between security and usability while aiming to define a more specific method for the self-adaptation of a web-based ANIDS to legitimate changes in the environment. In a more general way this is reflected in the main research question, which is the following:
HOW CAN A WEB-BASED ANIDS AUTONOMOUSLY ADAPT TO
LEGITIMATE CHANGES IN THE MONITORED WEB
APPLICATION?
As we have described before, two important aspects in the self-adaptation process are distinguishing
legitimate changes as well as retraining the model. From the research that is available on these topics, we will select the methods that apply optimally to our area of interest, which are web-based intrusion detection systems. The following two sub questions reflect these matters:
WHEN CAN AN OBSERVED CHANGE BE CONSIDERED TO BE LEGITIMATE?
ꟷ
WHEN A LEGITIMATE CHANGE HAS BEEN DISTINGUISHED, HOW TO UPDATE THE MODEL?
compatible with certain model creation algorithms, and incompatible with others. This brings us to the final sub question:
ARE CERTAIN TRAINING ALGORITHMS MORE PREFERABLE THAN OTHERS WHEN IT COMES TO THE PROPOSED METHODS FOR DISTINGUISHING
LEGITIMATE CHANGES AND RETRAINING THE MODEL?
Different techniques related to the research questions will be described in the next chapters, and we will propose and test our own method for self-adaptation based on a selection of techniques that will be combined into one system. In chapter 9 we will conclude this research by answering the research questions based on whether our proposed system proves to be successful.
6. SELF-ADAPTATION
In case of a change in system behavior, the base profile must be updated with the corresponding change so that it does not give any false positives alarms in future. This means that the system either continuously incorporates the live traffic into the model in real-time, or otherwise uses a mechanism for deciding whether to update the model. If the system tries to make a change to the base profile every time it sees a deviation, there is a potential danger of incorporating intrusive activities into the profile. The IDS must be able to adapt to these changes while still recognizing abnormal activities. If both intrusive behavior and a change in normal behavior occur during a particular time interval, the problem becomes more complicated. There are also additional issues that need to be addressed in case of updating. The system should adapt to rapid changes as well as gradual changes in system behavior. Selecting the time interval at which the update should take place is also an important issue. If the interval is too long, the system may miss rapid changes or short-term attacks. If the interval is too short, the system may miss some long-term changes. Different approaches to self-adaptation will be discussed in this chapter. First, we will handle those systems that are able to determine the point in time when a legitimate change has been observed, which serves as a trigger for updating the model and which is therefore more efficient than the methods in paragraph 6.2, which continuously update the model based on live traffic. A system that uses a combination of the advantages of both approaches is discussed in paragraph 6.3. In addition to describing the method to determine the
6.1 Detecting abrupt and gradual changes in observed traffic:
threshold-based systems
Threshold-based systems make use of a certain threshold that determines when to evaluate whether recent observed changes are legitimate or illegitimate. In case of legitimate behavior, the model is usually re-created or updated so that it incorporates the new legitimate behavior. For illegitimate behavior, an alert will usually be triggered when this has not already been done during the individual detection of the outliers. In general these systems use a threshold that represents the rate and/or amount of new outliers, but simple time-based thresholds are also used. In this chapter we have made a distinction between systems that detect changes from observed traffic (paragraph 6.1.1) and systems that detect changes from the underlying system (paragraph 6.1.2). In paragraph 6.1.3 we include a few remarks on the retraining of the models for this type of systems.
6.1.1 SYSTEMS THAT DETECT LEGITIMATE CHANGES FROM OBSERVED TRAFFIC
[image:26.612.166.438.494.659.2]For distinguishing legitimate from illegitimate changes in the observed data, the authors in [24] investigate a host-based approach where they continuously measure the similarity between each day’s activity and the profile of system calls executed by users and utilize this similarity trace. If the similarity stays above a threshold level, then the profile is taken to be a correct reflection of the current activities. If the similarity goes down below the threshold level, then there can be two possibilities: either the behavioral patterns are changing or the system is under attack. In order to distinguish between these two possibilities, the rate of change in the similarity is measured. If an abrupt change is encountered, it is interpreted as an intrusion, and that time window will not be used to update the profile. If a gradual negative change is encountered, then that time window will be used to update the profile. It is assumed that behavioral change occurs gradually, not abruptly. This is illustrated in Figure 6, taken from [24].
The activities before point A are considered to be normal and the profile does not need any update. Between points A and B, the patterns represent some behavioral change and the profile needs to be updated.
Between points C and D, the patterns represent intrusive behavior and no update is made. The authors suggest using a sliding window technique such that only the monitored actions from day n-1 are considered when updating the model, so that computational efficiency is increased and the old data, which would less represent the current normal behavior, is discarded.
The threshold-based method that was described was used as a host-based detection method and will only detect attacks after a certain period of time, because it will even take some time to distinguish an abrupt change. For host based systems, it is quite usual that an attack will cause anomalous traffic over a certain time period. For example, a system intrusion, virus or worm will usually account for several subsequent anomalous system calls. Having only the ability to detect changes in a less-than-immediate time window may not always be desired behavior. This especially applies to network-based detection systems, where a single anomalous packet, such as one that contains an SQL injection string, can already have substantial effects. In case of such an event, it is therefore usually desired to have the detection system raise an alarm
immediately. Therefore, in such cases the threshold that will be used to track gradual, legitimate changes, is different from the threshold that is used to detect immediate changes, which is the anomaly-threshold for which the detection system will raise an alarm whenever the anomaly-score of an incoming data packet exceeds it.
Figure 7 - Sliding window approach
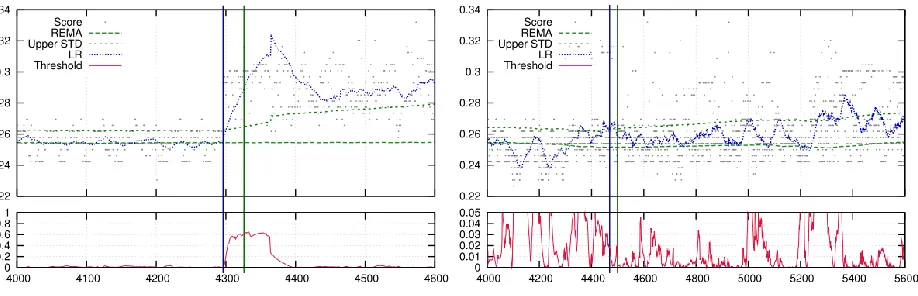
A more extensive way of detecting concept drift from changes in the observed traffic is provided in [31]. Here, a method consisting of a combination of technical analysis tools which are typically used in predicting and verifying financial market data is used to guide the IDS by providing information on when a legitimate change in traffic occurs. The method assumes that the IDS system is able to assign a certain anomaly score to a packet (for anomaly detection the researchers use the statistical properties of the relative byte frequency as a feature, making it possible to assign a score to the statistical deviation). Each packet will be mapped to an anomaly score and with this data a time series graph is constructed that can be used for statistical analysis, specifically to detect changes in the statistical behavior of the anomaly scores. In order to detect changes in a “trend”, the authors make a distinction between identifying the point in time when a change has been observed during a short time interval, and identifying the point in time at which this rapid change has evolved to a new trend. The latter analysis that involves the determination of the long-term change will only be initiated as soon as a short-term change has been observed.
In order to define a threshold for the short-term change, first linear regression (LR) is performed on the last n packets. Subsequently, the correlation of the score of each new packet with the value predicted from the LR is tracked. The correlation will measure how well the prediction from the LR matches the actual observed value. It is assumed that for traffic in which no concept drift occurs, in general the scores of incoming packets are not very correlated with the predictions from the LR. This is because the scores will usually be randomly distributed within the anomaly threshold bounds, which are the thresholds that define when the IDS should raise an alert. Because in case of an absence of concept drift the correlation remains low, when a concept drift occurs this will be visible as a rise in the correlation. This is because for multiple subsequent new packets, the score of those packets will be shifted by a certain amount relatively to the scores in the period preceding the concept drift event. The predictions from the LR will now converge towards these shifted scores, making the correlation value rise for some time, which is a situation that is unique for concept drift. Now to identify short-term change, the authors simply suggest to look for a single rise in the correlation. This denotes the event of a “potential upcoming change”.
direction of the LR predictions is tracking in the same direction as the incoming scores. As a measure, the percentage of rising during the interval is examined. When this percentage exceeds a certain threshold, this first part of the trend-confirmation algorithm will have determined a potential change in the trend. In order to completely confirm the trend break, we will look at the second part of the confirmation algorithm. This part analyzes the “reverse exponential moving average” (REMA). A moving average (MA) is a series of averages from a data-set over a fixed window size. The exponential moving average (EMA) will assign more importance to recent values. Reversing this property will emphasize the older scores inside the sample window. Slowing down the reaction of the moving average this way gives the ability to smoothly determine changes within the algorithm. Actual attacks and false positives that intermittently occur will have less of an immediate impact. The algorithm will use the running standard deviation as a representation of the
boundaries of known scores. In the financial technical analysis world, this is known as the Bollinger Band. By identifying how the score falls relative to this band, changes in score patterns or trends can be tracked. Coupling standard deviation with the slower moving REMA will allow normal score-range trend changes to pass through the system without raising an alarm or triggering the self-update mechanism. Due to the slow nature of REMA, incoming scores that land outside the bounds become points of interest, but have little immediate effect on the REMA line. However, by calculating the percentage of scores over a given sample size that lies inside the standard deviation bounds, it can be determined whether if those scores are moving to a new trend. When only a small percentage of scores lies inside the bounds, it is more likely that concept drift has occurred.
The authors show that it is required to use the conjunction of the verdicts of both parts of the confirmation algorithm in order to be able to accurately define a long-term trend break at a certain point in time. The primary tuning of the algorithm is done by specifying the REMA’s window size and the LR’s window size to control the reaction speed of the MA and LR. A third window size, called the confirmation window size, is also used. This tunable window size acts as a boundary for the two parameters that are involved in the long-term change analysis; the percentage of rising correlation and the percentage of scores within a standard deviation bounds of the REMA. A shorter window size and more tight bounds on the parameters will cause the
algorithm to be less averse in concluding that there was concept drift.
The figure below was taken from [31] and it shows the results for the parameter configuration which performed best in the tests (i.e. with this combination the lowest rate of false positives and the highest rate of true positives was achieved). In the two multi-plots the same configuration of parameters was used, but with a different data-set. The first data-set includes a sharp change in data and the second includes a gradual change. However, both of the data-sets contain actual concept-drift. In the upper part of the multi-plots the x-axis represents the packet number and the y-axis represents the anomaly score. The small black dots are the observed packet scores, the “Upper STD” is the upper standard deviation bound for the REMA and the “Threshold” represents the anomaly score threshold before the IDS will raise its default alarm for the
confirmation window size of 30 packets. This means that the REMA is less volatile to changes and the LR is more volatile. Also, for 75% of the correlation measurements within the confirmation window size the correlation of packet scores with the LR values has to be larger than the previous correlation and less than 90% of packets should lie within the REMA standard deviation bounds before the algorithm will assume that concept drift has occurred. The blue vertical line indicates the point in time when a short-term change was observed, which is the case when there is a rise in correlation between the LR values and actual scores. This will trigger the long-term change analysis, which terminates after the confirmation window size of 30 packets, represented by the green vertical line. At this point in time the long-term change has either been confirmed, which is the case when within the confirmation window size there is a sufficient rate of rising correlation measurements as well as a sufficient amount of packet scores outside the REMA standard deviation bound, or concept-drift is rejected when these requirements are not met. In this case concept drift was successfully detected by the algorithm.
Figure 8 - Identifying trend breaks by using statistical methods
6.1.1.1
A classification feature for concept-drift detection: legitimate clients
these clusters would not be considered anomalous when they contain a requests that originate from hosts that have a certain level of reliability. This measure is calculated as follows2.
First, the request rate per host is calculated in Algorithm 1. In order to mitigate the influence of DoS attacks, a threshold is defined to penalize hosts that have generated an exceptional number of requests. Then in (2) the popularity index of each cluster is calculated; a value between zero and one based on the diversity of the hosts within the cluster. A higher number of different hosts that contribute to the requests in the cluster will increase the popularity of that cluster. After the popularity index of each cluster has been defined, the confidence index of the hosts will be determined in (3). This is done by looking at the popularity of the clusters for which the hosts have any requests. Subsequently, in (4) the confidence index of each cluster is calculated based on the confidence index of the hosts that have requests in the cluster. The final step in the pre-detection phase is to calculate the reputation index of each cluster by means of a weighted sum of the popularity index and the confidence index of the cluster, which is visible in (5).
Note that step (4) and (5), in which the confidence and reputation index of a cluster is calculated, are crucial. An attacker could easily forge a profile with a high confidence index by making sure that he has executed a large number of requests to popular clusters. When one would then merely accept an outlier as legitimate when it is only linked to one request of one legitimate client, an attacker can easily exploit this method. By calculating the reputation based on a combination of the sum of the confidence indexes of the hosts, i.e. the confidence index of the cluster, and the diversity of the hosts, i.e. the popularity of the cluster, with a proper threshold on the reputation index one is able to mitigate such an attack. Note that this threshold should be carefully chosen, as a sophisticated attacker could have control over multiple clients that are considered trustworthy. With a sufficient number of different legitimate clients under his control, the attacker will be able to fool the system into classifying a malicious request as being legitimate. This is very dangerous, because it has a severe impact on the effectiveness of the IDS when this method is feasible for an attacker. This reputation index of a cluster now represents the legitimacy of the requests in the cluster based on the hosts from which the requests originate; when the hosts themselves have proven to contribute to a sufficient part of legitimate requests within the application, the reputation will be higher. In addition to the standard criteria of cluster size, this reputation index can now also be considered when determining which clusters are outliers and should not be included in the final model. Clusters with a higher reputation index may now be included in the final model, even when the cluster size is below the threshold for that property. This is especially useful for coping with concept drift, because in such a case the clusters that will be formed from new incoming data will initially be small for the drifted traffic pattern and might otherwise be regarded as anomalous and thus creating false positives.