The debate on the type of urban form that is the most efficient with respect to transportation energy consumption and the associated pollutant emissions has produced ambiguous results. This paper contributes to the debate through an analysis of the efficiency ofsimulated urban forms for the time period 1991-2021 with the help ofIMULATE, an Integrated Transportation and Land Use Model for the Hamilton Census Metropolitan Area. The urban forms analysed are obtained by varying the spatial distribution ofthe projected household growth in the region. The status quo is compared to a compact urban form and to two multi nucleated forms. The results, albeit ambiguous, demonstrate that the way future scenarios are developed can have a significant impact on inferences drawn from such studies.
Pavlos Kanaroglou and Robert South are Professor and graduate student respectively at the Schoolof Geographyand
Geology at McMaster University.
22
Energy and Urban Form:
Special Feature
Can Urban Form Affect
Transportation
Energy Use and
Emissions?
An Analysis ofPotential Growth
Patterns for the Hamilton Census
Metropolitan Area
Pavlos S. Kanaroglou
and Robert South
I. INTRODUCTION
development, have now become common in the urban literature. The recent growth of this research focus has led to the inevitable fusion of issues that had formerly been studied in isolation. Two research areas that have recently been linked together, via their common focus on the issue of sustainable development, are urban form and the emissions and energy consumption ofautomobiles (Breheny, 1992, 138).
An issue that has been debated extensively within the urban form-transportation literature is whether the spatial arrangement of activities within an urban area has a large impact on the levels of pollutants emitted and energy consumed by private automobiles. Research on this issue consists of either empirical studies, which are based on direct observations, or of simulation studies that project the impacts of several hypothetical growth patterns and policy initiatives for a given urban area. The results ofthese studies have been mixed, rendering any relationship between urban form and transportation emissions highly ambiguous.
The research presented in this paper contributes to the urban form-transportation literature in two ways. First, we add to the debate by presenting the results of a simulation study designed to project the effect of four alternative growth strategies on automobile emissions and energy consumption. These results were obtained with the use of an urban simulation model developed for the Hamilton Census Metropolitan Area (CMA) (see Figure 1). Second, we demonstrate that the way in which a particular scenario is defined can alter the simulation results significantly. Suggestions for dealing with this problem are also addressed. It is important to emphasize here that although the scenarios being modelled represent hypothetical growth patterns, we try to ensure that they are feasible. Political or economic feasibility, however, of the most efficient scenarios is not examined.
The remainder of the paper is organised into four sections. The next section provides a review of the literature and debate surrounding the issue of urban form and automobile energy use and emissions. Then we discuss our analytical approach and describe of the urban simulation model employed in this analysis. We then describe the four scenarios, or hypothetical growth patterns, that are simulated, outline their data requirements
and present their results. Lastly, we offer some concluding remarks and directions for future research.
2. THE URBAN FORM-TRANSPORTATION RELATIONSHIP: A REVIEW
The spatial organisation of urban land uses (i.e., urban form) and the nature of the intra-urban transportation system have both changed significantly over time, particularly in North American cities. The evolution oftransportation and land use has been symbiotic: urban form has a large impact on transportation network performance and vice versa (Kelly, 1994, 137). As a result, any discussion that focuses on the spatial and temporal evolution of urban areas would be incomplete if it did not also discuss the development of the urban transportation system.
In the 1800s, cities were characterised by high densities and mixed land uses. Evidence of this is provided by Lewis who, in a study ofresidential and employment locations in Montreal between 1861 and 1901, found that workers, constrained to walking as the predominant mode of travel, were inclined to live close to their place of employment . (Lewis, 1991,144-146). In the late-1800s and early-1900s, the onset ofpublic transportation, such as cable cars, allowed for greater separation between land uses (Anderson et aI., 1996, 12; Olson, 1991, 251). As a result, cities became more dispersed and urban land became more segregated (e.g., commercial, industrial and residential zones). The process ofrapid suburbanisation in North American cities, a well documented phenomenon, did not begin until the 1950s (e.g., Bourne, 1991; Yeates, 1990). The substantial growth that has occurred in the outlying regions of urban areas since the 1950s can be attributed to a number offactors, including a general increase in the affluence of the population, the cost of land in peripheral areas and a desire for low-density housing. However, the single most important determinant of the 'urban sprawl' phenomenon was society's universal acceptance of the private automobile as the preferred mode of travel (Carley, 1992; Wegener, 1995, 1). With the private automobile being a highly flexible and fast mode of travel, the need for a close spatial association between complementary land uses declined.
offer several benefits, such as quiet neighbourhoods and larger homes and lots, the outward and exclusionary growth associated with these areas has several negative repercussions. These include increases in the number and length of automobile trips, congestion, noise pollution, automobile energy consumption and emissions, and the permanent transformation of natural and farmland to urban use (Carley, 1992, 207; Wegener, 1995, 1). Olson (1991, 253) argues that the dispersion and separation of activities in an urban area lead to an increase in its metabolic rate due to the fact that"... continuous inputs ofenergy are required to cover the greater distances". As a result, dispersed settlements with a high degree of separation between different activities consume greater amounts of energy and generate more waste (i.e., emissions). This problem is particularly acute in Canadian cities as approximately 50% of the energy used by the average Canadian household is expended while driving an automobile (Olson, 1991,254).
Research indicates that improvements in transportation technology can have a dramatic impact in reducing automobile fuel consumption and emissions (Kanaroglou and Anderson, 1997). It has been argued, however, that technological fixes alone will not be sufficient for reaching levels of emissions that are deemed sustainable (Carley, 1992,208). Improvements in technology must be supported by changes in human behaviour (i.e., reduced use of the private automobile) and government policy initiatives (e.g., development of efficient public transportation, fuel taxes, land use planning) that facilitate this behavioural change. One strategy advocated by urban researchers and planners is the reorganisation of urban activities such that the structure of modem cities more closely resembles that of 19th-century cities (i.e., higher densities and mixed land uses). While there is consensus that, other things being equal, dispersed settlements consume more energy than compact ones, the same level of unanimity does not exist with respect to the particular urban form' (e.g., concentric, radial,
Types ofurban form include concentric, with a single, central commercial district; multi-nucleated, with several commercial nodes scattered throughout the metropolitan area;
and radial with development concentrated along transport
multi-nucleated) that is the most efficient at decreasing the levels of energy use and emissions. Andersonet al. (1996) and Breheny (1992) provide comprehensive reviews of studies addressing these issues. Depending on their methodological approach these studies can be classified as either empirical or simulation.
Perhaps the best known empirical study of urban form / transportation relations is by Newman and Kenworthy (1989) whose cross-sectional analysis of32 world cities, 10 of which are in the United States, shows a strong relationship between energy consumption and population and employment densities. The remedy they propose is to encourage urban areas to implement development strategies that focus on the reurbanisation of established areas instead of continuing to expand into peripheral regions. This strategy, in tum, will facilitate the development ofefficient transit systems and promote non-motorised forms of commuting.
Gordon and Richardson (1989, 342-343) are sceptical of the results and suggestions of Newman and Kenworthy. They present data which show that commuting times are shorter in decentralised cities. This relationship, they suggest, is the direct result of the considerable amount of commuting that takes . place between and within suburbs, which reduces congestion on roads that lead to the city centre. They advocate the development of multi-nucleated cities and the implementation of a fuel tax as more practical strategies than those proposed by Newman and Kenworthy. Gordonet
at.
(1991, 418) provide support to these arguments by demonstrating that average commuting times in 18 of the 20 largest American cities decreased between 1980 and 1985. This finding, they suggest, confirms that firms and commuters are making locational adjustments that are resulting in shorter work trips and less congestion. Thus, they call for municipal governments to facilitate the decentralisation process by loosening restrictions on land use (e.g., zoning by-laws).Banisteret
at.
(1997) and Cervero (1996) both present results that support the arguments of Newman and Kenworthy. Banister etat.
(1997)analyse the energy efficiency of six urban settlements of varying sizes in the United Kingdom and the Netherlands. Cervero (1996) analyses data
for households in eleven American cities in order to determine the relationship between land use organisation at the neighbourhood level (i.e., mixed/segregated) and the commuting patterns of neighbourhood households. Banisteret ai. (1997) show that higher densities and mixed land uses can both lead to decreases in energy use, while Cervero (1996) demonstrates that the likelihood of non-motorised commuting increases with higher urban densities and the presence ofnon-residential activities in a given neighbourhood.
Additional evidence has been generated using urban simulation models.' Two of the most notable studies are those presented in Rickaby (1987; 1991) and Wegener (1995). The study conducted by Rickaby (1987; 1991) involved the creation of a fictitious 'archetypal' city by combining data that were collected for twenty British cities. Using an urban simulation model called TRANUS (see de la Barra, 1989), Rickaby simulated six different growth patterns of the archetypal city for a 25-year period. The overall conclusion was that while the concentrated land use pattern is the most energy efficient, it is also the most costly due to increases in congestion. As a result, Rickaby advocates an urban form where a cluster of nodal developments are strategically located around the existing city.
Wegener (1995)used his model for the city of Dortmund to analyse scenarios of changes in the cost and speed of travel. The results show that modal choices and trip lengths are both sensitive to these types of changes. He concludes that restructuring the spatial organisation of cities is not the only alternative for achieving reductions in the use of the private automobile, but he cautions that these results may not be applicable to more dispersed cities that are not adequately served by public transportation (e.g., North American cities). This brief review demonstrates that what is known about the relationship between urban form and transportation energy use and emissions is ambiguous. Although it is clear that the relationship does exist, it is not clear which urban form is the most environmentally benign and
2
Simulation studies differ from empirical studies in that they base their conclusions on the results of projections by simulation models rather than direct observation of past trends.
energy efficient. To some extend the simulation results presented in the following sections of this paper reinforce the ambiguous nature of the urban form-transportation relationship. However, our results will demonstrate that in simulation studies the way scenarios are defined could be the key factor contributing to ambiguous results.
3. METHODOLOGY
The analysis presented in this paper has been conducted using an urban simulation model called IMULATE3(Integrated Model of Urban LAnd use and Transportation for Environmental analysis), which has been designed to simulate the spatial assignment ofautomobile trips for the morning rush hour period in the Census Metropolitan Area (CMA) of Hamilton, which is located approximately 100 kilometres south-west ofthe city ofToronto (Figure 1). In this model, the number as well as the origin/destination of trips are conditional on the spatial configuration of land uses. One of the purposes of the model is to estimate the levels of energy demand and environmental emissions generated by these automobile trips.
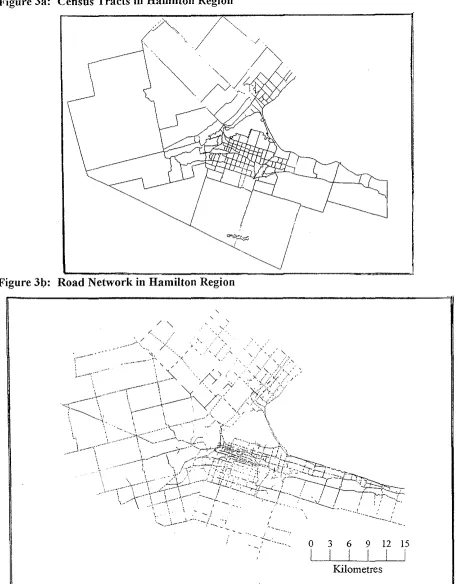
The general structure ofIMULATE is outlined . in Figure 2. The core procedures ofIMULATE are contained within four interrelated submodels: POPMOB, TRANDEM, TRAFFIC ASSIGNMENT and TRAVEL TIMES. The first module, POPMOB, simulates the process of residential mobility as well as the performance of the housing market. The second module, TRANDEM, uses the results of POPMOB to generate estimates of inter-zonal automobile trips for work, school and discretionary purposes. The variables used by the first two modules are all defined for the set of census tracts contained within the Hamilton CMA (see Figure 3a). The TRAFFIC ASSIGNMENT submodel allocates the estimates ofinter-zonal transportation demand to the road network ofHamilton-Wentworth. Based on this assignment of automobile trips and the resultant congestion effects, inter-zonal travel times are calculated by the module TRAVEL TIMES. TRANDEM, TRAFFIC ASSIGNMENT and
3
IMULATE has been developed at the McMaster University
Figure I: Hamilton-Wentworth, Burlington and Grimsby
Burlington
Flamborough
Dundas
Hamilton
Ancaster
Glanbrook
N
W+E
S
Grimsby
U.S.A.
Ontario
U.S.A.
o 100 200 300 @
o 5
Kilometers
'0 '5 20
26
Figure 2: General Structure of lMULATE
POPMOB
..
,;~
TRANDEM
..
~YES
~CONVERGENCE?
,.
END
NO
..
,;TRAFFIC
~EMISSIONS:
ASSIGNMENT
,.
MOBILE5C
..
~TRAVEL
-
FUEL CONSUMPTION:
-
TIMES
,
ARFCOM
TRAVEL TIMES work together in an iterative fashion until a network equilibrium (convergence)
has been achieved. Once convergence is
established, the EMISSIONS and FUEL
CONSUMPTION modules are engaged to
estimate the levels of emissions and fuel consumption that correspond to the network equilibrium.
To begin the simulation of a given scenario, IMULATE requires four types of data. First an initial distribution ofhouseholds and employment over the census tracts of the Hamilton CMA is obtained from the 1986 Census of Canada (Statistics Canada, 1986). Thus, 1986 is the starting point in time for all the simulations. Second, the 'place of residence/place of work' (PORPOW) and 'place of residence/place of school' (PORPOS) matrices, which are sets of conditional probabilities, WN, that a worker (student) living in zone i works (attends school) in zonej are obtained from a travel survey' Third, information is required relating to the number of new households (or dwelling units) added to each census tract between time t and t+1.To simulate the future impacts ofa given scenario, multi-zonal population projections are used to estimate the distribution of new households for the year(s) of interest. The final requirement is a spatial database representing the Hamilton road network, which has been constructed within a GIS package called Transcad (see Figure 3b). All of the IMULATE modules have been interfaced with Transcad so that the spatial data generated by the model can be displayed in graphical form.
Using the data pertaining to the initial distribution of households and the number of new households added to each zone, the POPMOB submodel estimates changes in the spatial distribution of households between times t and
t+I. In addition to intra-urban migration,
POPMOB also simulates the processes of
household formation and dissolution. Once these
changes are simulated, the PORPOW and
PORPOS matrices are updated based on the new distribution of households.
4
The initial PORPOW and PORPOS matrices were defined withinformation on inter-zonal travel obtained from the 1986
Transportation Tomorrow Survey (see Transportation
TomOITOWSurvey, 1988).
The TRANDEM submodel uses the PORPOW and PORPOS matrices to calculate the total number of trips, Tij' between a given origin zone i and a
given destination zonej. This is accomplished by multiplying the number of workers and students in each zone by the probabilities defined in PORPOW
and PORPOS. In order to produce a crude
representation of discretionary trips, TRANDEM employs the use of a simple linear regression model to estimate trip generation and a doubly-constrained gravity model to distribute these trips between zones.' The final task of the TRANDEM module is to sub-divide Tij'with the use of a multinomiallogit
model, into four modes: driver, passenger, transit and walklbike. The modal split routine is based on inter-zonal free flow travel times and socio-economic attributes of the population.
The total number of driver trips between zones
i and j, estimated by the modal split routine, represents the number of automobiles that must be
assigned to the network by the TRAFFIC
ASSIGNMENT model. These trips are allocated to specific sets of links on the Hamilton road network with the use of a stochastic user equilibrium
assignment procedure (See Sheffi, 1985). Once this equilibrium is achieved, the TRAVEL TIMES module is engaged to estimate a new set of inter-zonal automobile travel times (ty), which are calculated based on estimates of link speeds. This new matrix of travel times is passed back to TRANDEM and is used to generate a new matrix of car trips. This iterative process continues until travel times do not change between iterations, at which point convergence is considered to have been achieved.
When a convergence is reached, IMULATE calculates a measure of accessibility for households living in zone i (I,), which depends upon the equilibrium values of tij weighted by Wjv. I,
represents the transportation utility that an individual derives from living in zone i and is used by POPMOB in the next time period as a measure of mobility potential for households ini.
IMULATE has been linked with two
environmental models, MOBILE5C and ARFCOM,
Andersonet al. (1994) justifY the useof thissimple model
Figure 4: Estimated Housing Unit Potential by Planning District
RuroI
Source: Hamilton-Wentworth (1990).
700 to 2700
300 to 699
50 to 299
1 to 49
zero
._---_._---_.--_._
...._
which are respectively used to generate link specific estimates of automobile emissions (i.e., carbon monoxide (CO), hydrocarbons (HC) and nitrogen oxide (NO,)) and fuel consumption. These models base their estimates on the predicted number of flows and congested travel speeds for the individual links in the Hamilton road network. Both models can be employed once a network equilibrium is reached.
4. SCENARIOS AND DATA REQUIREMENTS
The starting point for all simulations is the urban form of the Hamilton CMA in the year 1986. Scenarios simulate growth patterns that give rise to different types of urban form to the year 2021. All the scenarios have three common characteristics. First, they all project the same level ofpopulation growth between the years 1986 and 2021; the difference between the scenarios is the spatial distribution ofthis growth. Second, the development policies implied by each of the scenarios are assumed to take affect at the end of the first simulation period (i.e., in 1991). This measure ensures that all of the scenarios share the same starting point. Third, to isolate the effects of changes in urban form, it is necessary to hold the other variables in the model constant; these variables include the ro,ad network and the emissions factors used by MOBILE5C.
Four alternative growth strategies, described below, have been defined and simulated within the IMULATE model: a base scenario, a compact
alternative and two scenarios formulti-nucleated
urban forms. The two multi-nucleated schemes will be used to demonstrate the impact that scenario definition can have on simulation results.
4.1 Base Scenario
The base scenario represents the growth pattern that would occur if the status quo is projected into the future. It represents the most dispersed growth strategy in which the vast majority of urban expansion occurs in the peripheral areas ofthe region. Construction of the scenario required two types of information. The first were the population projections for each of the simulation time intervals, provided by the Regional Municipality of Hamilton-Wentworth (Appendix I). The projected population figures were transformed into estimates of the number of
households by dividing the population by projections ofaverage household size for the region, also provided by the regional government. The number ofnew householdsH(Llt)added in the study area within each simulation periodLltwas calculated by subtracting the households in the beginning ofthe time period from those in the end.
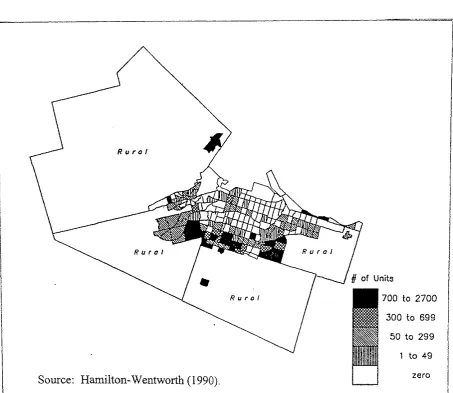
The second type of information required was estimates of the potential of census tracts for development of new housing units. The Regional Municipality of Hamilton-Wentworth provided the relevant data, along with the map in Figure 4 which shows the approximate number ofnew housing units that can be constructed within each planning district in the region. Estimates of housing unit potential by census tract were obtained by aggregating the planning districts to the census tract level. The proportion P(x) of the total regional housing unit potential that can be located in census tract x is used to allocate the regional increase in households to census tract x:
H(x;Llt)= P(x)
*
H(Llt), (I) where H(x;Llt)is the number of new households in census tractx within the time periodLlt.Thus, the distribution of unit potential displayed in Figure 4 represents the growth pattern modelled in the base scenano.4.2 Compact Scenario
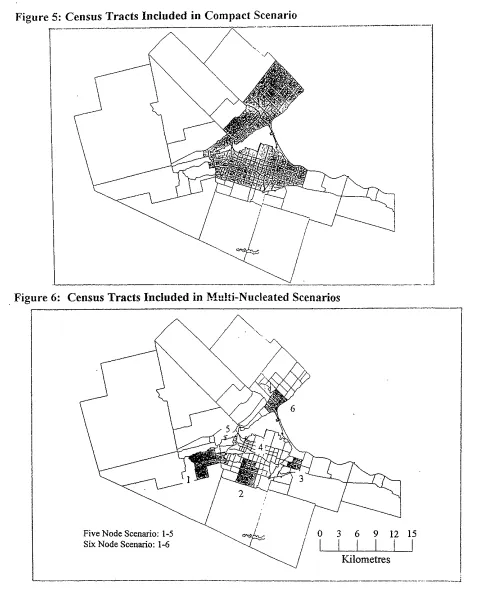
The compact scenario has been designed to represent the most dense urban form of the four alternatives. This growth strategy calls for a moratorium on future development in peripheral areas at the end of 1991 and, as a result, all of the new households that were designated for these areas in the base scenario had to be redistributed as infill development in the established sections of the city, as shown in Figure 5. The redistribution was done with the help of equation (I) by redefiningP(x)over the established census tracts only.
Another important difference from the base case scenario is that the compact scenario simulates a higher level of mixed land uses. This is achieved by adjusting the Place Of Residence Place Of Work (PORPOW) matrix to reflect a closer correspondence between places of residence and employment.6
6
This adjustment involved several steps. First, a diagonal matrix
Figure 3a: Census Tracts in Hamilton Region
Figure 31;>: Road Network in Hamilton Region
/,
' "
--:--.
0 3 6 9 12 15
-'
I
I
I
I
I
i
Kilometres
Figure 5: Census Tracts Included in Compact Scenario
" - - -
---~---_Figure6: Census Tracts Included in Multi-Nucleated Scenarios
Five Node Scenario: 1~5
Six Node Scenario: 1-6
i
/
/ 0 3 6 9 12 15
LLLLLJ
Kilometres
32
4.3 Multi-Nucleated Scenarios
Two multi-nucleated alternatives were defined in which certain areas ofthe region (i.e., groups of census tracts) were targeted for development in 1991. The first of these scenarios limits growth to five nucleations while the second limits growth to six nodes as shown in Figure 6. These nucleations are concentrated around features that promote reductions in automobile travel, such as the downtown core, major malls and important places of employment. The densities of these two scenarios fall between those of the base and compact scenarios, as the nodal developments include a combination of established and peripheral census tracts.
The adjustments made to the base scenario, in order to define the two multi-nucleated alternatives, are very similar to the modifications discussed for the compact scenario. The first modification involved redistributing the new households originally assigned to non-nodal census tracts to the nodal zones. This procedure employed the use of equation I, withP(x)being defined for the nodal census tracts only. The second adjustment was the generation of a new PORPOW matrix to represent the fact that all of the new development within the region is now focused on a small number of segregated zones. Similar to the compact scenario, the new PORPOW matrix includes a closer correspondence between places ofresidence and employment.
defined, whose diagonal elements represent the increase in
the probabilityof livingand working in the same zone. This increase was based on each census tract's proportion of the
total new households. Second, another matrix (SUM) was created by adding the CHANGE and PORPOW matrices together. The third, and final, step in this adjustment process involved nonnalising matrix SUM so that the probabilities
would add up to one. This procedure was accomplishedby summing across each row of the SUM matrix and then
dividing each element of a rowby the row total. The end result was a new PORPOW matrix which incorporates a
higher degree of association between placesofresidenceand work.
5. RESULTS
Detailed results of the four scenarios can be found in Appendix II. All ofthe scenarios start from the same point in 1991, after which the policies of the compact and multi-nucleated alternatives come into effect. The percentage changes reported in the last column of Appendix II are all defined over the same 1991 values and, therefore, these changes provide measures ofthe relative differences between the alternative growth strategies. For convenience, the percentage changes of the key variables have been summarised in Table 1.
Table 1 reveals the following general trends. First, the base scenario generated the largest increases for all of the variables. Therefore, as expected, the most dispersed pattern ofurban growth results in the highest levels of emissions and fuel consumption. Second, the compact and nodal growth patterns produce reductions in all of the variables compared to the results of the base scenario. A comparison of these three scenarios shows the following: the compact alternative generates the smallest changes in congestion and nitrogen oxide, the five node alternative produces the lowest levels of hydrocarbons, carbon monoxide and fuel consumption, and the six node growth pattern is the most wasteful of these three options in terms of emissions and fuel use.
These results demonstrate three importantpoints. First, urban form can and does have an impact on automobile emissions and fuel consumption. Paired sample t-tests over the network links reinforce this assertion as indicated in Table 2. The t-test results show that, with the exception of a few instances, the alternative growth patterns produce outcomes for the year 2021 which differ by statistically significant amounts.
Second, there is ambiguity surrounding the issue of which urban form is the most effective at achieving reductions in emissions and fuel consumption. For some variables the compact scenario achieved the best results while for others the most effective option was the five node alternative. The uncertainty in these results is heightened by those ofthe paired sample t-tests. For several of the variables (e.g. cHC, cCO and Fuel), the estimates of the compact scenario and the nodal options do not differ by statistically significant
Table 1: Percentage Changes in Selected Variables, 1991-2021
Avg.
Scenario VKT" VMTt Congestion* cHq cNO,:t: cCO~ Fuel
Base 40.76 92.71 40.00 92.93 42.35 95.85 67.92
Compact 28.07 76.57 26.67 78.41 32.51 81.34 57.33
5 Node 29.95 69.66 33.33 76.66 34.89 78.98 51.54
6 Node 30.75 73.24 31.67 81.87 36.11 84.55 59.04
" VKT refers to total "vehIcle kIlometres travelled". t VMT refers to total "vehicle minutes travelled".
* Congestion measured as a ratio between link volume and link capacity.
~ The prefix "c" represents the word "congested". levels. Therefore, it is not possible to draw conclusions which assess the effectiveness of a particular urban form in reducing the levels of automobile emissions and fuel consumption.Itcan only be stated that, for the Hamilton (CMA) the compact urban form leads to congestion and nitrogen oxide levels which are significantly lower than the magnitudes of these variables in the five node scenario, while the levels of hydrocarbons, carbon monoxide and fuel consumption in the five node scenario are not significantly lower than the estimates of these same variables in the compact
scenario.
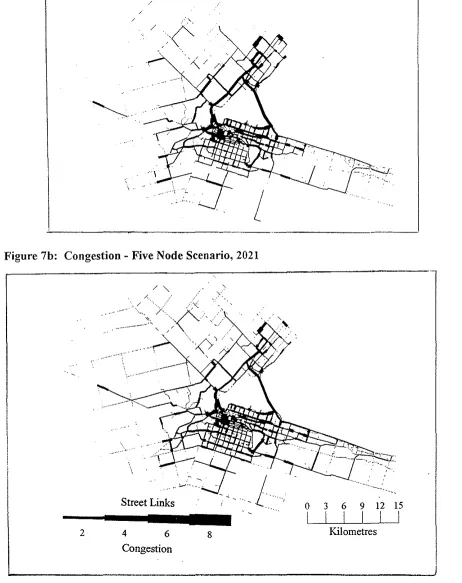
This statement prompts an interesting question: Why are the levels of all the variables not minimised under the same scenario? Since higher levels of congestion result in speed reductions and more idle automobiles, two conditions which tend to increase emissions and fuel usage, it is intuitive to conclude that the scenario which generates the highest (lowest) level of congestion will also result in the highest (lowest) estimates of emissions and fuel consumption. However, as the figures in Table I indicate, this general rule does not always hold.
First, consider the results for the two multi-nucleated urban forms. The five node scenario generates a higher congestion level but lower estimates ofemissions and fuel consumption. This situation occurs because, compared to the five node urban form, the six node scenario is more dispersed and, as a result, leads to longer automobile trips in terms of distance (VKT) and
34
minutes (VMT) travelled.
Table 2: Results of t-Tests for Paired SamplesA
Variable Scenario 1 Scenario 2 Degrees of Freedom tValue
Congestion Base Compact 1524 13.98§
Base 5 Node 1524 9.44§
Base 6 Node 1524 9.95§
Compact 5 Node 1524 -6.87§
Compact 6 Node 1524 -7.78§
5 Node 6 Node 1524 0.99*
cHC Base Compact 1524 5.50§
Base 5 Node 1524 6.40§
Base 6Node 1524 5.86§
Compact 5 Node 1524 0.47*
Compact 6 Node 1524 -1.25*
5 Node 6 Node 1524 -3.50§
cNOx Base Compact 1524 1O.66§
Base 5 Node 1524 8.44§
Base 6 Node 1524 7.93§
Compact 5 Node 1524 -2.18t
Compact 6 Node 1524 -4.33§
5 Node 6 Node 1524 -2.64§
cCO Base Compact 1524 5.14§
Base 5 Node 1524 6.20§
Base 6 Node 1524 5.63§
Compact 5 Node 1524 0.58*
Compact 6 Node 1524 -1.07*
5 Node 6 Node 1524 -3.49§
Fuel Base Compact 1524 4.34§
Base 5 Node 1524 6.52§
Base 6 Node 1524 2.80§
Compact 5 Node 1524 1.53*
Compact 6 Node 1524 -0.45*
5 Node 6 Node 1524 -2.43t
1\ Based on results for 2021; § SIgmficant at the 99% confidence level; t Slgmficantat the 95% confidence level, * Notslgmficant.
Figure 7a: Cougestion - Compact Scenario, 2021
....\
i
Figure 7b: Congestion - Five Node Scenario, 2021
/
"
36
2
\
Street Links
4 6
Congestion
8
o
3 6 9 12 15corresponding decrease in speed. As a result, the estimates of fuel usage and emissions (i.e., cHC and cCO) are higher in the compact scenario.
The third issue that the results in Table I demonstrate is the impact ofscenario definition. In the case of urban form, this problem involves the spatial distribution of urban growth (i.e., the sections of a city that will be developed and the intensities of these developments). The effect of this factor can be seen through an examination of the results produced by the two multi-nucleated scenarios. Although these two scenarios represent the same general urban form, they have been defined differently and, as a result, generate estimates of fuel consumption and emissions that deviate from each other significantly (see Table 2). The six-node multi-nucleated urban form is, with the exception of the base scenario, the least effective growth pattern, while for the five-node alternative with respect to most of the measures used, the opposite is true. This illustrates that the way in which a particular scenario is defined can substantially influence conclusions drawn with respect to the effectiveness of different urban forms in reducing energy consumption and emission levels. For example, if the analysis presented above did not include the results of the five node scenario, a very different conclusion would have been derived.
The preceding analysis has shown that urban development strategies could be used for achieving reductions in automobile fuel consumption and emissions. However, the results of the four simulations reinforce the ambiguous nature of these changes under alternative policy initiatives. This ambiguity partially stems from the issue of scenario definition. As illustrated above, the way in which a particular scenario is constrncted can significantly alter the outcome of a simulation.
6. CONCLUSIONS
As the twentieth century comes to end, urban planners have started to realise that policies involving changes in urban form can play a significant role in strategies designed to fulfil the environmental needs ofthe near and distant future. Urban morphologies that allow for decreases in society's dependence on the private automobile
(i.e., dense settlements with mixed land uses) also lead to significant reductions in energy use and emissions levels. However, as the results in thiS' paper indicate, research efforts have not been able to identify an ideal urban form to which all cities should aspire. Thus, in order to make informed decisions about the future growth patterns of their cities, planners must carefully consider the likely results of alternative urban structures. In this regard, urban simulation models can be extremely useful in planning decisions.
Urban simulation models afford decision makers with the opportnnity to isolate the future impacts of growth policy strategies, something that is impossible to achieve otherwise. The information gained from simulations can then be used to help determine which urban form is the most effective at achieving policy objectives, conditional on the economic and political realities of the local government. When decisions of this nature are being made, simulation models are not decision making 'substitutes'. They are tools that provide policy makers with information to be used in the decision process. Also, users of simulation models should recognise that these analytical tools have several limitations, one of which is scenario definition. The research presented above demonstrates the large impact that this problem can have on simulation results. Therefore, to reduce the chance of making a spurious conclusion, the user of a simulation model should consider several different formulations ofthe same scenano.
Urban simulation models provide analysts with large volumes of detailed data which are already being used effectively in decision making. However, we should not lose sight of the fact that these models have a number of limitations. By gaining a thorough understanding of these shortcomings, those who employ the services of urban simulation models will be able to make better use of a valuable tool for policy analysis.
REFERENCES
Anderson, W.P., P.S. Kanaroglou and E.J. Miller
(1994)Integrated land use and transportation modelfor energy and environmental analysis: a report on design and implementation.Final Report submitted to the Ministry of Energy and the Environment of Ontario.
Anderson, W.P., P.S. Kanaroglou and E.J. Miller (1996) 'Urban Form, Energy and the Environment: A Review of Issues, Evidence and Policy,' Urban Studies 33:7-35.
Banister, D., S. Watson and C. Wood (1997) 'Sustainable Cities: Transport, Energy, and Urban Form,' Environment and Planning B: Planning and Design 24: 125-143.
Bourne, L.S. (1991) 'Addressing the Canadian City: Contemporary Perspectives, Trends, and Issues,' in T. Bunting and P. Filion (ed.) Canadian Cities in Transition (Toronto: Oxford University Press) pp.25-44.
Breheny, M.J. (1992) 'The Contradictions of the Compact City: A Review,' in M.J. Breheny (ed.) Sustainable Development and Urban Form(London: Pion) pp.138-59.
Carley, M. (1992) 'Settlement Trends in the Crisis of Automobility,' Futures24:206-18.
Cervero, R. (1996) 'Mixed Land-Uses and Commuting: Evidence from the American Housing Survey,' Transportation Research A 30:361-77.
de la Barra, T. (1989) Integrated Land Use and Transport Modelling: Decision Chains and Hierarchies (Cambridge: Cambridge University Press).
Gordon, P. and H.W. Richardson (1989) 'Gasoline Consumption and Cities: a Reply,' Journal oftheAmerican Planning Association 55:342-6.
Gordon, P., H.W. Richardson and M-J. Jun (1991) 'The Commuting Paradox: Evidence from the Top Twenty,' Journal of the American Planning Association57:416-20.
Hamilton-Wentworth, The Regional Municipality of (1990) Vacant Urban ReSidential Land (Hamilton: Planning and Development Department).
Hamilton-Wentworth, The Regional Municipality of (1992) Hamilton-Wentworth: Population, Household and Labour Force Projections,
38
1991-2021 (Hamilton: Planning and Development Department).
Hamilton-Wentworth, The Regional Municipality' of (1996) Hamilton-Wentworth Housing Statement, 1995 (Hamilton: Environment Department).
Kanaroglou, P.S. and W.P. Anderson (1997) 'Emissions from Mobile Sources in Urban Areas: An Integrated and Transportation and Land-Use Approach,' Proceedings,Fifth Conference of Environmental Science and Technology, Molyvos, Lesvos, Greece. Kanaroglou, P.S., R. South and W.P. Anderson
(1996) Automotive Emissions in Hamilton-Wentworth 1991-2021: Results from an Integrated Urban Simulation Model. Unpublished manuscript prepared for the Regional Municipality of Hamilton-Wentworth (Hamilton: McMaster University Institute for Energy Studies).
Kelly, E.D. (1994) 'The Transportation Land-Use Link,' Journal ofPlanning Literature 9: 129-45.
Lewis, R. (1991) 'The Segregated City: Class Residential Patterns and the Development of Industrial Districts in Montreal, 1861 and
1901,'Journal ofUrban History 17:123-152.
Newman, P.W.G. and J.R. Kenworthy (1989) 'Gasoline Consumption and Cities: a Comparison of U.S. Cities with a Global Survey,' Journal of the American Planning Association55:24-37.
Olson, S. (1991) 'The Evolution of Metropolitan Form,'in T. Bunting and P. Filion (ed.) Canadian Cities in Transition (Toronto: Oxford University Press) pp.240-62.
Rickaby, P.A. (1991) 'Energy and Urban Development in an Archetypal English Town,' Environment and Planning B: Planning and Design 18:153-76.
Rickaby, P.A. (1987) 'Six Settlement Patterns Compared,' Environment and Planning B: Planning and Design 14: 193-223.
Scott, D.M. (1996) IMULATE: An Integrated Land-Use and Transportation Model for the Hamilton CMA, Reference Manual Unpublished Manuscript (Hamilton: McMaster University Geography Department). Sheffi, Yosef (1985) Urban Transportation
Statistics Canada (1986) 'Population and Dwelling Counts: Provinces and Territories,' Census of Canada (Ottawa: Minister of Supply and Services).
Transportation Tomorrow Survey (1988) An Overview of Travel Characteristics in the Greater Toronto Area. Prepared for the Toronto Area Transportation Planning Data Collection Steering Committee.
Wegener, M.(1995)'Reduction ofCO, Emissions of Transport by Reorganisation of Urban Activities,' in Y. Hayashi and lR. Roy (ed;} Transport, Land Use and the Environment (Dordrecht: Kluwer Academic).
Yeates, M. (1990) The North American City, 4th
edition (New York: Harper and Row).
APPENDIX I: POPULATION AND HOUSEHOLD DATA
Variable 1991 2001 2011 2021
Population 592560 639960 674134 708258
Avg. Household Size 2.67 2.60 2.52 2.44
Total Households 221849 246138 268045 290389
Source: Hamilton-Wentworth(1992; 1996).
APPENDIX II: RESULTS OF SCENARIOS
%
Scenario Variable 1991 2001 2011 2021 Change
1991-2021
Base VKP 815644.42 938215.84 1043000.91 1148090.75 40.76
VMTt 3923296.27 4962997.42 6113972.70 7560733.32 92.71
Avg. Link Flows 1882.96 2149.34 2384.14 2623.04 39.30
Avg. Congestion' 0.60 0.68 0.76 0.84 40.00
cHq(glkm) 7375559.12 9401310.47 11609739.53 14229471.13 92.93
cNO,t(g/km) 6547476.21 7480394.28 8371854.87 9320639.45 42.35
cCOt(g/km) 79663143.03 101918448.41 126520014.71 156022064.82 95.85
Avg. Speed 33.29 32.17 31.11 30.06 -9.70
(kmJh)
Fuel(llkm) 291886.59 349640.06 416079.55 490148.49 67.92
Compact VKT 815644.42 899466.12 971289.52 1044620.65 28.07
VMT 3923296.27 4807055.95 5717124.12 6927518.91 76.57
Avg. Link Flows 1882.96 2081.24 2255.53 2437.26 29.44
Avg. Congestion 0.60 0.66 0.71 0.76 26.67
Scenario Variable 1991 2001 2011 2021 % Change
1991-2021
Compact eNO, 6547476.21 7264711.77 7942319.80 8675850.15 32.51
eCO 79663143.03 99312414.04 120272291.44 144458972.02 81.34
Avg. Speed 33.29 32.49 31.81 31.12 -6.52
Fuel 291886.59 340185.00 398444.78 459226.59 57.33
Multi- VKT 815644.42 905875.81 984289.24 1059950.46 29.95
Nucleated VMT 3923296.27 4769454.61 5631525.69 6656323.69 69.66
(5 Nodes) Avg. Link Flows 1882.96 2104.32 2301.75 2498.17 32.67
Avg. Congestion 0.60 0.67 0.73 0.80 33.33
cHC 7375559.12 9197633.76 11049814.67 1302970 1.11 76.66
eNO, 6547476.21 7326422.54 8070212.80 8831771.86 34.89
cCO 79663141.03 99764806.13 120377797.10 142579346.59 78.98
Avg. Speed 33.29 32.39 31.56 30.70 -7.78
Fuel 291886.59 337612.96 390512.71 442328.89 51.54
Multi- VKT 815644.42 906780.79 987732.76 1066444.61 30.75
Nucleated VMT 3923296.27 4788185.36 5696513.80 6796798.84 73.24
(6 Nodes) Avg. Link Flows 1882.96 2106.06 2308.56 2511.93 33.40
Avg. Congestion 0.60 0.67 0.73 0.79 31.67
cHC 7375559.12 9230305.98 11221111.02 13414088.57 81.87
eNO, 6547476.21 73332307.35 8107711.05 8911720.86 36.11
cCO 79663143.03 100127404.01 122338837.18 147015468.77 84.55
Avg. Speed 33.29 32.39 31.56 30.70 -7.78
Fuel 291886.59 339886.84 395835.22 464203.58 59.04
A VKT refers to total "vehicle kilometres travelled".