1
The Effects of Positive End-Expiratory
Pressure on the Position and
Function of the Human Diaphragm
Master Thesis
Judith Elshof
July 2018
Commitee:
Preface
Beste lezer,
Voor u ligt mijn afstudeerthesis van de master Technical Medicine, richting Medical Sensing & Stimulation, aan de Universiteit Twente. De afgelopen tien maanden heb ik stage gelopen op de afdeling Intensive Care Volwassenen in het VU Medisch Centrum te Amsterdam waar ik met veel plezier aan dit afstudeeronder-zoek heb gewerkt. Vele mensen hebben bijgedragen aan de totstandkoming van deze thesis, die ik bij deze graag zou willen bedanken.
Allereerst wil ik mijn medisch begeleider, Leo Heunks, bedanken voor alle mogelijkheden die ik heb gekregen. Ik vond de begeleiding ontzettend fijn; je toonde veel vertrouwen in me en je deur stond altijd voor me open. Ook wil ik graag Annemijn Jonkman bedanken voor haar begeleiding. Je nam altijd de tijd voor me en het was erg fijn om met een mede-TG’er te kunnen overleggen als ik vast zat; ik kwam altijd met nieuwe ideeën terug. Verder zou ik graag Michel van Putten bedanken voor de technische begeleiding. Daarnaast wil ik graag Bregje Hessink-Sweep bedanken als procesbegeleider. Al twee jaar ben je een luisterend oor; bedankt voor je adviezen. Tevens wil ik Anique Bellos-Grob bedanken als buitenlid van mijn commissie.
Naast mijn directe begeleiders wil ik Heder de Vries en Diana Jansen bedanken voor het meedenken over de opzet van het protocol en voor hun hulp tijdens het uitvoeren van de metingen. Ook zou ik graag Tim Marcus willen bedanken. Uw expertise is van grote waarde geweest voor het opstellen en uitvoeren van het MRI protocol. Daarnaast zou ik graag Coen Ottenheijm en Marloes van den Berg willen bedanken; jullie opmerkingen vanuit de fysiologische hoek waren erg waardevol. Verder wil ik graag alle mensen op de afdeling en alle studenten die de afgelopen tien maanden in het lab hebben gezeten bedanken voor de gezellige tijd; ik heb me erg met jullie vermaakt.
Als laatste zou ik graag mijn familie en vrienden willen bedanken voor hun belangstelling en de noodza-kelijke ontspanning. In het bijzonder mijn ouders: bedankt voor jullie steun. En natuurlijk Timon, bedankt voor je luisterend oor en relativering.
Ik hoop dat u deze thesis met veel plezier zult doorlezen; ik heb er de afgelopen tien maanden in ieder geval met veel plezier aan gewerkt.
Vriendelijke groet, Judith Elshof
List of Abbreviations
ARDS acute respiratory distress syndrome
ATP adenosine triphosphate
BMI body mass index
COR-Mid coronal mid plane
CT computer tomography
CV coefficient of variation
EAdi electrical activity of the diaphragm
ECG electrocardiography
EMG electromyography
FRC functional residual capacity
ICU intensive care unit
MRI magnetic resonance imaging
NIV non-invasive ventilation
NME neuromechanical efficiency
PEEP positive end-expiratory pressure
Pes esophageal pressure
Pga gastric pressure
SAG-L sagittal left plane
SAG-R sagittal right plane
SBT spontaneous breathing trial
SD standard deviation
Contents
Preface ii
List of Abbreviations iii
1 Introduction 1
2 Study Objectives 3
2.1 Primary objectives . . . 3
2.2 Secondary objectives . . . 3
3 Outline 4 4 Clinical Background 5 4.1 Respiration . . . 5
4.2 Mechanical ventilation . . . 5
4.3 Diaphragm . . . 6
4.4 Muscle physiology . . . 7
4.5 Diaphragm weakness . . . 8
4.5.1 Disuse atrophy . . . 9
4.5.2 Excessive loading . . . 9
5 Technical Background 10 5.1 Methods to assess the position of the diaphragm . . . 10
5.1.1 Ultrasonography . . . 10
5.1.2 Computer tomography . . . 10
5.1.3 Magnetic resonance imaging . . . 12
5.1.4 X-ray . . . 12
5.1.5 Fluoroscopy . . . 12
5.2 Methods to assess the function of the diaphragm . . . 12
5.2.1 Ultrasonography . . . 12
5.2.2 Maximal (sniff) maneuvers . . . 12
5.2.3 Transdiaphragmatic pressure . . . 13
5.2.4 Diaphragm electromyography . . . 14
5.2.5 Neuromechanical efficiency . . . 14
5.2.6 Stimulation of the phrenic nerves . . . 14
6 The Acute Effects of PEEP on the Diaphragm in Healthy Subjects 16 6.1 Introduction . . . 16
6.2 Methods . . . 16
CONTENTS v
6.2.1 Study design and population . . . 16
6.2.2 Part 1: Physiological study . . . 17
6.2.3 Part 2: MRI study . . . 18
6.2.4 Data analysis . . . 19
6.3 Results . . . 21
6.3.1 Effect of PEEP on diaphragm position and length . . . 21
6.3.2 Effect of PEEP on diaphragm function . . . 22
6.3.3 Effect of PEEP on respiratory pattern . . . 22
6.4 Discussion . . . 26
6.4.1 Effect of PEEP on diaphragm position and length . . . 26
6.4.2 Effect of PEEP on diaphragm function . . . 27
6.4.3 Effect of PEEP on respiratory pattern . . . 29
6.4.4 Clinical implications . . . 29
6.4.5 Study limitations . . . 29
7 The Effects of PEEP on the Position of the Diaphragm in ICU Patients 31 7.1 Introduction . . . 31
7.2 Methods . . . 31
7.3 Results . . . 31
7.4 Discussion . . . 32
8 The Effects of PEEP on the Function of the Diaphragm in ICU Patients 35 8.1 Introduction . . . 35
8.2 Methods . . . 35
8.2.1 Study population . . . 35
8.2.2 Study protocol . . . 36
8.2.3 Statistical analysis . . . 37
8.3 Discussion . . . 37
9 General Discussion 39
Bibliography 40
Appendix A Individual data of the subjects 46
1
|
Introduction
Critically ill patients admitted to the intensive care unit (ICU) rapidly develop diaphragm weakness.1 It is associated with adverse outcomes, including prolonged duration of mechanical ventilation and higher mor-tality.2 To prevent or treat diaphragm weakness, understanding of the underlying mechanisms is essential.
It has recently been suggested that positive end-expiratory pressure (PEEP) may contribute to diaphragm weakness.3 In mechanically ventilated patients, PEEP is used to prevent airway collapse and to maximize alveolar recruitment by preventing cyclic derecruitment during expiration.4 Especially in patients with acute respiratory distress syndrome, high levels of PEEP are needed to maintain oxygenation.5
As PEEP increases the end-expiratory lung volume, it is thought that the diaphragm moves caudally and shortens in the zone of apposition. Furthermore, it is hypothesized that this diaphragm shortening leads to a decrease in force generating capacity, since the diaphragm no longer operates on its optimum length in the force-length relation.6 Muscles are capable of adapting in response to a change in force generating capacity.7, 8 Therefore, the diaphragm shortening in response to mechanical ventilation with PEEP could be clinically relevant as the diaphragm is able to adapt structurally.
Lindqvist et al.3 are the first ones to study the effects of mechanical ventilation with PEEP on the diaphragm in both critically ill patients and rats. In both study populations, mechanical ventilation with PEEP led to a caudal displacement of the diaphragm. Furthermore, their study in rats showed that this displacement resulted in a reduced diaphragm muscle fiber length due to a reduction in the length of the individual sarcomeres, i.e. the smallest contractile units of a muscle fiber. After 18 hours, mechanical ventilation with PEEP led to adaptation of the diaphragm by absorbing sarcomeres in series; a mechanism referred to as longitudinal atrophy. Due to longitudinal atrophy, the sarcomeres are restored to their original, physiological length thereby optimizing the force-length relationship. For a schematic overview of these processes, see Figure 1.1A-C.
It is hypothesized that similar adaptation may occur in mechanically ventilated patients, especially if patients are ventilated for multiple days. This adaptation might lead to problems during a spontaneous breathing trial (SBT) since PEEP is abruptly removed. Consequently, the end-expiratory lung volume is reduced, which could lead to an overstretch of the newly-adapted diaphragm fibers. Stretched muscle fibers are not working at their optimal length on the force-length relation, thereby possibly contributing to diaphragm weakness, as depicted in Figure 1.1D.
The goal of this study is to evaluate the acute and long term effects of PEEP on the diaphragm position and function in humans. Accordingly, it is the first step towards understanding the role of PEEP on the diaphragm in mechanically ventilated ICU patients, hopefully leading to better understanding of diaphragm weakness in the ICU.
2 CHAPTER 1. INTRODUCTION
Normal, end-expiration
Long-term effect PEEP:
sarcomere absorption
Weaning trial, zero PEEP:
sarcomere length increase
Acute effect PEEP:
sarcomere length reduction
muscle length
FIGURE 7
A
D
C
B
sarcomere length
thick filament
thin filament
2
|
Study Objectives
2.1
Primary objectives
The primary goal of this proof-of-concept study is to evaluate the acute effects of PEEP on the position, length and contractility of the diaphragm in vivo. The hypothesis that mechanical ventilation with PEEP leads to a caudal displacement of the diaphragm is tested in both healthy subjects and in ICU patients. The hypothesized consequence of a decrease in length and force generating capacity is tested in healthy subjects by applying different levels of PEEP.
2.2
Secondary objectives
Throughout the study in healthy subjects, the effect of PEEP on tidal volume, respiratory rate, I:E ratio and minute volume is evaluated. Furthermore, a secondary objective is to evaluate the accuracy of ultrasound for measurements in diaphragm motion in comparison with magnetic resonance imaging.
3
|
Outline
This thesis focuses on the effects of PEEP on the diaphragm structure and function in vivo. In chap-ter 4, clinical background information is given to explain the basic physiology and anatomy to be able to understand the problem of diaphragm weakness in ICU patients. Methods to assess both the position and the function of the diaphragm are discussed in chapter 5. In chapter 6, the acute effect of PEEP on the diaphragm in healthy subjects are evaluated. The rationale and development of the clinical trial will be included in this chapter. Furthermore, preliminary data is shown and some trends are described. In chapter 7, the effect of PEEP on the position of the diaphragm in mechanically ventilated ICU patients is evaluated. This chapter is part of a recently published article in the American Journal of Respiratory and Critical Care Medicine (doi: 10.1164/rccm.201709-1917OC). The long-term effect of PEEP on the diaphragm in ICU patients is the subject of chapter 8. Due to the limited time of my internship, no patients are yet included in this study. Therefore, this chapter focuses on the rationale and study design to evaluate the effects of long term ventilation with PEEP. The last chapter, chapter 9, includes a general discussion of all what has been learned and future perspectives will be discussed.
4
|
Clinical Background
4.1
Respiration
The primary goal of the respiratory system is to exchange oxygen and carbon dioxide between the atmo-sphere and blood. The respiratory system can accommodate to changing metabolic demands of the body, which are reflected by changes in PaO2 , PaCO2 and pH. In this way, homeostasis can be achieved.9
Lung volume is determined by the interaction between the thoracic wall and the lungs. The lungs have the tendency to collapse, while the thoracic wall has the tendency to pull outwards (elastic recoil). If these opposing forces are equal, normal lung volume at end-expiration (functional residual capacity: FRC) is maintained. The intrapleural space is the space between the parietal and visceral pleura and serves as the interaction between the thoracic wall and lungs. The pressure in this space, the intrapleural pressure, is less than barometric pressure since both the lungs and the thoracic wall pull away from the space.9
The elastic recoil of the chest wall can be controlled using the muscles of respiration. The muscles of inspiration increase the elastic recoil of the thoracic wall by expanding the chest, thus making the intrapleural pressure more negative. The lungs passively expand due to the enhanced vacuum and thoracic volume increases. As a result, the alveolar pressure is decreased which leads to the inflow of air along the pressure gradient. Inspiration ends when the atmospheric and intra-alveolar pressures are equalized. The primary muscles of inspiration are the diaphragm and external intercostal muscles. The following accessory muscles can help during a forced inspiration: scalenes, sternocleidomastoids, neck and back muscles and the upper-respiratory-tract muscles. A quiet expiration is normally passive, which is ensured by the elastic recoil of the lung. During forced expiration, expiratory muscles come into play: abdominal muscles (internal and external oblique, recto-abdominal and transverse abdominal muscles), internal intercostal muscles and back muscles.9
4.2
Mechanical ventilation
When respiration is insufficient, critically ill patients may be in need for mechanical ventilation, for exam-ple due to pneumonia, neuromuscular disorders or an acute exacerbation of chronic obstructive pulmonary disease. The earliest mechanical ventilators were negative pressure ventilators which simulated the decreas-ing pleural pressure durdecreas-ing normal breathdecreas-ing. Nowadays, mechanical ventilation is done usdecreas-ing positive pressure ventilation in which a positive pressure is delivered to the airway. Many different modes of me-chanical ventilation exist, for example pressure-control, volume-control or pressure support ventilation. However, simply put, each mode is a modification of the manner in which positive pressure is given and the interplay between the mechanical ventilator and the patient’s own respiratory efforts.10
In almost all ventilated patients, PEEP is given to prevent airway collapse and to maximize alveolar recruitment by preventing cyclic derecruitment during expiration.4 However, too high values of PEEP create alveolar overdistention, so setting PEEP correctly is crucial. Various methods exist to select the ideal level of PEEP, for example, methods based on the compliance of the respiratory system, oxygenation values or volume-pressure curves.5 In clinical practice, levels of PEEP mostly vary between 5 and 15
6 CHAPTER 4. CLINICAL BACKGROUND
cmH2O. Taken the respiratory system’s compliance of a patient with acute respiratory distress syndrome
(ARDS) and a healthy subject into account, a PEEP of 10 cmH2O leads to a change in end-expiratory lung volume of approximately 380 ml and 1000 ml, respectively.11, 12
The process of discontinuing mechanical ventilation is called weaning. A common weaning strategy is to first set the mode of mechanical ventilation to a partially assisted mode. For example, it can be set to pressure support in which the patient triggers the ventilator and a certain level of pressure support is given at each inhalation. Secondly, the level of pressure support and PEEP is gradually decreased until low levels given (e.g. around 10 and 5 cmH2O, respectively) and a spontaneous breathing trial (SBT) can be considered. During a SBT, the patient is disconnected from the mechanical ventilator and the endotracheal tube is attached to a humidification filter to which additional oxygen can be connected. It is possible perform a SBT with PEEP, however, in daily clinical practice, a SBT is mostly performed without PEEP to prevent respiratory insufficiency after extubation.10
4.3
Diaphragm
The diaphragm is the main inspiratory muscle and forms a partition between the thoracic and abdominal cavity. During inspiration, the diaphragm contracts and the dome of the diaphragm moves in caudal direction and the dome flattens. This action increases the thoracic volume, which decreases the thoracic pressure after which air enters the lungs. The diaphragm is innervated by the phrenic nerves, originating from cervical nerves 3-5.9 The diaphragm consists of a peripheral muscular part which converges radially to the central tendon: a trefoil-shaped aponeurotic part. The muscular part of the diaphragm can be divided into three parts, although these parts are merged into one muscular sheet. The first part is the sternal part and is attached to the posterior parts of the xiphoid process. The second part is the costal part which forms the right and left domes of the diaphragm. The costal part of the diaphragm attaches to the internal surface of the inferior six costal ribs and their cartilage. The zone of apposition is the area of the diaphragm where it attaches to the rib cage. The lumbar parts form the so-called right and left crura which ascend to the central tendon. This part is attached to the three superior lumbar vertebrae and two ligaments.13 An inferior view of the diaphragm can be seen in Figure 4.1. The diaphragm consists of both slow-twitch and fast-twitch fibers. These fiber types are approximately equally present in the costal diaphragm in healthy subjects.14
4.4. MUSCLE PHYSIOLOGY 7
Figure 4.2: Schematic overview of a sarcomere16
4.4
Muscle physiology
Since this study focuses on the diaphragm, some basic physiology about muscles will follow. Each muscle fiber contains myofibrils, which consists of repeating units, called sarcomeres. In turn, these sarcomeres consist of smaller filaments called myofilaments, which come into two types: the thin and thick filaments. Thin filaments primarily consist of actin, while the thick filaments primarily consist of myosin, see Figure 4.2. Thin and thick filaments and its connections to the so-called Z-disk are responsible for the striped appearance of skeletal and cardiac muscle.9
Simplified, the myosin molecule consists of two heads which can form cross-bridges with the thin filaments. Each head has a binding site for both actin and adenosine triphosphate (ATP). These binding sites are crucial for muscle contraction: muscle contraction is a cycle of myosin heads binding to actin, distortion of this cross-bridge, and myosin head detaching from actin filaments. The source of energy for this cycle is the hydrolysis of ATP.9
The overlap between thin and thick filaments determines the force-length relationship as shown in Figure 4.3. The optimal length of a muscle is near the normal muscle length. As muscle length increases, the Z disk and thus the actin filaments are pulled away from each other. This can eventually lead to a state in which the actin filaments are pulled beyond the end of the myosin heads. In this state, no cross-bridge formation can occur and no force can be developed. If the length of the muscle is decreased from its resting state, actin filaments can slide over each other and eventually the myosin filaments hit the Z disks. In this case, the overlap of actin and myosin filaments is not optimal and force decreases.9
8 CHAPTER 4. CLINICAL BACKGROUND
Figure 4.3: Theoretical in vitro length-force relationship of a sarcomere21
Figure 4.4: In vivo relationship between transdi-aphragmatic pressure (Pdi, % max) and diaphragm muscle length (DML, % of resting muscle length). Bars denote SE of mean.17
This force-length relationship determines the ability for muscle to adapt to a change in length. For example, hamstrings can adapt to eccentric contractions (i.e. active lengthening) by changing the optimum length.20 This adaptability is not specific to skeletal muscle; also the diaphragm is able to adapt. Farkas et al.8 found that the length-tension curve of the diaphragm in emphysematous hamsters was displaced to the left due to hyperinflation. This reduction in diaphragmatic length was mainly due to a loss of sarcomeres. Prezant et al.7 investigated the adaptability of the human diaphragm in patients on continuous ambulatory peritoneal dialysis. In these patients, the abdomen is virtually always filled with dialysate, which leads to a decrease in functional residual capacity due to the increase in intra-abdominal pressure. They stated that the human diaphragm is be capable of adapting to this constant decrease in FRC by shifting the force-length relationship to the right.
4.5
Diaphragm weakness
Diaphragm weakness is highly prevalent in ICU patients: it is present in approximately 80% of the prolonged mechanically ventilated patients.22–24 Risk factors include sepsis, sedation and denutrition.2 Furthermore, mechanical ventilation is a major contributor to diaphragm weakness in the ICU. Loss of force-generating capacity of the diaphragm related to the use of mechanical ventilation is often referred to as ventilator-induced diaphragm dysfunction.25 Jaber et al.26 found that diaphragm weakness rapidly occurs in critically ill patients on mechanical ventilation. They used the gold standard for determining diaphragm weakness: the twitch transdiaphragmatic pressure after magnetic stimulation of the phrenic nerves, which will be explained in chapter 5.
4.5. DIAPHRAGM WEAKNESS 9
4.5.1 Disuse atrophy
Levine et al.27 were the first ones to find histological evidence of diaphragm atrophy in 14 brain-dead donors. They found that 18-69 hours of complete diaphragm inactivity due to mechanical ventilation led to diaphragm atrophy and increased diaphragmatic proteolysis. Interestingly, this rapid atrophy was not found in pectoralis muscle indicating that the diaphragm is more sensitive to disuse. Hooijman et al.28 obtained diaphragm muscle fibers from 22 critically ill patients who received mechanical ventilation and determined the size and contractile strength of the individual muscle fibers. They found that these fibers display atrophy and severe contractile weakness. Furthermore, the ubiquitin-proteasome pathway, an important proteolysis pathway, was activated in the diaphragm fibers of critically ill patients. Picard et al.29 and Levine et al.27 found that mitochondrial dysfunction and oxidative stress play an important role in diaphragm atrophy respectively. However, these studies were performed in animals and brain-dead patients. In critically ill patients, Van den Berg et al.30 found that diaphragm atrophy is present in the absence of mitochondrial dysfunction and oxidative stress. The study of Goligher et al.1 found that disuse atrophy, demonstrated by a reduced diaphragm thickness with ultrasound, is found in patient with low respiratory effort and high ventilatory assist. They suggest that diaphragm disuse atrophy can be attenuated by titrating ventilator support to maintain adequate levels of respiratory effort.
4.5.2 Excessive loading
Laghi et al.31 investigated the rate of recovery after a fatigue protocol in 12 healthy subjects. They found a marked decrease in diaphragmatic contractility after this protocol, even after 24 hours, indicating load-induced diaphragm injury. Furthermore, Orozco-Levi et al.32 obtained samples of the diaphragm in patients undergoing surgery after a threshold inspiratory loading protocol was performed. They found significantly more sarcomere disruption in the diaphragm biopsies after the loading task, again indicat-ing load-induced diaphragm injury. Goligher et al.1 found that excessive loading, demonstrated by an increased diaphragm thickness with ultrasound, was found in patients with high respiratory effort and low ventilatory assist. They suggest that excessive loading, next to disuse atrophy, can be attenuated by maintaining adequate levels of respiratory effort.
5
|
Technical Background
Certain techniques will be needed to prove the hypothesis that PEEP results in a caudal shift of the di-aphragm, leading to a shortening and a decrease in its force generating capacity. First, imaging techniques are needed to quantify the change in position and length after PEEP application. Second, techniques are needed to quantify the change in functionality after PEEP application due to this change in diaphragm position and length. Many methods are currently used in the clinical practice to determine diaphragm position and function of which the most used methods will be listed below.
5.1
Methods to assess the position of the diaphragm
5.1.1 Ultrasonography
Ultrasound is often used in clinical practice to assess the diaphragm. Two different windows can be used, of which the subcostal window could be used to monitor the change in position for instance due to PEEP application. With a low-frequency (2-5 MHz) probe placed subcostally, the diaphragm can be monitored as a hyperechoic line using the liver or spleen as an acoustic window.33 In M-mode, it is often used to monitor diaphragm excursions and assess diaphragm functionality during spontaneous breathing. The subcostal window can be interesting for this study since it can also be used to quantify the displacement of the diaphragm dome after a change in PEEP level by comparing the end-expiratory position of the diaphragm before and after a change in PEEP level, see Figure 5.1.
Ultrasound is non-invasive, easy to use, safe, has low costs and is applicable at the bedside. However, quantifying movement of the left hemidiaphragm is often difficult since the bowel and gas interposition often hide the diaphragm.33 Furthermore, a major disadvantage of ultrasound is its two-dimensional view of the diaphragm. It is unknown how the diaphragm acts in response to PEEP. Theoretically it would be possible that one part of the diaphragm displaces differently to PEEP than another which could be missed with ultrasound.
5.1.2 Computer tomography
Computer tomography (CT) has been used in several studies to monitor the position and length of the diaphragm.34–36 Especially the study of Pettiaux et al.34 is interesting, since CT was used for three-dimensional reconstruction of the diaphragm. During the study, 20 coronal and 30 sagittal images were reconstructed. Silhouettes of the diaphragm contour in both the zone of apposition and in the dome were digitized from which a three-dimensional reconstruction was made, see Figure 5.2. They stated that CT is a reliable method to obtain accurate measurements of muscle length, surface area and shape. However, a major disadvantage is the exposure to radiation. Next to this, CT is rather expensive and not applicable at the bedside. Especially for mechanical ventilated patients, performing a CT scan is quite cumbersome.
5.1. METHODS TO ASSESS THE POSITION OF THE DIAPHRAGM 11
Figure 5.1: Ultrasonographic view of the diaphragm in a critically ill patient in the region of the liver dome, with B-mode image on the left and M-mode image on the right. The M-mode image shows the acute effect of a 10 cmH2O PEEP change on the position of the diaphragm, measured at end-expiration
(indicated by dashed line); note that in this patient PEEP was decreased from 12 to 2 cmH2O, resulting
in a cranial diaphragm displacement.3
12 CHAPTER 5. TECHNICAL BACKGROUND
5.1.3 Magnetic resonance imaging
As with CT, magnetic resonance imaging (MRI) has already been used to make a three-dimensional re-construction of the diaphragm.37, 38 However, in contrast to CT, MRI does not lead to radiation-exposure. Furthermore, MRI can be used to make dynamic three-dimensional reconstruction of the diaphragm.39 In this way, the shape, length and motion of the diaphragm can be monitored during the respiratory cycle. Craighero et al.39 also concluded that the spatial and temporal resolution was sufficient for studying diaphragm dynamics. However, like CT, MRI is quite expensive and not applicable at the bedside.
5.1.4 X-ray
Since X-rays are part of the clinical practice in the ICU, they could be used to monitor diaphragm position. Chest X-rays have especially been used to monitor the length of the diaphragm.17, 40, 41 Furthermore, X-ray is applicable at the bedside and easy to perform. Disadvantages are the exposure to radiation and the two-dimensional view. Furthermore, only the right hemidiaphragm can be assessed, since the heart shadow often conceals the left hemidiaphragm.17
5.1.5 Fluoroscopy
In clinical practice, fluoroscopy is used to diagnose diaphragm paralysis.42, 43 With fluoroscopy, dynamic images of the diaphragm can be obtained during the breathing cycle using X-ray. Furthermore, multiple fluoroscopy could be obtained to create a three-dimensional reconstruction. Major disadvantages are its exposure to radiation and its poor accessibility.
All imaging techniques that could be used to monitor the change in position of the diaphragm and its advantages and disadvantages are summed up in Table 5.1.
5.2
Methods to assess the function of the diaphragm
5.2.1 Ultrasonography
As discussed earlier, diaphragm ultrasound is often performed in two windows. In the zone of apposition, a measure of the function of the diaphragm can be assessed. Using a high-frequency probe (10 MHz) located between the 8th and 10th intercostal space in the mid-axillary or antero-axillary line, the diaphragm can be seen as a less echogenic structure between the pleura and the peritoneum33 With this window, the thickness of the diaphragm can be assessed and the thickening fraction can be calculated as a change in thickness between inspiration and expiration.44, 45 This thickening fraction can be used to estimate the work of breathing, since a significant correlation was found between the thickening fraction and the diaphragmatic pressure-time product, which is a tool for quantifying respiratory muscle effort. Despite the significant correlation, the variation between thickening fraction values at a specific value of the pressure-time product was high.46 Therefore, using the thickening fraction as a measure for work of breathing has its limitations, since the exact amount of work of breathing at a given thickening fraction is highly variable. Ultrasound has its clear advantages: it is easy to perform, accessible, cheap and applicable at the bedside.
5.2.2 Maximal (sniff ) maneuvers
5.2. METHODS TO ASSESS THE FUNCTION OF THE DIAPHRAGM 13
Table 5.1: Overview of the techniques to assess diaphragm position
ability to understand comments and perform the maneuver. Therefore, when low values are found, it is not known whether it is a result of either decreased respiratory function or poor technique/effort.42, 47 Furthermore, subjects can be asked to perform maximal sniffs, which is defined as a short sharp sniff as hard as possible.48 Miller et al.48 found that sniff maneuvers are more reproducible than maximal inspi-ratory maneuvers. However, just like the maximal inspiinspi-ratory pressure, the sniff maneuver is a voluntary test which means that the outcome is again extremely dependent on the subject’s ability to understand comments and perform the maneuver rather than diaphragm function.
Different pressures can be assessed during these voluntarily maneuvers. The mouth pressure is easily available and therefore the easiest to use. However, change in mouth pressure during a maximal maneuver is more a parameter for global respiratory function rather than diaphragm function, because pressure generation of other inspiratory muscles is also incorporated. Therefore, a more specific method to measure diaphragm function is needed: the transdiaphragmatic pressure.
5.2.3 Transdiaphragmatic pressure
14 CHAPTER 5. TECHNICAL BACKGROUND
values between subjects vary over a wide range.50 Another limitation is that interpretation of Pes, Pga and Pdi measurements are rather complex and are therefore rarely used in the routine clinical care.51
5.2.4 Diaphragm electromyography
Next to the pressure that the diaphragm can develop, the electrical activity of the diaphragm can be monitored. More precisely, it is a measure of the spatial and temporal summation of action potentials from the recruited motor units. Provided that the neuromuscular transmission and muscle fiber membrane excitability are intact, the electrical activity of the diaphragm should be a valid reflection of phrenic nerve activity and therefore, the neural respiratory drive of the patient.52 The electrical activity of the diaphragm can be monitored non-invasively using surface electrodes around the chest, often referred to as sEMGdi. Furthermore, the electrical activity of the diaphragm can be measured using an invasive esophageal catheter inserted via the nose or mouth, which is referred to as EAdi. In contrast to the sEMGdi, the EAdi measured by a catheter is less affected by obesity and cross-talk signals from other muscles.53 The esophageal catheter possesses metal electrodes which are placed at the level of the crural diaphragm. Therefore, the EAdi recorded by an esophageal catheter is mainly from the crural part of the diaphragm and is criticized for not being representative of the diaphragm as a whole. However, electrical activity in the crural and costal parts of the diaphragm are closely correlated.54, 55 The EAdi is only useful if the signal is recorded accurately. Typical artifacts include esophageal peristalsis, the ECG, electrode motion and power line artefacts.56 Using the correct computer algorithms, these factors can be controlled for.57 High EAdi levels represent high neural drive, whereas low EAdi values could indicate low neural drive but can also be the consequence of catheter malposition, malfunction of the neuromuscular junction or phrenic nerve or the use of neuromuscular blocking agents or sedatives.47 Another limitation is the need for inserting an esophageal catheter which may uncomfortable in non-sedated patients. However, most ICU patients require a nasogastric catheter for feeding, which are available with EMG electrodes to measure EAdi simultaneously.
5.2.5 Neuromechanical efficiency
Neuromechanical efficiency (NME) is the ratio between Pdi and EAdi, i.e. the ability of the diaphragm to convert neural input (EAdi) into mechanical output (Pdi).58 Its advantage is that it is not influenced by the subject’s load of breathing such as airway compliance and resistance. NME can be used as a parameter for the diaphragm’s muscle strength, therefore a decrease in NME indicates diaphragm weakness whereas an increase indicates recovery.47
Pdi, EAdi and NME can be monitored during tidal breathing or during voluntarily maneuvers as discussed earlier. Since voluntarily maneuvers have their clear disadvantages, a more specific method can be used to assess diaphragm’s strength: stimulation of the phrenic nerves.
5.2.6 Stimulation of the phrenic nerves
5.2. METHODS TO ASSESS THE FUNCTION OF THE DIAPHRAGM 15
Table 5.2: Overview of the techniques to assess diaphragm function
Stimulation should be supramaximal to gain valid information about the maximal strength of the di-aphragm.49 Therefore, bilateral anterolateral stimulation is preferred over other magnetic stimulation methods (e.g. cervical stimulation) since reliable supramaximal twitch transdiaphragmatic values are ob-tained and less co-activation of muscles occurs.60 The great advantage of magnetic stimulation is that it requires no voluntary actions of the subjects. However, subjects do not always tolerate repeated magnetic stimulations and the technique requires expertise since it is technically challenging.22
6
|
The Acute Effects of PEEP on the
Diaphragm in Healthy Subjects
6.1
Introduction
It has recently been found that PEEP may contribute to diaphragm weakness, which is an important problem in the ICU.2, 3 The study of Lindqvist et al.3 showed that mechanical ventilation with PEEP resulted in a caudal displacement of the diaphragm in both critically ill patients and rats, since PEEP increases end-expiratory lung volume. Furthermore, their study in rats showed that this displacement resulted in a reduced fiber and sarcomere length on the short term. Since these shortened muscle fibers were not operating at their optimal position on their force-length relationship, diaphragm fibers of long-term ventilated rats (18 hours) adapted by absorbing serially-linked sarcomeres. In this manner, the optimal length on the force-length relationship was decreased (i.e. the force-length was shifted to the left) thereby restoring the sarcomere length to their original, physiological length.
The aim of our study is to evaluate the acute effects of PEEP on the position, length and function (i.e. force generating capacity) of the diaphragm in vivo. This is the first step to evaluate whether adaptation of muscle fibers could also occur in the human diaphragm since adaptation will only take place if the diaphragm is positioned at a suboptimal length on the force-length relationship. It is hypothesized that the immediate caudal shift of the diaphragm as a result of PEEP causes a reduction in diaphragm fiber length. Since short muscle fibers are not working at their optimal length of their force-length relationship, it is hypothesized that the diaphragm can generate less force at high PEEP levels. This physiological proof of concept study is the first step towards understanding the role of PEEP on the diaphragm in humans, which could lead to better understanding of diaphragm weakness in mechanically ventilated patients in the ICU. In this manner, new strategies to prevent or treat diaphragm weakness may be established.
6.2
Methods
6.2.1 Study design and population
This study was conducted in collaboration between the department of Intensive Care Adults and the department of Radiology and Nuclear Medicine of the Amsterdam UMC, location VUmc, Amsterdam, the Netherlands. The study population consisted of healthy subjects older than 18 years. In total, 15 healthy subjects will be included. Exclusion criteria were symptoms relating to respiratory or cardiovascular disease, history of pneumothorax, obesity (BMI > 30 kg/m2), contraindications for the placement of a nasogastric tube and contraindications for MRI. The study consisted of two parts: 1) physiological measurements during non-invasive mechanical ventilation with PEEP and 2) MRI measurements during non-invasive mechanical ventilation with PEEP. The different parts of the study were not necessarily performed on the same day.
6.2. METHODS 17
The protocol was approved by the local ethics review committee (approval number: 2017-590). Written informed consent was obtained from the subjects prior to the start of the study.
6.2.2 Part 1: Physiological study
6.2.2.1 Screening and study set-up
Screening of the subjects was performed which included a medical history, physical examination and a ECG. After screening, two CE-certified nasogastric catheters were inserted nasally to measure the electrical activity of the diaphragm (EAdi-catheter, Maquet Critical Care, Solna, Sweden), and the esophageal pressure (Pes) and gastric pressure (Pga) simultaneously (Nutrivent, Sidam, Mirandola, Italy). Both catheters were positioned according to clinical protocol.49 Transdiaphragmatic pressure (Pdi) was defined as Pga-Pes. EMG surface electrodes were placed on the left parasternalis muscle, rectus abdominis muscle and the external oblique muscle to monitor activity of the accessory inspiratory muscles and expiratory muscle activation, since earlier studies showed that healthy subjects may try to counteract PEEP by using their abdominal wall muscles.61, 62 Furthermore, accessory respiratory muscles could be activated due to an increased work of breathing. Flow was continuously measured with a pneumotachograph (Adult Flow Sensor, Hamilton Medical, Bonaduz, Switzerland). All signals were acquired with a CE-certified measurement set-up (BIOPAC MP160, BIOPAC Systems Inc., Goleta, California, USA).
6.2.2.2 Mechanical ventilation with PEEP
PEEP was applied while patients were ventilated in pressure support mode (SERVO-i, Maquet Critical Care AB, Solna, Sweden) using a non-invasive ventilation (NIV) mask. During all measurements, the fraction of inspired oxygen was set to 21% (ambient air) and no additional inspiratory support was given. Before starting the experimental protocol, the PEEP level was set to 5 cmH2O on the ventilator so that the subject could get used to the sensation of mechanical ventilation with PEEP.
6.2.2.3 Magnetic Stimulation
Magnetic bilateral anterolateral stimulation of the phrenic nerves was performed to measure twitch Pdi using two figure-of-eight coils and MagStim 2002 stimulators (MagStim Co., Whitland, Dyfed, UK) ac-cording to clinical protocol.49 Before the experimental protocol, supramaximal stimulation was assessed by leveling off twitch Pdi-values during a stepwise increase of the stimulator intensity (70-80-90-100% of maximal power output). On each power setting, two stimulations were made. During the experimental protocol, power output was increased with a further 10% to compensate for slight changes in the quality of the stimulus. At least 30 seconds were taken between stimulations to avoid potentiation.49
6.2.2.4 Neuromechanical Efficiency
The neuromechanical efficiency (NME) of the diaphragm was assessed during an end-expiratory hold given at the ventilator. In this manner, the NME was assess during an isovolumetric contraction.
6.2.2.5 Ultrasound
18 CHAPTER 6. ACUTE EFFECTS OF PEEP IN HEALTHY SUBJECTS
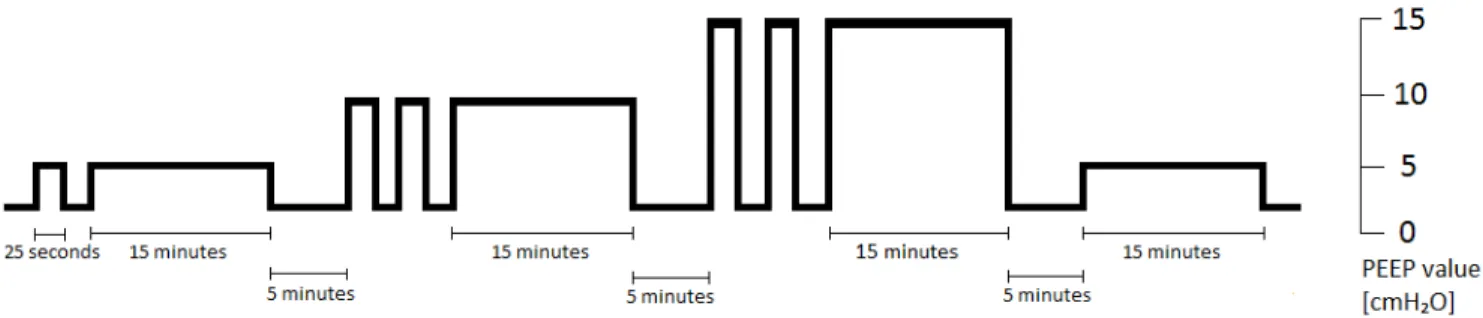
Figure 6.1: Overview of all PEEP values during the experimental protocol
6.2.2.6 Experimental protocol
At the baseline PEEP of 2 cmH2O, three different measurement were performed. First, three twitch Pdi
values were measured. Second, ultrasound was performed to assess diaphragm thickness. Third, three NME values were measured. After performing baseline measurements, the PEEP level was changed. Dur-ing each change in PEEP level, subcostal ultrasound was performed. The caudal-cranial displacement of the diaphragm was calculated from a M-mode image directly on the ultrasound machine. The investigated PEEP levels were 5, 10 and 15 cmH2O since these levels are often used in clinical practice. For each PEEP
level, one or two short moment of PEEP administration were given (lasting for±25 seconds), after which a longer moment of PEEP administration was delivered (lasting for ±15 minutes). The short moments of PEEP administration were given so that more ultrasound images could be made to assess the change of the diaphragm’s position. At the longer moments of 5, 10 and 15 cmH2O PEEP administration, the same
measurements as the baseline measurements were performed: three twitch Pdi measurements, ultrasound measurements and three NME measurements. After finishing the measurements at 15 cmH2O, a PEEP level of 5 cmH2O was applied again to evaluate whether measurements in the first long moment of 5
cmH2O PEEP were comparable to the later application of this same PEEP level. Periods of 2 cmH2O were given between different PEEP levels. An overview of the PEEP levels is given in Figure 6.1. All measurements were performed in supine position.
This part of the study took approximately 3 hours to perform. Ultrasound movies in the zone of apposition and all signals acquired by the measurements set-up were saved for offline analysis.
6.2.3 Part 2: MRI study
6.2.3.1 Study preparations
Before the MRI measurements, the subject was randomized to receive either 5, 10 or 15 cmH2O of PEEP.
A flexible tube (7mm ID) filled with oil was fixated around the costal margin of each subject to identify the origin of the costal diaphragm fibers.37 The subject took place in the supine position in the 1.5T MRI scanner (MAGNETOM Avanto, Siemens AG) with the NIV mask positioned and connected to the same mechanical ventilator as used for the physiological part of the study. Initially, the PEEP was set to the baseline value of 2 cmH2O. Steady state free precession MRI was used with the following operating conditions: slice thickness of 15 mm, echo time of 1.01 ms, flip angle of 50 degrees, temporal resolution of 99ms and a repetition time of 84.7 ms for the sagittal planes and 99.2 ms for the coronal planes.
6.2.3.2 Experimental protocol
Real-time MRI measurements were started at the PEEP level of 2 cmH2O and after 30 seconds the PEEP level was increased to 5, 10 or 15 cmH2O, depending on the allocated PEEP level. This PEEP level was
6.2. METHODS 19
for±60 seconds at baseline PEEP level. After the MRI data were saved, real-time MRI measurements were started again. The same protocol was performed, but images were made in another plane. Measurements took place in the following planes:
• Sagittal right (SAG-R) – through the top of the right diaphragm dome
• Sagittal left (SAG-L) – through the top of the left diaphragm dome
• Coronal mid (COR-Mid) - positioned at the top of the diaphragm dome in the sagittal right plane
In total, this part of the study took 1 hour to perform.
6.2.4 Data analysis
6.2.4.1 Physiological parameters
Measurement variables of the physiological part were analyzed offline in Matlab R2016a (The Mathworks, Natick, MA). Twitch Pdi-values were calculated as the difference in Pdi from baseline to peak value. The NME of the diaphragm was calculated as the difference in transdiaphragmatic pressure from baseline to peak value divided by the peak value of the electrical activity of the diaphragm (∆Pdi/EAdi). Mean values of three measurements per PEEP level were calculated for both the twitch transdiaphragmatic pressure and the NME. Furthermore, some basic respiratory variables were calculated on a breath-by-breath basis during the longer period of PEEP ventilation (15 minutes). Median values of the respiratory breath-by-breath measurements were calculated. We defined the following variables:
• EAdi amplitude, as the peak of the EAdi signal
• Tidal volume, as the integral of the inspiratory flow over time
• I:E ratio, as the ratio between the inspiratory and the expiratory respiratory phase (based on flow)
• Respiratory rate, as the number of breaths (based on flow) in one minute
• Minute volume, as the product of the respiratory rate and the tidal volume
Ultrasound movies were analyzed with DICOM software (Sante DICOM Viewer, Santesoft, Athens, Greece). The thickening fraction was defined as the end-inspiratory thickness minus the end-expiratory thickness divided by end-expiratory thickness. Mean values of three breaths at each PEEP level were calculated.
6.2.4.2 MRI parameters
20 CHAPTER 6. ACUTE EFFECTS OF PEEP IN HEALTHY SUBJECTS
Figure 6.2: Representative magnetic resonance image in the mid coronal plane at functional residual capacity in subject 5. The length of the diaphragm dome (i.e. lung-apposed diaphragm) was measured by following the contour of the dome (green line). The length of the right and left zone of apposition (ZOA i.e. rib cage-apposed diaphragm) was estimated by straight lines (blue lines). The diameter of the diaphragm dome (i.e. shortest straight line) is depicted in red. The shape parameter K-dome was calculated by dividing the contour of the diaphragm dome by its diameter. Note the costal markers (white arrows) indicating the lower limits of the zone of apposition
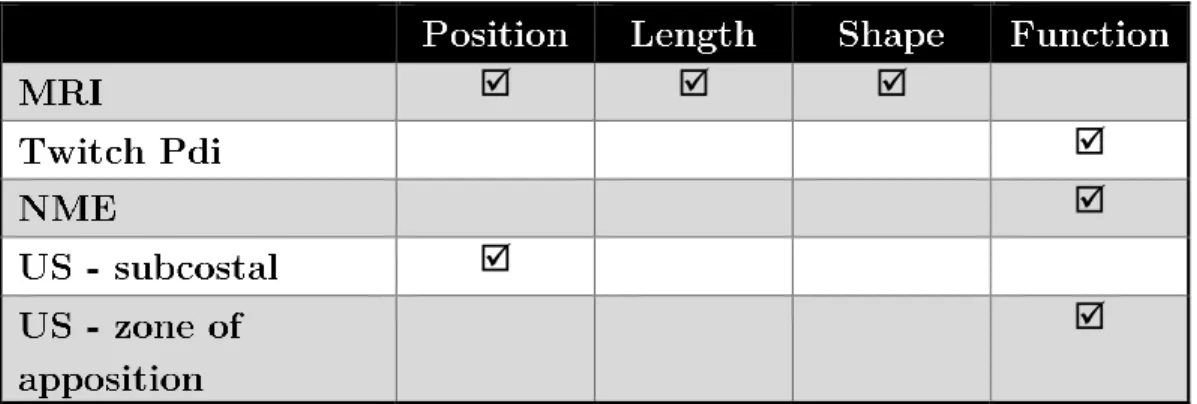
Table 6.1: Overview of the primary study parameters and their objective regarding the diaphragm at different PEEP levels
6.3. RESULTS 21
Figure 6.2: Ultrasound measurements during physiological part of the study. A) Displacement of the diaphragm (in cm) as a result of a change in positive end-expiratory pressure (PEEP) level (in cmH2O).
Displacement in the caudal direction is defined as a positive displacement, whereas cranial displacement is defined as a negative displacement. Note that not all measurements are performed in each subject. B) Change in diaphragm thickness (in %) as a result of an increase in PEEP level, n=5 for all PEEP levels. Data are presented as mean±SD.
6.3
Results
Until now, six of the fifteen subjects were recruited. One subject was excluded due to the inability to po-sition the nasogastric catheters. Baseline characteristics of the remaining subjects involved a male/female ratio of 2/3, mean age of 30.0±2.1 years, and a mean BMI of 23.7±1.1 kg/m2. Due to technical difficulties, the electrical activity of the diaphragm of three subjects was not measured. MRI measurements were not performed yet in one of the five remaining subjects due to time constraints. Furthermore, one MRI scan was performed without the costal markers. Therefore, the length of the zone of apposition could not be measured in this subject. In the same subject, a few measurements in the coronal mid plane of the MRI scan were disregarded due to unclear diaphragm silhouettes. Furthermore, there were no serious adverse events during the experimental protocol.
6.3.1 Effect of PEEP on diaphragm position and length
Figure 6.2A shows the effect of a change in PEEP level on the position of the diaphragm measured by ultrasound. An increase in PEEP levels led to a caudal displacement of the diaphragm, varying from 0.5 cm when PEEP was increased from 2 to 5 cmH2O, to 2.0 cm when PEEP was increased from 2 to 15
cmH2O. Consequently, decreasing PEEP levels led to a cranial displacement of the diaphragm. Figure 6.2B shows the effect of PEEP on diaphragm thickness. A trend towards a thicker diaphragm at higher PEEP levels is seen. MRI measurements can be found in Table 6.2. It can be seen that PEEP led to a caudal displacement of the diaphragm, varying from 2 mm at a 2 to 5 cmH2O change in PEEP level to 22 mm at a 2 to 15 cmH2O change in PEEP level. Furthermore, an increase in PEEP level led to decrease in the length of the zone of apposition for all subject, varying from 2 to 50%. See Figure 6.3 for an example of a representative subject. The length and shape of the diaphragm dome did not change uniformly as a result of a change in PEEP level. The maximal increase in diaphragm dome length was 7% during a maximal PEEP increase to 15 cmH2O. Furthermore, the thorax diameter increased with maximal 4%
22 CHAPTER 6. ACUTE EFFECTS OF PEEP IN HEALTHY SUBJECTS
Figure 6.3: Representative magnetic resonance image in the left sagittal plane at functional residual capacity in subject 1 at two different PEEP levels. On the left, a PEEP level of 2 cmH2O is depicted,
whereas on the right a PEEP level of 15 cmH2O is depicted. The diaphragm dome is marked in green and the zone of apposition in blue. Note the caudal displacement of the diaphragm and the concomitant reduction in length of the zone of apposition as a result of an increase in PEEP.
6.3.2 Effect of PEEP on diaphragm function
6.3.2.1 Twitch transdiaphragmatic pressure
The stimulator intensity was set to 100%of maximal power output in most subjects; in one of the subjects a power output of 90%was sufficient for supramaximal stimulation. Magnetic stimulation was well tolerated by all subjects. Figure 6.3 shows the effect of PEEP on the twitch pressures in one representative subject; twitch transdiaphragmatic pressure decreased if higher levels of PEEP were applied. Data of all subjects can be found in Figure 6.4. A trend towards lower transdiaphragmatic pressure during higher PEEP levels can be seen.
6.3.2.2 Additional functional measurements
An overview of the effects of PEEP on all functional measurements can be found in Table 6.3. The NME showed a trend of decreasing values when higher levels of PEEP were applied, but only two subjects were measured. The EAdi amplitude of the two subjects showed no analogous trend. The thickening fraction showed a trend towards higher values with increasing levels of PEEP with a thickening fraction of around 30% at baseline PEEP to almost 80%at the highest PEEP level. No increased activity of the additional respiratory muscles was seen with surface EMG except in subject 2 (data not shown). Individual data of the included subjects from the physiological part of the study is shown in appendix A.
6.3.3 Effect of PEEP on respiratory pattern
6.3. RESULTS 23
Table 6.2: Diaphragm position, length and shape measured with MRI at different PEEP levels. Both absolute values and change (%) in comparison with the baseline PEEP value of 2 cmH2O are depicted.
Note that the length of the zone of apposition and a few parameters in the coronal images could not be measured in one of the subjects where a PEEP level of 5 cmH2O was applied
24 CHAPTER 6. ACUTE EFFECTS OF PEEP IN HEALTHY SUBJECTS
Figure 6.3: The effect of positive end-expiratory pressure (PEEP) on the esophageal (Pes), gastric (Pga) and transdiaphragmatic pressure (Pdi) after magnetic stimulation. Data is from one representative subject. An increase in PEEP level led to a decrease in twitch transdiaphragmatic pressure.
6.3. RESULTS 25
Table 6.3: Diaphragm functional measurements at different PEEP levels. Change is measured in com-parison with the baseline PEEP level (2 cmH2O). Note that the NME and EAdi amplitudes are measured
in 2 subjects, in contrast to the twitch Pdi and thickening fractions where 5 subjects are measured. Data are presented as mean±SD.
PEEP = positive end-expiratory pressure; Pdi = transdiaphragmatic pressure; NME = neuromechanical effi-ciency; EAdi = electrical activity of the diaphragm.
Table 6.4: Respiratory variables for different PEEP levels. Both absolute values and change (%) in comparison with the baseline PEEP level (2 cmH2O) are depicted. Data are presented as mean±SD.
26 CHAPTER 6. ACUTE EFFECTS OF PEEP IN HEALTHY SUBJECTS
6.4
Discussion
The present study is the first to evaluate the acute effects of PEEP on the position, length and function of the diaphragm in vivo. Preliminary data showed that PEEP resulted in a caudal displacement of the diaphragm in healthy subjects, measured with both ultrasound and MRI. Furthermore, PEEP led to a decrease in length of the diaphragm, mainly in the zone of apposition. In addition, a trend towards a reduction in diaphragm function was seen indicating that the diaphragm is operating at a non-optimal length on the force-length relationship as a result of PEEP. However, this proof-of-concept study is not yet completed; the sample size is limited to five subjects. Therefore, no statistical analysis were performed and no final conclusions can be drawn.
6.4.1 Effect of PEEP on diaphragm position and length
6.4.1.1 Diaphragm displacement measured with ultrasound
Ultrasound was used to evaluate the displacement of the diaphragm since it is accessible, non-invasive and easy to use. Figure 6.2 shows that mechanical ventilation with PEEP led to a caudal displacement of the diaphragm measured by ultrasound. The caudal displacement of the diaphragm as a result of an increase in PEEP was consistently larger than the cranial displacement as a result of a decrease in PEEP. This may be explained by the fact that the visualization of the diaphragm was limited during a reduction in PEEP since air of the intestines appeared in the field of view of the ultrasound image. It was hypothesized that the decrease in PEEP causes a similar but reversed displacement of the diaphragm than an increase in PEEP, which could be tested better with MRI than ultrasound measurements since ultrasound is limited in its 2-dimensional view. Furthermore, on average, it takes three breaths to create a new equilibrium after a change in PEEP level.61 Due to technical limitations of the ultrasound, diaphragm displacement
can be calculated within a fixed time range of the M-mode. In subjects with a low respiratory rate, the displacement could be calculated after two breaths which might be an underestimation since a new equilibrium might not yet be reached.
A high intra-subject variation was seen in the displacement of the diaphragm with ultrasound (Figure A.1 of appendix A). This could be explained by the fact that it was difficult to place the M-mode of the ultrasound exactly perpendicular to the movement of the diaphragm. Therefore, these ultrasound images are of limited value.
6.4.1.2 Diaphragm displacement measured with MRI
MRI was used to monitor diaphragm motion at different PEEP levels because real-time images in multiple planes could be made in the absence of radiation exposure. MRI data as shown in Table 6.2 showed a caudal displacement of the diaphragm as a result of PEEP ranging from a few millimeters at low PEEP levels to more than two centimeters at high PEEP levels. This displacement was calculated as the difference between the position of the top of the diaphragm dome at different PEEP levels. In this manner, no differences in anterior or posterior sides are taken into account. Since the diaphragm displaces more posteriorly during tidal breathing than anteriorly, PEEP could also cause more displacement in the posterior region of the diaphragm. This could be evaluated by digitalizing the diaphragm contours at both PEEP levels and determining the difference between both positions at each requested region.
6.4.1.3 Comparison between ultrasound and MRI
6.4. DISCUSSION 27
hypothesized that the displacement of the right dome in the coronal mid plane or in the sagittal right plane was most similar to the displacement measured by ultrasound since ultrasound was performed on the right side. In comparison with the MRI measurements in these planes, ultrasound seemed to overestimate the displacement for most subjects, but no conclusions can be drawn since only four subjects were measured by MRI.
6.4.1.4 Diaphragm length and shape
As a result of the caudal displacement, the length of the diaphragm in the zone of apposition was reduced, as shown in Table 6.2. Even during a minimal increase in PEEP from 2 to 5 cmH2O with a caudal displacement of only two millimeters, the length in the zone of apposition was reduced with maximal 16%. When PEEP is increased to 15 cmH2O, the length of the zone of apposition was decreased up to 50%.
The length of the diaphragm dome was barely decreased, which seemed logical since the diaphragm dome mainly consists of tendon, which is less compressible than the muscle in the zone of apposition. Therefore, the shape of the diaphragm dome barely changed as a result of PEEP. In theory, PEEP could lead to an increase in thoracic diameter thereby flattening the diaphragm dome without a reduction in diaphragm length. No relevant differences in thorax diameter were found, so this effect was less likely to occur. The trend towards increased end-expiratory thickness of the diaphragm at higher PEEP levels (Figure 6.2B) can be explained by the decrease in diaphragm length.
6.4.2 Effect of PEEP on diaphragm function
6.4.2.1 Twitch transdiaphragmatic pressure
Magnetic stimulation of the phrenic nerves was chosen as a primary functional measurements since it is a non-voluntarily test for diaphragm contractility and is thus effort independent. Furthermore, it the gold standard for determining diaphragm weakness and highly reproducible49The transdiaphragmatic pressure was chosen since it is specific for the diaphragm in contrast to the esophageal pressure which is dependent on the accessory respiratory muscles.42
28 CHAPTER 6. ACUTE EFFECTS OF PEEP IN HEALTHY SUBJECTS
a mean CV of 5.3%. However, this CV was found after performing ten measurements instead of three. To reduce the intra-subject variation, more stimulations could be performed. For example, five stimulations can be performed of which the three closest values are taken. Furthermore, it could be checked whether supramaximal stimulation is achieved by checking the levelling off of the twitch pressures during increasing levels of magnetic stimulation output, since supramaximal stimulation is crucial for reproducible values.
6.4.2.2 Neuromechanical efficiency
The NME was selected as a parameter for diaphragm function since it independent of the subject’s load of breathing (airway compliance and resistance).47 The EAdi signal, and thus the NME, of only two subjects was measured due to technical defects. The NME and especially the EAdi amplitudes showed high inter-subject variation (see Figure A.4 in appendix A) which makes interpretation of the absolute values more difficult. However, a trend towards lower NME values at higher PEEP levels was seen, which was particularly clear in the PEEP increase from 2 to 10 cmH2O and from 2 to 15 cmH2O. In one subject, decreasing EAdi amplitudes were found at higher PEEP levels while in the other subject increasing EAdi amplitudes were found (see Figure A.5 in appendix A). The latter seems more logical since it is thought that EAdi amplitudes would increase to compensate for the decreased efficiency and to restore Pdi values. More data is needed to draw conclusions of the effect of PEEP on the EAdi and NME.
NME data showed a large intra-subject variation (mean CV of 22%). No studies are available on the repeatability of the NME based on the Pdi. However, a repeatability study with the NME based on the airway pressure was performed which is a good derivative for the NME based on the Pdi during an isovolumetric contraction.63 In this study, a great inter-subject variation (repeatability coefficient of 82%) was found. However, filtered EAdi signals of the ventilator were used and it was not performed in healthy subjects.
6.4.2.3 Thickening fraction
Increased thickening fractions were seen during higher PEEP levels, especially during a PEEP of 15 cmH2O (Table 6.3). In other words, the effort of the diaphragm was increased, which may seem logical since it was hypothesized that the diaphragm is operating at a suboptimal length on the force-length relationship. However, it is difficult to translate the increase in thickening fraction to a measure of function, since no output (i.e. volume or pressure) was taken into account. It is more a measure of work of breathing rather than diaphragm function, although alternative measurements like pressure time product are superior in determining work of breathing.46
High intra-subject variation was found in the preliminary data with a mean CV of 20%(Figure A.6 in appendix A). This may partly be explained by limitations of ultrasound, such as its 2-dimensional view, limited resolution, and high operator-dependency.33 However, smaller intra-subject variations were seen during end-expiratory thickness measurements (Figure A.2 in appendix A), possibly indicating that the high variability cannot be explained by ultrasound itself and that the thickening fraction was genuinely variable in healthy subjects.
The PEEP level of 5 cmH2O was applied twice: at both the start and the end of the study protocol. In this manner, it could be tested whether potentiation occurred after application of the high PEEP level of 15 cmH2O. Furthermore, it could be tested whether the effects on the diaphragm function were reversible,
which would support our hypothesis that a decreased length of the diaphragm as a result of PEEP caused an immediate effect on diaphragm function. Preliminary data suggested that the measurements at both moments of 5 cmH2O PEEP were comparable, indicating reversible effects of PEEP and no potentiation
6.4. DISCUSSION 29
6.4.3 Effect of PEEP on respiratory pattern
The effect of PEEP on the respiratory pattern can be seen in Table 6.4. The respiratory rate did not alter substantially in these subjects. However, a trend towards lower I:E ratios was seen, which seems legitimate since PEEP hinders expiration. On average, tidal volume and minute volume increased with respectively 13%and 15%. However, both variables showed extremely high inter-subject variability so no conclusion can still be drawn. PEEP causes lung overdistention in healthy subjects and thereby increases physiological dead space ventilation.64 Therefore, minute volume could increase with increasing levels of PEEP to compensate for this increased dead space. This effect was seen in two studies evaluating the effect of PEEP on the respiratory pattern, where the increased minute volume was caused by an increase in tidal volume rather than respiratory rate .61, 65 Both studies describe a reflex mechanism in which the increased expiratory load of PEEP induces activation of both expiratory and inspiratory muscles, thereby increasing tidal volume. Too limited data is present to compare the results of the present study with these previous studies.
6.4.4 Clinical implications
To the best of our knowledge, the present study is the first to evaluate the acute effects of PEEP on the diaphragm in vivo. It may seem logical that PEEP induces a downward shift of the diaphragm since end-expiratory lung volume is increased. However, no studies are yet performed to quantify this exact change in position and its consequently change in diaphragm length and function. If similar results of decreased diaphragm function during PEEP are found in mechanically ventilated ICU patients, the diaphragm could adapt structurally. By reducing the number of sarcomeres (i.e. longitudinal atrophy), the optimal length of the sarcomeres is restored and the function will restore. However, this adaptation ensures that the diaphragm length is decreased. The adaptation could have detrimental effects during a spontaneous breathing trial since PEEP is abruptly removed leading to an acute decrease in end-expiratory lung volume and an acute increase in diaphragm length. This could lead to a stretch in the adapted diaphragm muscle fibers resulting in a decrease in diaphragm function, thereby possibly contributing to diaphragm weakness. The effects of PEEP in healthy subjects cannot directly be translated to ICU patients. For example, PEEP may have a different effect in an ARDS patient with a decreased respiratory compliance. Furthermore, in clinical practice, abdominal muscle activity is occasionally increased in ICU patients which could diminish the effects of PEEP on the diaphragm. Therefore, more data in ICU patients is needed to evaluate the effects of PEEP on the diaphragm. In the meantime, low PEEP levels are preferred in clinical practice provided that oxygenation remains sufficient. In addition, a gradual decrease in PEEP before discontinuing mechanical ventilation may be beneficial. At last, it is known that disuse atrophy can be attenuated by maintaining small levels of respiratory effort. Similarly, longitudinal atrophy may be diminished by occasionally decreasing PEEP levels during the course of mechanical ventilation.
6.4.5 Study limitations
30 CHAPTER 6. ACUTE EFFECTS OF PEEP IN HEALTHY SUBJECTS
we were mostly interested in the change between two different PEEP levels, the perfect location for the marker seemed of limited importance.
Due to the limited time of my internship, MRI images were only analyzed in three planes. Additional images in coronal planes were made, for example in a plane positioned more posterior than the coronal mid plane. It was chosen to first evaluate the effect of PEEP in the these three planes since the muscle fibers contract in the same direction as these planes were viewed. Furthermore, additional analysis could be made, for example 3D reconstruction of the diaphragm, like the studies of Gauthier et al.37 and Paiva et al.38 Currently, we are conducting static full-coverage MRI images of the diaphragm at different PEEP levels with a higher spatial resolution. In this case, the 3D geometry of the diaphragm can be determined. Ideally, all images will be analyzed automatically of which a real-time 3D reconstruction is made.
MRI measurements did not take place at the same moment as the physiological measurements. Since there are no indications that a healthy subject does not respond similar to the same level of PEEP at different moments, this assumption was made. Furthermore, the MRI data is limited to one PEEP level per subject, since applying all PEEP values would be too time-consuming.
MRI and ultrasound images were not analyzed in a blind manner. When data is obtained from all subjects, the final analysis will be performed in a blind manner by two different observers.
A PEEP level of 2 cmH2O was used as a baseline value because it was the minimal level of PEEP the mechanical ventilator could generate. Since the end-expiratory lung volume is already increased with a PEEP of 2 cmH2O, the effect of PEEP may be underestimated. However, it is thought that this effect will
be minimal since the end-expiratory lung volume is increased with less than 200 ml taken the compliance of a healthy respiratory system into account.11 Currently, we are performing MRI measurements to evaluate the effect of 2 cmH2O PEEP.
The change in end-expiratory lung volume as a result of PEEP could be analyzed by comparing the in-spiratory and expiratory flow directly after a change in PEEP. Other parameters like swings in esophageal and transdiaphragmatic pressures, surface EMG of the expiratory muscles and the work of breathing at different PEEP levels may be also be of interest.
7
|
The Effects of PEEP on the Position of
the Diaphragm in ICU Patients
7.1
Introduction
Diaphragm weakness is highly prevalent in critically ill patients admitted to the ICU and increases length-of-stay and mortality.23, 24 Many contributors to diaphragm weakness are known such as inappropriate levels of inspiratory support, but the effects of PEEP have never been studied.1 Our hypothesis is that PEEP increases the end-expiratory lung volume and thereby shifts the diaphragm to a more caudal position which leads to shortening in the zone of apposition. Furthermore, it is hypothesized that this reduction in length affects the diaphragm’s capacity to produce force, since its force-length relationship is altered. The decrease in force-generating capacity could cause structural adaptations in the contractile units of the diaphragm, since it is known that muscles are capable to adapt to new lengths, thereby possibly contributing to diaphragm weakness.6 The first step of proving this hypothesis is to demonstrate that mechanical ventilation with PEEP shifts the diaphragm to a more caudal position. Therefore, the aim of this study is to prove the hypothesis that PEEP leads to a caudal shift of the diaphragm in mechanically ventilated patients.
7.2
Methods
Diaphragm ultrasound (sector array transducer, 5-1MHz, CX 50, Philips Inc., Bothell, WA, USA) was performed in mechanically ventilated ICU patients from the subcostal view at the right side using the liver as a window. The diaphragm was first imaged in the B-mode. Consequently, M-mode ultrasound images were acquired while PEEP was acutely reduced with either five or ten cmH2O within one breath cycle. The caudal-cranial displacement of the diaphragm was calculated from the M-mode images obtained during subsequent breaths (Figure 7.1). Analysis of diaphragm movement was performed on the ultrasound machine.
7.3
Results
Diaphragm ultrasound was performed in 15 critically ill patients admitted to the ICU with a clinical indication for PEEP reduction (Table 7.1). In all fifteen patients, acute PEEP reduction caused a cranial displacement of the diaphragm. Acute PEEP reduction of 5 cmH2O caused an average displacement of 0.40±0.10 cm (n=5) and a reduction of 10 cmH2O caused an average displacement of 0.89±0.17 cm
(n=10), see Figure 7.2.