Competitive Strategy for Open Source Software
Vineet Kumar, Brett Gordon and Kannan Srinivasan∗
June 2011
Abstract
Commercial open source software (COSS) products—privately developed software based on publicly available source code—represent a rapidly growing, multi-billion-dollar market. A unique aspect of competition in the COSS market is that many open source licenses require firms to make certain enhancements public, creating an incentive for firms to free-ride on the contributions of others. This practice raises a number of puzzling issues. First, why should a firm further develop a product if competitors can freely appropriate these contributions? Second, how does a market based on free-riding produce high-quality products? Third, from a public policy perspective, does the mandatory sharing of enhancements raise or lower consumer surplus and industry profits?
We develop a two-sided model of competition between COSS firms to address these issues. Our model consists of (1) two firms competing in a vertically differentiated market, in which product quality is a mix of public and private components and (2) a market for developers that firms hire after observing signals of their contributions to open source. We demonstrate that free-riding behavior is supported in equilibrium, that a mandatory sharing setting can result in high quality products, and that free-riding can actually increase profits and consumer surplus.
Keywords: Open Source Software, Product Strategy, Signaling, Game Theory
∗
The authors would like to thank Anthony Dukes, Oded Koenigsberg, seminar participants at Stanford University, University of Chicago, University of Michigan, UT Dallas, the 3GTM Conference at HEC Montr´eal, and the Marketing
1
Introduction
The $500 billion software market is undergoing a significant transformation as open source software
continues to alter the competitive landscape of the industry (Economist, 2009). Open source
software is built through public collaboration. The source code is published openly and others are
permited to enhance it, in contrast to traditional software where firms closely guard a product’s
source code.1 However, open source no longer serves only as a substitute for proprietary software—
it is increasingly being incorporated directly into a wide range of commercial products (Gartner
Group, 2008).2
Commercial open source software (COSS) firms build commercial products based on adding
more features and enhancing the usability of publically available open source software. The terms
that govern open source licenses dictate how modified versions may be distributed.3 Certain licenses
require COSS firms to release feature improvements to the public, where competing firms can
incorporate them into their own products. Thus, firms are able to free-ride on the contributions of
other firms, a practice Microsoft CEO Steve Ballmer referred to as “a cancer that attaches itself in
an intellectual property sense to everything it touches.” (New York Times, 2003).
The unique institutional arrangements discussed above raise a number of puzzling issues. First,
why should a firm develop additional features for its product if competitors can freely appropriate
these features for their products? Second, technology experts have pointed to cases in which COSS
products are comparable to or even better than similar products produced by traditional closed 1Open source software should be distinguished from two other forms of freely available software. Some firms
make their software available for free (“freeware”) but do not make the source code available (e.g., Adobe Reader). Another form is voluntary open source, where a firm releases the source code but with strong restrictions on its use and redistribution. We do not consider these cases because the strategic issues involved differ significantly from those COSS firms face.
2Popular examples of open source software include the Linux operating system, Firefox browser, OpenOffice,
Apache Web Server, SugarCRM, and MySQL, among others. See http://www.sourceforge.net for a web-based repos-itory of open source applications.
3
We focus on the two types of licenses most common and relevant to the COSS industry: the GNU General Public License (http://www.gnu.org) and the Berkeley Software Distribution License (http://www.opensource. org/licenses/bsd-license.php). See Laurent (2004) for more discussion.
source software firms (Dedeke, 2009). How does a market in which firms face a strong incentive
to free-ride produce high quality products? Third, does making sharing mandatory result in the
creation of more features? Fourth, when is the “cancer” of free-riding, as Ballmer describes it, likely
to hurt firms and consumers? Despite the growing importance of the COSS industry, little extant
research examines firms’ competitive strategies in this novel setting. To address these questions, we
incorporate the unique aspects of this industry into a model and use it to analyze firms’ competitive
strategies to shed light on these empirical puzzles.
We provide a brief overview of the model and then discuss our key results in more detail. Our
model has two interacting markets: a product market consisting of COSS firms that sell software
products to consumers, and a developer market in which firms hire developers to create software
products.
The product market is a vertically differentiated duopoly of ex-ante identical software firms
that choose product quality and prices. A product’s quality is a function of two components:
features and usability. We consider two types of product market interaction, that are governed by
the terms of the open source license. In a private features market, a firm can freely use any open
source features and include them in its software product, without restriction. In contrast, under a
shared features market, features firms develop must be contributed to open source, so each firm also
gets access to the publicly available features the competition develops. A shared features market
enables each firms to free-ride on the features contributions of other firms. Usability improvements
are always kept private in both types of product market; firms do not have access to a competitor’s
usability components regardless of the license.
In the developer market, firms hire developers to create more functionality (features) for their
products. However, firms do not know whether a particular developer has the appropriate skill level
to firms by contributing features to open source. Open source contributions provide a credible signal
to firms about a developer’s skills because potential employers can review a developer’s contributions
(Leppamaki and Mustonen, 2009). Such a motivation to contribute is consistent with an economic
signaling rationale to explain developers’ open source contributions (Lerner and Tirole, 2002).
The interaction between the product and developer markets in equilibrium determines
develop-ers’ wages, the degree of open source software created by firms and through developdevelop-ers’ signaling, as
well as product qualities and prices. Developers’ wage expectations are influenced by the structure
of product market competition discussed above, and affect developers’ incentives to contribute to
open source. A higher expected wage increases open source feature contributions. Higher wages
affect firms’ decisions to develop more features, which has a feedback effect on the wage offered.
Equilibrium product quality balances developers’ incentives to contribute to open source and firms’
willingness to pay for marginal product improvements. Thus, understanding and modeling the
creation of open source software is critical to understanding the competitive product design and
pricing strategies of COSS firms.
We demonstrate how the puzzles raised earlier in this section result from the competitive
strate-gies of COSS firms across the product and developer markets, and compare the models’ equilibrium
outcomes in the shared features and private features markets. Our key results, mirroring the
puz-zles, are the following.
First, in the shared features market, we find that free-riding on features is supported in
equi-librium: the (ex-post) high-quality firm creates additional open source features, whereas the
low-quality firm does not. Both firms also develop some degree of usability. The high-low-quality firm
contributes to open source because the complementary nature of features and usability increases
the value of differentiating on usability, and both firms appropriate the benefits from quality
on the high-quality firm and its marginal value of additional features is lower, consistent with
em-pirical findings that the high-quality firm Red Hat contributes significantly more code to Linux
than competing vendors (Pal and Madanmohan, 2002; Software Development Times, 2008).
Sec-ond, diminished competition between firms in the developer market explains higher quality in the
shared features market, in conjunction with production efficiencies created by mandatory sharing.
Third, open source contributions can be higher in larger private features markets because
devel-opers expect higher wages from intense competition between firms for their skills, which increases
developers’ incentives to contribute to open source features. Fourth, both consumers and the
low-quality firm are unambiguously better off in the free-riding shared features market than in the
private features market. Under certain conditions, the high-quality firm may also earn higher
prof-its in the shared features market. Consumer surplus is higher with free-riding because of increased
price competition resulting from reduced product differentiation through common features.
Although we capture the most salient competitive factors in the COSS marketplace, we must
abstract away from several interesting issues, such as the voluntary provision of open source and
multi-product firms. We focus our study on firms’ strategies given a specific COSS market. We
discuss these limitations and ideas for future research in Section 6.
Our paper connects two distinct and previously separate streams of literature, especially in
modeling the interconnection between the product and developer markets. The product market
model is based on well-known work in marketing and industrial organization on strategic product
development with vertically differentiated firms (Shaked and Sutton, 1982; Moorthy, 1988). The
novelty in our setting is the combination of public and private goods that is a unique aspect of
COSS products, and thus it contributes to the nascent literature in co-creation of products by firms
and by a community of individuals working outside the traditional firm boundaries (Ramaswamy
from, several recent studies on open source, that have examined issues such as two-sided pricing of
operating systems and applications (Economides and Katsamakas, 2006) and dynamic competition
between open and closed source products (Casadesus-Masanell and Ghemawat, 2006). Neither
paper explores product design or the strategic interaction between open source firms, and our
work complements these two papers because we examine COSS products are based on open source
and compete with each other. Leppamaki and Mustonen (2009) assume a perfect market for
developers, ignore the multi-dimensional aspect of quality, and do not explore strategic interaction
between COSS firms. We leave to future research the possibility that firms could endogenously
choose whether to operate in one or more open source markets.
The second stream of literature helps in understanding why developers contribute to open
source software. The literature distinguishes between intrinsic motivation (including altruism, use
value, and similar factors) and extrinsic motivation (driven by market factors, developer status, and
potential wages), and finds extrinsic factors play a major role in developers’ decisions to contribute
(Roberts et al., 2006). Hars and Ou (2002) use direct surveys of developers to provide support
for signaling, and Fershtman and Gandal (2007) show that developers contribution more when the
license is more commercially oriented. Lerner and Tirole (2002) argue in a review article that much
of the evidence is consistent with an economic signaling motivation.4 Based on this work, we build
upon Spence (1973) to formulate the developer market as individuals signaling to demonstrate an
unobservable skill (or ability). We extend Spence’s model to include two types of signal spillovers:
developer-firm and firm-firm spillovers. We now provide a broad overview of the open source
industry to better understand the context of our study. 4
For anecdotal evidence, two apt examples can be found at http://www.odesk.com/blog/2008/02/ open-source-work-as-a-portfolioandhttp://blogs.techrepublic.com.com/opensource/?p=821.
2
The Open Source Industry
The open source movement gained prominence in the 1990s as a small community of expert
de-velopers who made the source code or “blueprints” to their programs freely available for anyone
to use and build upon. The growth of open source software has been rapid: market researcher
IDC (2007) estimates that the direct revenue in this market will grow to $5.8 billion in 2011; more
recent estimates suggest revenue from open source software will grow at a 22% compound annual
growth rate (IDC, 2009). In addition, open source software is increasingly being used as part of
commercial software. Large technology firms such as IBM, Sun Microsystems, and Hewlett Packard
have long recognized the importance of open source and have launched multi-billion-dollar open
source initiatives.5
Consumers find that the freely available open source software lacks usability and requires
sig-nificant expertise to use effectively (Lakhani and von Hippel, 2003). COSS firms add value to
open source by increasing the functionality or features and the usability, which are two distinct
dimensions of overall software quality:
1. Features: Provide new or enhanced features that extend the basic operations of the
soft-ware. For example, Sun’s StarOffice suite has additional features providing compatibility and
support for different document formats than the open source OpenOffice.
2. Usability & Support Services: Enhance the user’s ability to effectively use the product’s
available features. Usability enhancements often take the form of non-software services, such
as online help, technical assistance, documentation, packaging, and other support services.6
The distinctions between these dimensions of functionality and usability that contribute to
et al., 2003; Jung et al., 2004). An intuitive way to think about the difference is that expert users
are able to effectively use software with complex functionality and low levels of usability, but the
productivity of ordinary users increases with the usability of the software. For example, contrast
the ability of expert users of spreadsheet software to use custom macros to accomplish complex
tasks versus ordinary users’ interactions with the software through the menu-driven interface. The
distinction plays a key role in our model formulation, and we also incorporate the fact that creating
functionality is considered a highly-skilled endeavor. Developers who work on usability, known as
usability engineers, do not ordinarily work on open source software unless hired to do so by a firm,
which is consistent with the well-known lack of usability in open source projects (Lakhani and von
Hippel, 2003).
Numerous firms have adopted the COSS model, and COSS products now span a wide range
of applications from productivity suites to business intelligence to customer-relationship
manage-ment.7 Industry professionals clearly recognize that building upon open source is an important
business strategy (Goldman and Gabriel, 2005; Riehle, 2007). A prime example of a COSS firm is
Red Hat Inc. The company’s commercial version of the freely available Linux open source software
is designed to simplify and extend the management and administration of the Linux operating
system. Red Hat Linux operates under the GNU General Public License, which implies Red Hat
must make publicly available any feature contributions it makes to Linux but can keep private any
usability enhancements. Red Hat makes significant contributions to the Linux kernel, the Linux X
Windows System, the GNU Compiler Collection (GCC), and others, all of which are made public
under Linux’s license (Pal and Madanmohan, 2002; Software Development Times, 2008). Red Hat
provides additional services, such as extensive documentation, installation and maintenance, and
support programs, to customers who purchase their commercial product. 7
An exhaustive list of commercial applications based on open source can be found at Wikipedia, http://en.wikipedia.org/wiki/Commercial open source applications.
Thus firms may build upon open source, and the terms of the license govern whether COSS firms
can keep their features private or must make them publicly available. We address this distinction
in our model below.
3
Model – Private & Shared Features Markets
We model a duopoly of ex-ante identical firms competing in two separate but interconnected
mar-kets: the first is a product market in which consumers purchase software produced by the firms,
and the second is a developer market in which firms compete for developers.
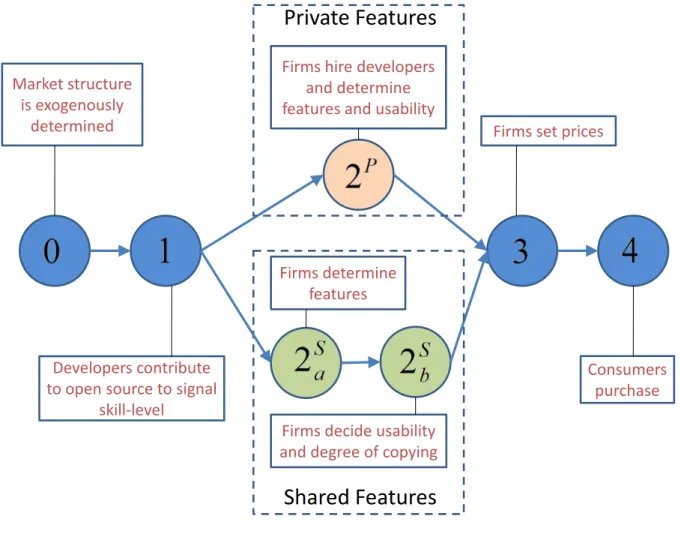
Figure 1 details the sequence of stages in our model, which includes both private and shared
features markets. Stages 0, 1, 3, and 4 are common to both types of product markets, whereas
stage 2P is only present in the private features market and Stages 2Sa and 2Sb are only present in
the shared features market. In Stage 1, developers choose whether and how much to contribute to
open source features to signal their skill levels. In the private features market, firms simultaneously
observe developer signals and make wage offers andall product development decisions in Stage 2P.
In the shared features market, firms observe developer signals and make wage offers andonlyfeature
development decisions Stage 2Sa, and then choose how much usability to develop and how many
features to copy from their competitor in Stage 2Sb. In Stage 3, firms set prices after observing
product qualities, and in Stage 4, consumers make their purchase decisions after observing all
qualities and prices. Table 1 summarizes our model’s notation, istinguishing between exogenous
model primitives and endogenous outcomes in the model.
3.1 Product Market
Consumers choose either to purchase one unit of software from one of the COSS firms or to not
het-Firms hire developers and determine features and usability
Firms set prices Market structure is exogenously determined Consumers purchase Firms determine features Developers contribute to open source to signal
skill-level
Private Features
Shared Features
Firms decide usability and degree of copying
Figure 1: Sequence of Stages in Model
Table 1: Notation for Main Constructs in the Model
Symbol Definition
Market Types
P, S Superscripts for private features and shared features markets
Model Primitives
M Market Size
cL, cH Cost of contributing one feature to open source for each developer type
cs Cost of developing one unit of usability
ηH(=η), ηL Productivity of high-type and low-type developers Equilibrium Strategies and Outcomes
pj, qj Price and quality of firmj’s product
fj, sj Number of developers hired and usability investment by firm j
Fj Number of features in firmj’s product
F0 Number of open source features due to developer contributions eL, eH Contribution to open source by low- and high-type developers
erogeneous in their preferences for quality, and a consumer indexed by θ has utility for a software
product of qualityq at pricep given by:
U(q;θ) =θq−p ,
Consumers’ marginal valuation for quality is distributed uniformly, θ∼ U[0, M], and its realized
value determines which product the consumer prefers. M is the market size or heterogeneity
parameter, and a higher value indicates a higher dispersion in consumer valuation for quality. Note
that the mass of consumers is fixed at 1 by the uniform distribution.
The qualityq of a software product depends on its level of featuresF and usabilitys. We follow
industry practice and view these dimensions as mutually exclusive (Boehm, 1981; Pressman, 2004).
Quality is defined by the production function:
q =Q(F, s) ,
A software product’s features define the set of tasks the product can help accomplish, whereas
usability refers to the ease with which a consumer can make use of the product’s features.
Con-sumers value both more features and greater usability. However, an abundance of features may
create an overly complex product, and consumers may not be able to take advantage of all the
features without usability. Conversely, a high level of usability is more beneficial in conjunction
with a large number of features.8 We therefore model these two dimensions of quality as (imperfect)
complements, implying ∂s∂F∂2Q > 0. A simple functional form that captures this complementarity
and is concave in both features and usability is Cobb-Douglas,Q(F, s) = (F ·s)14, which we use for
convenience. The above formulation of consumer preferences and product quality are common to 8In general, consumers do not benefit from products with a significant imbalance between their level of features
and usability. Thompson et al. (2005) show that consumers who purchase overly complex products face “feature fatigue” and that improving usability can help consumers effectively utilize the features.
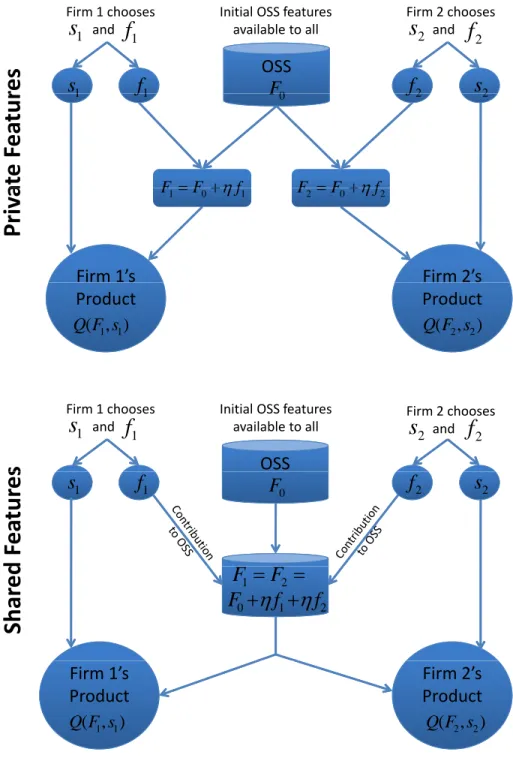
all markets. Figure 2 illustrates the structure of the product market: the upper panel depicts the
private features market in which both firms initially have access toF0features from the open source
community, and the lower panel depicts the shared features market in which firms contribute any
features they develop to open source.9 Firm j∈ {1,2} determines its product quality by hiringfj
feature developers and choosing a level sj of usability, and we denote the firm 1 as the firm with
overall higher quality, lettingq1 > q2 without loss of generality. Developers vary in their skill level
or productivity η ∈ {ηL, ηH}, with a developer producing η units of features when hired. The key
difference between the shared features market and the private features market is the formulation
for product quality. In the upper panel, firms in the private features market incorporate open
source features and only their own privately developed features into their products. In contrast,
the shared features market in the bottom panel shows that firms must contribute any features they
develop back to open source, which could subsequently become part of both firms’ products.
In the private features market, firm j’s product has Fj = (F0+ηfj) features. In the
shared features market, firms determine how much to copy from their competitor, denoted by
δj ∈[0,1] in Stage 2Sb. The number of features in the product is thusFj = (F0+ηfj+ηδjf−j).
In both markets, each firmj firm also develops the usability of the product to levelsj to make
the product’s functionality easier for consumers. The overall quality of firm j’s product depends
on whether features are private (P) or shared (S):
qjP =Q(Fj, sj) = [(F0+ηfj)sj] 1 4 and qS j =Q(Fj, sj) = [(F0+ηfj+ηδjf−j)sj] 1 4
The production costs in both cases include wages w paid to developers to create features, and to
enhance usability at a cost of cs per unit.10 The total fixed production cost C(f, s) is the sum of
9F0 is determined in equilibrium through developer signaling (discussed later in this section). 10
We focus on the labor market for feature developers because creating new functionality is a more specialized and challenging skill, whereas modeling usability as being exogenous is more realistic.
1
f
1s
f
2s
2 1s
f
1 Firm 1 chooses andOSS
0F
Initial OSS features
available to all
s
2 2f
Firm 2 chooses andres
1f
1F
0f
2 2ate
Fe
at
u
r
F F
f F F
fFirm
1’s
Firm
2’s
Priv
a
F1F0
f1 F2 F0
f2Product
Product
1 1( , )
Q F s
Q F s
( , )
2 2OSS
Initial OSS features
available to all
s
1s
f
1 Firm 1 chooses and 2s
f
2 Firm 2 chooses and 1f
1s
F
0f
2s
2d
Fe
at
u
re
s
1 2F
F
Shar
e
d
0 1 2F
f
f
Firm
1’s
Product
Firm
2’s
Product
1 1( , )
Q F s
Q F s
( , )
2 2feature development costs and usability creation costs and given asC(f, s) =w·f +cs·s.
3.2 Developer Market
Developers are heterogeneously distributed, and are either high-skilled (high-type) or low-skilled
(low-type). The cost of contributing to open source differs according to the developer’s type. To
contribute e features, high-types incur a cost of cH ·e and low-types incur cL·e, with cH < cL
indicating high-types face a lower cost.11 High-type developers have a reservation optionr ∼ψ(·),
with CDF Ψ(·) and support in the range [R,R], where 0¯ ≤ R< R.¯ 12 This option represents the
utility a developer derives from her current job, and she will accept a new wage offer only if it
exceeds r and the cost of signaling. Note that developers are heterogeneous in two dimensions:
their (discrete) skill levels and their (continuous) reservations wages.
After the signal successfully reveals the developer’s type or skill level, the developer can choose
either of the COSS firms, or an external market. The external market for high-skilled developers is
present because skills required to successfully contribute to open source can have useful applications
across many markets. For example, a developer who has contributed to a Linux open source project
can receive an offer from a firm such as Oracle that is not a primary competitor in the Linux market.
We capture by an external demandD(w) the degree of specificity of software skills the developer
can signal by contributing to the open source project. A low external demand indicates that the
skills signaled are very specific, whereas a high external demand indicates the opposite. Therefore,
the external demand, D(w), is a function of the market wage, and affects market outcomes only
in the sense that it affects the wage by creating an additional source of demand for high-skilled
developers. Note that the external market has no demand for developers who have not signaled, 11While we consider all features to be equivalent for the sake of expositional clarity, our results hold even when
developers contribute features that are heterogeneous in ‘quality’. The proof for this case is available from the authors.
12
No further assumptions on the functional form of Ψ are required for our results. We use the general form in our description since it helps in presenting and interpreting different effects.
since their skill level is uncertain.
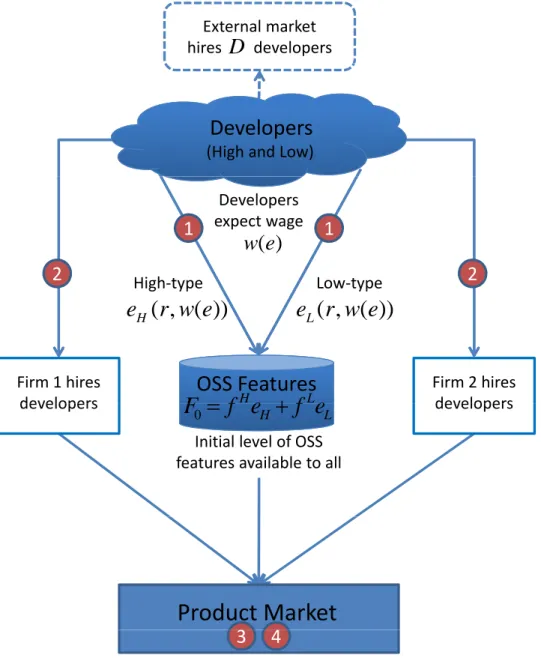
Figure 3 displays the developer market and its link to the product market. The numbers
correspond to the stages in the game outlined in Figure 1. Developers form expectations about
wages based on the market, and contribute to open source to signal their skill level to firms (Stage
1). These contributions are publicly observable, and firms use them to evaluate developers’ skills
and make wage offers to developers (stages 2P and 2Sa).13 Firms simultaneously hire developers,
and in doing so, they choose their product’s level of features.
Low-type developers may attempt to masquerade as high-type developers to convince firms
to hire them. Open source projects have gatekeepers who screen for low-quality code and decide
which submissions to accept, implying that high-type developers have a lower cost of contribution
(Bagozzi and Dholakia, 2006). To simplify our exposition, we make two assumptions: low-type
developers have reservation option RL≥0, and are not productive to COSS firms when hired, i.e
ηL= 0. These assumptions make hiring the low-types unprofitable.14
If firms could observe a developer’s skill level, they would base the wage on this observation.
However, when the wage is unobservable, it is dependent on the contribution to open source e,
denoted w(e). A developer of type t ∈ {L, H} contributing e features receives utility ut(w, e) =
w(e)−cteand her optimal contribution level is:
et= arg max
e w(e)−cte , (1)
13
Firms’ wage offers are consistent with developers’ beliefs in equilibrium.
14We only require that at the equilibrium wage, the marginal increase in a firm’s profits from hiring an incremental
low-type developer is sufficiently low. This condition would be met if ηL>0 but still low enough for firms to not
External market hires
D
developersDevelopers
(High and Low)
Low‐type High‐type Developers expect wage
( )
w e
1
1
2
g yp yp2
( , ( ))
Le r w e
( , ( ))
He
r w e
Firm 1 hiresdevelopers
F
OSS Features
OSS Features
f e
H
f e
LFirm 2 hires developers developers
Initial level of OSS features available to all
0 H L
F
f e
f e
developersProduct
Market
3
3
4
Note: The numbers in the diagram correspond to the stages of the game, as
outlined at the beginningg g of Section 3.
subject to the incentive compatibility (IC) and individual rationality (IR) conditions:
(ICH) :w(eH)−cHeH ≥w(eL)−cHeL (IRH) :w(eH)−cHeH ≥r (2)
(ICL) :w(eL)−cLeL≥w(eH)−cLeH (IRL) :w(eL)−cLeL≥0.
To ensure separation, high-type developers must find exerting a high level of effort (ICH) to be
incentive compatible and must be sufficiently compensated to work for the COSS firms compared
with her reservation option (IRH). Low-type developers must find imitating the high-type
devel-opers (ICL) to be prohibitively expensive. The IR constraint for the low-type is trivially
satis-fied. Firms do not find hiring low-type developers at any positive wage to be optimal after their
type is credibly revealed. The condition in ICL reduces to 0 ≥ w(eH) −cLeH when low-type
developers do not contribute. Among high-type developers, those with reservation values below
a threshold, r ≤ w(eH) −cHeH, choose to signal, whereas others with higher reservation
op-tions, r > w(eH)−cHeH, do not signal. Thus the number of high-type developers who signal is
f0H = Ψ(w(eH)−cHeH).
This condition characterizes the supply of developers available for hire either by the firms or by
the external market. Given an arbitrary wage w, the initial level of open source features available
in Stage 1, F0(w), is a function of the number of developers and their contributions:
F0(w) =f0eH = Ψ(w(eH)−cHeH)eH. (3)
Although the IR and IC conditions are necessary, they are not sufficient to determine wage, which
depends on the interaction between the product market and developer market, which respectively
3.3 Discussion and Comparison
We compare the current setting with the canonical model of Spence (1973), in which workers
signal through investments in education to a market of perfectly competitive firms, and capture all
surplus. In our model, developer contributions to open source features serve as signals to COSS
firms seeking to hire high-skilled developers. We build upon Spence (1973) in two primary areas,
thereby making the model applicable to a broader range of settings. First, our model considers
an imperfectly competitive, vertically differentiated duopoly in which firms earn positive profits—
developer heterogeneitywithin types and different marginal productivity of developers implies that
firms only make wage offers based on the marginal value of the last feature to them. Thus, the
diminishing marginal valuation of consumers for quality allows both firms and developers to earn
a surplus.
Second, the signaling contributions have two types of spillover effects: developer-to-firm
spillovers and firm-to-firm spillovers. In developer-to-firm spillovers, contributions developers make
in Stage 1 server as substitutes for firms’ feature contributions. The more developers contribute to
open source due to signaling, the less intensely firms compete for them, which acts to diminishes
the wage. In the shared features market, firm-to-firm spillovers occur because the feature
contri-butions from each firm are available to the competitor. As a result, firms compete less intensely
for developer talent because the firms realize they can fully appropriate the features developed by
their competitor.
In contrast, Spence’s model of education signaling does not consider either imperfect
competi-tion or spillover effects of either kind that we have conceptualized. In our model, signaling by a
developer not only affects that developer’s utility and the COSS firm that hires him, but it also
critically changes the strategic interaction between the COSS firms in the market, and we believe
in signaling settings. These conflicting incentives create a critical and unique link between the
product and developer markets, and we proceed next to analyze the properties of the interlinked
equilibrium in these markets.
4
Equilibrium Analysis
We analyze the subgame-perfect equilibrium of the model by backward induction, beginning with
the choices consumers make and the pricing subgame in Stage 3. We then move to the product
development decisions in stages 2P or 2Sa/2Sb, and finally to the developer signaling game in Stage 1.
Intermediate results that are not central to our analysis appear as Lemmas in the Online Appendix.
4.1 Pricing Equilibrium
The pricing subgame in Stage 3 applies to all cases of the product market, and borrows significantly
from Moorthy (1988). We define consumerθ12as indifferent between firm 1 and firm 2’s products,
so that all consumers with higher value for quality, i.e. θ > θ12would prefer firm 1’s product. θ12is
determined by the indifference condition,θ12·q1−p1=θ12·q2−p2. Similarly, we define consumer
θ20 who is indifferent between purchasing firm 2’s product and not purchasing any product, such
that θ20q2 −p2 = 0. Note that all consumers θ s.t. θ20 < θ < θ12 choose to purchase firm 2’s
product over firm 1’s product or the no-purchase option. The market shares for the firms are then
determined to be: m1 = 1 M (M −θ12) = 1 M M −p1−p2 q1−q2 and m2= 1 M (θ12−θ20) = 1 M p1−p2 q1−q2 − p2 q2 .
Revenues are determined from the above market shares and prices, and firms set prices to
firms’ products: p∗1= arg max p1 M−p1−p2 q1−q2
p1 and p∗2 = arg max
p2 p1−p2 q1−q2 − p2 q2 p2 .
The optimal price for each firm is a best response of the price the other firm sets and depends on
the quality levels of both products, and the optimal revenues are a function only of product quality
levels chosen by the firms.
At this stage, we note that firm revenues, prices, and the consumer surplus are represented
solely as functions of product quality levels and the market size. Next we characterize the product
design choices concerning features and usability, and evaluate how that affects product quality.
4.2 Product Quality Equilibrium
Firms determine their product features by hiring developers and making usability investments,
both of which contribute to product quality. The product strategy subgame begins with Stage 2P
for the private features market and at Stage 2S
a for the shared features market. We characterize the
partial-equilibrium behavior by the COSS firms given the wage (w) and freely available open source
features (F0). The profit functions are derived by substituting the feature and usability levels into
the revenue functions and accounting for the costs of development.
The solution of the sub-game in Stage 2P for the private market andsStages 2Sa and 2Sb for the
shared features market requires the firms to strategically determine the optimal mix of features and
usability, which in turn determines overall quality. In the shared features market, the potential for
free-riding on features leads to decreased product differentiation and increased price competition,
making it unclear whether any firm will contribute to features in equilibrium or whether each firm
will find free-riding on the contributions its competitor makes to be more profitable.
F0initial open source features, and with firmsj∈ {1,2}differentiated on the basis of product quality
is characterized by the level of features, usability, and overall quality, depending on the market type:
Private Shared sPj =πSjM2qcη s3w s S j =ψ Q j M2 q η cs3w fP j =πFj M2 q η csw3 − F0 η f1S =ψF1M2 q η csw3 − F0 η , f2S= 0 qPj =πjQMqcη sw q S j =ψ Q j M q η csw
In the shared features market, each firm fully copies its competitor’s features, such thatδ1=δ2 = 1.
The constants πS, πF, and πQ for the private features market and ψS, ψF, and ψQ for the
shared features market are defined in the Online Appendix.
There are several points to note here. First, in the private features market, both firms create
features in addition to the F0 features available from open source. An increase in open source
featuresF0 leads firms to reduce the number of features they develop because they are substitutes.
We find that firms differentiate their products more on the less expensive dimension of quality,
implying that if features are less expensive to produce, the firms will differentiate more on features
(f1−f2 > s1−s2). Intuitively, firms differentiate their products more on the dimension that yields
a greater return to such differentiation.
Second, the implication in Stage 2Sb of the shared features market is that both firms fully
copy their competitor’s features. A partial copying strategy might seem optimal because it would
create more product differentiation. To understand the intuition behind this result, consider each
firm’s incentives separately. For the high-quality firm, copying more is always preferred since doing
so increases the firm’s own quality and the degree of quality differentiation (q1−q2) between the
firms. For the low-quality firm, copying increases its own quality but reduces quality differentiation.
copying, the low-quality firm invests less in usability, fully coping features from the high-quality
firm is advantageous.
We find that only the high-quality firm develops features beyond the open source features
F0 available due to developer contributions. The low-quality firm completely free-rides on the
features the high-quality firm provides. Why does the high-quality firm develop a positive level
of features? The intuition comes from the fact that the quality dimensions are complements,
implying consumers’ marginal utility of usability is increasing in the level of features. Although
features do not contribute directly to product quality differentiation, they do magnify the effect
of usability differences between the firms. Note that the low-quality firm invests less in usability
than the high-quality firm, and the high-quality firm develops features to enhance the degree of
product differentiation, which results from having a higher usability product. Thus the increase in
the differentiation from usability makes creating features that reduce the intensity of competition
worthwhile.
The product market outcome in the shared features market above has a critical implication
for the developers’ market, which we examine in the next section: only the high-type firm hires
developers, because the low-type firm does not develop features (f2 = 0), and only the external
market offers an alternative to developers who signal.
4.3 Developer Market Equilibrium
The wage influences firms’ demand for developers, the number of developers willing to signal, and
the level of their contributions to open source in Stage 1. The equilibrium wage must balance
firms’ demand for developers with the supply of developers who are willing to enter the market
by signaling. We focus on separating equilibria where high-type and low-type developers make
For a separating equilibrium in the signaling game, we identify conditions on wages that lead
to positive contributions by some high-type developers and that ensures low-type developers do
not find imitating them to be profitable. The following result provides the necessary conditions
for a least-cost separating (LCS) equilibria in terms of the wage and open source contributions.
The contributions and beliefs that correspond to the least cost separating equilibrium, including the
out-of-equilibrium beliefs that satisfy the Intuitive Criterion (Cho and Kreps, 1987), help determine
a unique equilibrium, to which we restrict further attention.15
Proposition 2. [Developer Market Separating Equilibrium] In the least-cost separating
(LCS) equilibrium, both the number of high-type developers contributing to open source, as well
as the number of features contributed by each developer increases with the wage.
Note that this result is independent of the type of product market. The contribution decisions
of both types of developers determine the minimum amount of contribution required for separation,
eLCS(w) = cw
L. The higher the wage, the more incentive there is for the low-type developers to
masquerade as high-type, and therefore the latter must contribute even more features to make it
unattractive for the former to masquerade. High-skilled developers with low reservation or outside
options, i.e. r < rLCS(w) = w−cHeLCS(w) = w
1− cH
cL
choose to signal, implying that the
number of high-type developers who signal is f0LCS = Ψ(rLCS) = Ψ(w−cHeLCS(w)). Thus, as
the wage increases the number of high-type developers who will find contributing to open source
relatively more attractive compared to their current reservation option increases as well.
The number of open source features produced in Stage 1 is the product of the number of
develop-ers who signal and each developer’s contribution,F0LCS(w) =f0LCSeLCS(w) = cw
LΨ w 1−cH cL .
This result allows us to focus on the (expected) wage level that determinesF0. We restrict further 15
Signaling models often admit a multiplicity of equilibria, and we use the Intuitive Criterion to refine “unreason-able” equilibria. In our context, least-cost refers to the minimum separation required at each prevailing wage. This
attention to LCS equilibrium outcomes and drop theLCS superscript.
5
Market Interaction and Comparison
In the previous results, we separately examined the working of the product market competition
involving firms and consumers as well as the developer market involving firms and developers. We
integrate these two sides of the overall market to understand competitive product strategy across
private features and shared features markets. The key connection between the markets is the wage
for developers, which determines how many features are produced for inclusion in the products.
The equilibrium wagewP orwS equates the overall demand for developers, formed by the firms’
demand and the external demand D(w) for developers with the aggregate supply of developers
who prefer signaling to their reservation option. We denote the excess demand functionsξP for the
private features market and ξS for the shared features market for developers at wage wto be
ξP(w) =D(w) +M2q η csw3 π F 1 +π2F −2cw LΨ wh1−cH cL i −Ψ w 1−cH cL ξS(w) = D(w) | {z } External Demand +M2 r η csw3 ψF1 − w cL Ψ w 1−cH cL | {z } COSS Demand=f1+f2 −Ψ w 1−cH cL | {z } Developers Signaling (4)
Equating the excess demand to zero determines the equilibrium wage in either case. Below this
wage level, fewer high-type developers will contribute to open source than firms are willing to hire,
and above this wage level, more developers will be inclined to contribute than firms will want to
hire. Thus the equilibrium wage serves to balance the signaling incentives of developers and firms,
and we examine its comparative statics with respect to the market size, the cost of signaling, and the
cost of producing usability. The implicit equations ξP(wP) = 0 or ξS(wS) = 0 for private features
and shared features markets, respectively, determine the equilibrium wagewP orwS.
(i) The wage in the shared features market is lower than in the private features market,wS < wP.
(ii) In both markets,wsatisfies the following properties: wis increasing in market size(∂M∂w >0),
signaling cost (∂c∂w
H > 0), and skill-level (
∂w
∂η > 0), and decreasing in the cost of usability,
(∂c∂w
s <0).
In (i), we find that the equilibrium wage is lower in the shared features market because of
free-riding between the firms. We find from Proposition 1 that f2 = 0 in the shared features market
independent of the wage paid to developers, and that firm 2 chooses to completely free-ride, and
copy firm 1’s features. The effect of free-riding is reduces competition between the firms in the
developer market, leading to lower developer wages, which in turn leads to fewer open source
features produced in Stage 1.
Examining the comparative statics in (ii) above, we find that the wage increases with the market
sizeM because a larger market causes firms to invest more in creating a higher-quality product and
competition between firms drives wages higher. The wage is higher when producing usability is less
expensive, because a low cs permits firms to invest more in usability. A higher level of usability
raises the value of complementary features for consumers, and firms invest more in features, thereby
raising developer wages. When signaling is costly for the high-type developers, fewer signal and
more choose their reservation options, resulting in fewer open source features, and this diminished
supply raises wages.
We next examine the provision of open source features, which is of interest to expert users
as well policy makers and initial creators of open source projects, who may seek to maximize the
amount of publicly available features.
Proposition 4. [Creation of Open Source] The creation of open source features is higher
In the shared features market, both firms have access not only to the contributions to open
source high-type developers make, but also to the features the high-quality firm develops. In
contrast, the private features market allows firms to keep their features private, leaving only the
signaling contributions to features as open source, leading us to expect fewer open source features.
However, when the consumer market is large, producing a higher-quality product is of greater value,
and firms compete for developers more intensely in the private features market. This effect raises
the incentive for high-type developers to separate themselves from low-type developers. When
separation is relatively easy (cH is small compared with cL), more high-type developers enter the
market and more developers contribute to open source features.
The level of open source features, along with firm decisions, impacts overall product quality, to
which we turn our attention.
Proposition 5. [Product Quality] Comparing the markets we find:
(i) The private features market provides the lowest-quality level.
(ii) For small market size and low signaling costs, the private features market provides the highest
quality product.
(iii) The usability ratio s1
s2 is always larger for the shared features market than the private features market, and the features ratio f1
f2 is larger under the private features market. The quality dif-ferentiation ratio q1
q2 captures is higher for the private features market than the shared features market.
The low-quality firm’s quality is always higher in the shared features market since the firm
is able to free-ride on the features the high-quality firm provides. This effect holds even when
the low-quality firm develops a lower level of usability than in the private features market, and is
The effect of the product market type on the high-quality firm’s quality level is more nuanced:
it depends on the market size, signaling cost, and cost to develop usability. If the wages were
the same, the private features market would offer the highest quality product. Recall, however,
that wP > wS, and the difference between the wages is closest when competition between firms
for developers is not as intense. Lowwer competition for developers could result from a smaller
market opportunity. When the market size is large, demand for developers rises and the cost of
developing a higher quality product and the equilibrium wage increases. These wage effects are
stronger for the private features market than in the shared features market, and the quality level
the high-quality firm chooses can become higher in the shared features market. When the signaling
cost is higher for the high-type developers, this also leads to increased competition that amplifies
the competition between the firms for developers in the private features market.
The marginal benefit of usability increases with the level of public contribution of features,
which implies that more signaling by developers increases the firms’ incentives to develop usability.
In the shared features market, firms differentiate more on usability since it is the only means of
differentiation, but this differentiation is insufficient to overcome the fact that both products have
the same level of features, and the quality differentiation in the shared features market is therefore
lower.
Next, we evaluate the level of surplus consumers and firms obtain in both markets.
Proposition 6. [Profits and Consumer Surplus] Examining the creation and distribution of
surplus across firms and consumers, we find that:
(i) The high-quality firm can make a higher profit under the shared features market.
(ii) Consumer surplus is higher in the shared features market than in the private features market
The high-quality firm may make a higher profit because a larger external demand induces a
broad base of developers contributing to open source, which increases the developer-firm spillover,
but reduces the firm-firm spillover (free-riding on features). In such a situation, the high-quality
firm can do better under a shared features market.
The consumer surplus result in (ii) is surprisingly general and counterintuitive: a reduction in
firm competition for developers increases surplus to consumers. The reasoning is that both the
utility of the signal (open source features) used in the products the firms develop and decreased
competition in the developers market due to free-riding on features by the low-quality firm serve
to benefit consumers. Thus, contrary to Ballmer’s notion that a mandatory sharing license is a
“cancer that attaches itself,” we find such a requirement may benefit both consumers and firms.
6
Conclusion, Limitations, and Further Work
The commercial open source software market is growing rapidly and has many strategic
ramifica-tions for the regular software market (Economist, 2009). The ability of firms to leverage open source
alters product design decisions more than the standard settings in which a product’s components
are entirely proprietary. We construct a two-sided model of the commercial open source market
in which firms compete in a product market and a developer market. Developers contribute to
open source to signal their skill-level to firms, which determines the level of open source available
to firms for their products. Firms hire developers to build their products, and then they compete
in a vertically-differentiated market for consumers. We compare equilibrium outcomes under two
common types of open source licenses. We believe our framework can help marketing scholars
un-derstand an area with significant conceptual differences that have a strong impact on competitive
marketing strategies and that determine the amount of the public good created in the first place.
whether to operate in multiple open source markets at the same time.
Our model helps rationalize several puzzles observed in the industry, such as why Red Hat
contributes significantly more to Linux than any other firm and why a market with mandatory
sharing can actually produce higher-quality products than a proprietary market. We show that the
mandatory sharing of feature contributions between firms can actually raise profits and consumer
surplus, and that firms in a market that enables free-riding may product higher-quality products,
compared with a market in which firms may privately appropriate investments. Our model also
extends prior work on modeling signaling on the job market (Spence, 1973), by including two types
of spillovers: developer-firm and firm-firm, and we demonstrate how firms and consumers benefit
from these spillovers.
As usual, conducting such an analysis in the context of a formal model entails making numerous
simplifying assumptions and abstractions, which we discuss here, and we evaluate several dimensions
along which the current paper may be extended.
First, the market structures we examine in this paper are not an exhaustive list of all the types
of markets associated with open source, including cases in which firms develop proprietary software,
and voluntarily release the source code—for example, MySQL, a database product, that released its
source code and permits users to modify it for non-commercial purposes but requires a negotiated
licensing agreement for commercial applications.
Second, firms face a variety of “market entry”-type decisions, including whether to enter specific
markets, which is likely to depend on firm resources, experience, and capabilities our model does
not capture but that would be interesting aspects for further study. A firm may face the choice of
entering one of multiple open source markets (e.g., private features vs. shared features markets);
which market should it enter? If these markets are distinct and the firm ignores its competitor’s
Third, the incentives for firms to contribute to open source are more complicated in
multi-product or forward-looking settings. One reason a multi-multi-product firm may contribute to open
source is that such contributions could weaken a competitor in another market. This theory implies
one motivation behind IBM’s contributions to Linux, or Sun’s contribution to OpenOffice, could be
a desire to reduce Microsoft’s market dominance (and revenues) and to enable each firm to compete
more effectively.
Fourth, we abstract away from any horizontal differentiation in open source products. Firms
may develop software that is not general purpose, but targeted at a specific niche of users. For
example, some versions of Linux target the embedded or mobile device market, where the focus
may be on low-power computation rather than access to high-power functionality.
In summary, the market for software built upon open source is growing rapidly, and open
source has recently made the leap to mobile computing platforms with the release of the Google
Android operating system. In the mobile market, hardware manufacturers produce smartphones
based on Android, and release the source code in a setting that closely the shared features market
in our model. Our setting naturally extends to evaluating and understanding the competition
between manufacturers in the handset market. Overall, we expect the open source market to
attract significant attention from researchers in the future who want to examine the unique aspects
References
Abran, Alain, Adel Khelifi, Witold Suryn, Ahmed Seffah. 2003. Usability meanings and interpre-tations in iso standards. Software Quality Journal 11 325–338. URL http://dx.doi.org/10. 1023/A:1025869312943. 10.1023/A:1025869312943.
Bagozzi, R. P., U. M. Dholakia. 2006. Open source software user communities: A study of partici-pation in linux user groups. Management Science 52(7) 1099–1115.
Boehm, B. W. 1981. Software engineering economics. Prentice-Hall Englewood Cliffs, NJ.
Casadesus-Masanell, R., P. Ghemawat. 2006. Dynamic mixed duopoly: A model motivated by Linux vs. Windows. Management Science 52(7) 1072–1084.
Cho, I. K., D. M. Kreps. 1987. Signaling games and stable equilibria. Quarterly Journal of Economics 102(2) 179–221.
Dedeke, A. 2009. Is linux better than windows software? IEEE Software 26(3) 104, 103.
Economides, N., E. Katsamakas. 2006. Two-Sided competition of proprietary vs. open source technology platforms and the implications for the software industry. Management Science 52(7) 1057–1071.
Economist. 2009. Born free: open-source software in the recession. May 28.
Fershtman, C., N. Gandal. 2007. Open source software: Motivation and restrictive licensing. International Economics and Economic Policy 4(2) 209–225.
Gartner Group. 2008. Gartner highlights key predictions for it organisations and users in 2008 and beyond .
Goldman, R., R. P. Gabriel. 2005. Innovation Happens Elsewhere, First Edition : Open Source as Business Strategy. Morgan Kaufmann.
Hars, A., S. Ou. 2002. Working for free? motivations for participating in open-source projects. International Journal of Electronic Commerce 6(3) 25–39.
IDC. 2007. Worldwide open source software business models 2007-2011 forecast: A preliminary view, Pub ID: IDC1516672.
IDC. 2009. Worldwide open source services 2009-2013 forecast, Pub ID: IDC219918.
Jung, H. W, S. G Kim, C. S Chung. 2004. Measuring software product quality: A survey of ISO/IEC 9126. Software, IEEE 21(5) 88–92.
Lakhani, K. R., E. von Hippel. 2003. How open source software works: “free” user-to-user assis-tance. Research Policy 32(6) 923–943.
Laurent, L. S. 2004. Understand Open Source and Free Software Licencing. O’Reilly, Cambridge, Massachsusetts.
Leppamaki, M., M. Mustonen. 2009. Skill signalling with product market externality. Economic Journal 119(539) 1130–1142.
Lerner, J., J. Tirole. 2002. Some simple economics of open source. Journal of Industrial Economics
50(2) 197–234.
Moorthy, K. S. 1988. Product and price competition in a duopoly.Marketing Science7(2) 141—168. New York Times. 2003. How Microsoft Warded Off Rival. May 15.
Pal, N., T. R. Madanmohan. 2002. Competing on open source: Strategies and practise URL http://opensource.mit.edu/online\_papers.php.
Pressman, R. B. 2004. Software Engineering: A Practitioner’s Approach. McGraw-Hill New York, NY.
Ramaswamy, V., F. Gouillart. 2010. The Power of Co-Creation: Build It with Them to Boost Growth, Productivity, and Profits. Free Press.
Riehle, D. 2007. The economic motivation of open source software: Stakeholder perspectives. Computer 40(4) 25–32.
Roberts, J. A., I. Hann, S.A. Slaughter. 2006. Understanding the motivations, participation, and performance of open source software developers: A longitudinal study of the apache projects. Management Science 52(7) 984–999.
Sawhney, M., G. Verona, E. Prandelli. 2005. Collaborating to create: The internet as a platform for customer engagement in product innovation. Journal of Interactive Marketing 19(4) 1–15. Shaked, A., J. Sutton. 1982. Relaxing price competition through product differentiation. Review
of Economic Studies 49(1) 3–13.
Software Development Times. 2008. September 2008. Red Hat tops list of corporate Linux code contributors.
Spence, M. 1973. Job market signaling. Quarterly Journal of Economics 87(3) 355–374.
Thompson, D. V., R. W. Hamilton, R. T. Rust. 2005. Feature fatigue: When product capabilities become too much of a good thing. Journal of Marketing Research 42(4) 431–442.
Mathematical Appendix for
Competitive Strategy for Open Source Software
Vineet Kumar, Brett Gordon and Kannan Srinivasan
Appendix A: Proofs
Denote the uniform pdf andcdf of θ∼U[0, M] byg(θ) = M1 and G(θ) = Mθ.
Lemma 1. In a vertically differentiated duopoly with quality levels q1 and q2, with q1 > q2, the
optimal prices are set at: p1(q1, q2) = 2M q1(q1 −q2)
4q1−q2 and p2(q1, q2) =
M q2(q1−q2)
4q1−q2 . The revenues of the firms are R1(q1, q2) = 4M q
2 1(q1−q2)
(4q1−q2)2 and R2(q1, q2) =
M q1(q1−q2)q2
(4q1−q2)2 . The consumer surplus is
CS(q1, q2) = M q2
1(4q1+5q2)
2(4q1−q2)2 .
Proof of Lemma 1. The product qualities, prices, and the choices of consumers determine the
revenues as follows: R1 =p1(M−θ12) and R2 =p2θ20. Firms focus only on revenue to set prices,
as quality choices are determined (sunk) in the prior stages. The FOCs with respect to price are
∂R1 ∂p1 p1,p2 =M − p1 q1−q2 −p1−p2 q1−q2 = 0,∂R2 ∂p2 p1,p2 = p1−p2 q1−q2 +p2 −1 q2 − 1 q1−q2 −p2 q2 = 0
Solving these FOCs simultaneously, we obtain
p1(q1, q2) = 2M q1 q1−q2 4q1−q2 and p2(q1, q2) = M q2(q1−q2) 4q1−q2
Substituting these prices in the revenue functions, we obtain the expressions in the proposition. The consumer surplus with these quality levels is:
CS(q1, q2) = Z θ12 θ20 (θq2−p2)g(θ)dθ+ Z M θ12 (θq1−p1)g(θ)dθ= M 2 q21(4q1+ 5q2) (4q1−q2)2
Lemma 2. [Quality Decomposition] The optimal level of features and usability to contribute to a quality target qj for firm j when the first stage produces F0 features due to developers’ signaling
actions is as follows: fj = r cs wηq 2 j − F0 η , s= r w csη q2j, and C(qj) = 2 r wcs η q 2 j −w F0 η (1)
where fj and sj are the optimal levels of features and usability, and C(q) is the minimum cost of
obtaining quality q.
Proof of Lemma 2. The firm’s problem is (f, s) = argminf,swf +css subject to the constraint
((F0+ηf)s)
1
4 =qcan be transformed toCf(f) =wf+cs q
4
F0+ηf and its solution is arg minf≥0wf+
cs q
4
F0+ηf. The interior solution yields f(q) = q
2qcs ηw − F0 η and s(q) = q 2q w ηcs. The necessary
condition for a corner solution f = 0 to hold is that: ∂Cf
∂f f=0 > 0 =⇒ w−ηcs q 4 F0+ηf f=0 > 0
=⇒ wF02 > ηcsq4; that is, the wage must be above a certain level.1 Thus, if wages are not
excessive, we will always have an interior solution given by the proposition, and we focus on that
situation. The overall cost of providing qualityqwith an interior solution isC(q) =wf(q) +css(q),
soC(q) = 2qwcs
η q2−w F0
η .
Proof of Proposition 1. We consider the two markets separately because the different strategic interactions imply that similar proof methods will not work in both cases.
Private Features Market. The quality decomposition result from Lemma 2 implies we can re-duce the duopoly market competition in the private features market as represented by the following
profits (note thatF0 is exogenously fixed for Stage 2):
Π1(q1, q2) = 4M q2 1(q1−q2) (4q1−q2)2 − 2 rwc s η q 2 1−w F0 η Π2(q1, q2) = M q1(q1−q2)q2 (4q1−q2)2 − 2 rwc s η q 2 2−w F0 η
The quality best responses for each firm is given by the solution to these FOCs:
∂Π1 ∂q1 = 2M q1 8q 2 1−6q2q1+ 4q22 (4q1−q2)3 −2cq1 = 0 and ∂Π2 ∂q2 = M q 2 1(4q1−7q2) (4q1−q2)3 −2cq2= 0 wherec= 2qwcs
η . Solving these FOCs focusing on positive real solutions, we obtainq1 =
M φ1 2 q η wcs and q2 = M φ22 q η
wcs, where φ1 and φ2 are constants.
2 Using these and the optimal quality
decom-position results from Lemma 2, we obtain the stated results. The constants for the shared features market are: πQj = φj 2 , π F j =πSj = φ2 j 4
We next show that no symmetric equilibria of the product design subgame exist. Consider any potential symmetric equilibrium characterized by the equilibrium features and usability outcomes
f1 = f2 = f∗ and s1 = s2 = s∗, implying q∗1 = q2∗. With equal quality levels, the firms will
charge equal prices (Lemma 1), and obtain half the market. If the firms charge different prices (say p1 > p2), all consumers will prefer firm 2’s product since the qualities are equal. Further, we
demonstrate that both firms charge zero prices. If either firm charges p0 > 0, its competitor can
obtain the entire market by offering a price ofp00=p0−, where >0 is a small deviation. Recall
1This condition at the equilibrium quality level for firm 2, that isq
2=φ2M q η csw and reduces towF 2 0 > φ4 2η3M4 cs . Observe that the LHS is increasing inw.
2The constants are the positive real solutions to the polynomials below:
(φ1) −128 + 1168x−31111x2+ 235824x3= 0
that sunk product development costs do not affect pricing in Stage 3. Therefore, firms must set zero prices and earn zero revenue and have positive costs in any symmetric pricing equilibrium. We prove by contradiction that a symmetric product development equilibrium cannot exist. Suppose
we have a symmetric equilibrium with (f∗, s∗) being the equilibrium strategies of both firms.
Con-sider a deviation by firm 2, setting s2 =s0 =s∗−δ, where δ >0 is a small deviation. Firm 2 can
obtain higher revenues by part (i), and have lower development costs, thereby increasing profits beyond the symmetric equilibrium outcome. Thus, no symmetric equilibrium exists.
Shared Features Market. For the shared features market, recall that the timing is different
than the private features market. The firms in Stage 2Sa determine the features in the shared market
and the decisions concerning usability levels in which to invest as well as the decision concerning
what fraction of features to copy from the competing firm are made in Stage 2Sb, which follows
Stage 2Sa. We begin with the analysis of stage 3 and 4, which are identical in both markets, and the
pricing is derived as a function of the firms’ quality levels. Next, the backwards induction process
begins with Stage 2Sb, where the firms know each other’s features levels, and decide simultaneously
on both usability (s1,s2) and the degree of copying (δ1, δ2 ∈[0,1]). We detail the profit functions
for the subgame beginning at Stage 2Sb to be:
Π(2 S b) 1 =−s1cs+ 4√F1M √ s1(4 √ F14 √ s1−4 √ F24 √ s2) (√4F 24 √ s2−44 √ F14 √ s1)2 Π(2 S b) 2 =−s2cs+ 4 √ F14 √ F2M4 √ s14 √ s2 4 √ F14 √ s1− 4 √ F24 √ s2 4 √ F24 √ s2−44 √ F14 √ s1 2
Observe that at Stage 2Sb, the features levels contributed by both firms f1 and f2 are fixed and
exogenous, but the level of features in the firm’s products denoted byFj are not fixed since they
depend on the copying strategies, i.e. Fj = (F0+ηfj+ηδjf−j). We take the derivative w.r.t. δ1
to find ∂Π (2S b) 1 ∂δ1 = f2M √ s1η 4√s1 p η(f2δ1+f1) +F0−34 √ s14 √ s24 p η(f1δ2+f2) +F04 p η(f2δ1+f1) +F0+ 2 √ s2 p η(f1δ2+f2) +F0 p η(f2δ1+f1) +F0 4√4s 14 p η(f2δ1+f1) +F0− 4 √ s2 4 p η(f1δ2+f2) +F0 3
The denominator is clearly positive, and we demonstrate that the numerator is also positive. The
numerator can be rewritten as: f2M
√ s1η 4q21−3q1q2+ 2q22 = f2M √ s1η h (2q1−q2)2+q1q2 i ,
which is always positive since q1, q2 >0. Note this inequality is true no matter what the values of
δ1 and δ2 are. We therefore find that ∂Π
(2Sb) 1
∂δ1 >0 at all values of the quality levels, implying there
is no interior solution where δ1 < 1. Therefore, the corner solutionδ1 = 1 is the best response of
Consider the FOC for firm 2 with respect to δ2: ∂Π(2 S b) 2 ∂δ2 = f1M √ s14 √ s2η p F0+η(f1+f2δ1) 4√4s 14 p F0+η(f1+f2δ1)−74 √ s24 p F0+η(f1δ2+f2) 4(F0+η(f1δ2+f2))3/4 4√4s 14 p F0+η(f1+f2δ1)− 4 √ s24 p F0+η(f1δ2+f2) 3
The denominator is clearly positive and the sign of
the numerator 4√4s 1 4 p F0+η(f1+f2δ1)−74 √ s24 p F0+η(f1δ2+f2) is to be determined. We
have already proved that the dominant strategy for firm 1 is δ∗1 = 1.
Consider the candidate for (partial) equilibrium specified by :(δ1 = 1, δ2 = 1, se1, se2), where
se1 and se2 are given by the solution to the FOCs ∂Π
(2Sb) 1 ∂s1 = 0 and ∂Π(2 S b) 1 ∂s2 = 0. At the
candi-date for equilibrium, we note that the sign of numerator of ∂Π
(2Sb) 1 ∂δ2 δ1=1,δ2=1 is determined by 4√4s 1 4 p F0+η(f1+f2δ1)−74 √ s24 p F0+η(f1δ2+f2)
>0, which we find to be positive. At this
candidate equilibrium, we need to check for deviati