Case study using LIDAR to measure the morphology of a bog
B. C. O’Kelly1*, P. M. Johnston1 and G. Kawisso1 1
Department of Civil, Structural, and Environmental Engineering, Trinity College Dublin, Dublin 2, Ireland
*Corresponding author: E-mail: [email protected], Tel +353 1896 2387, Fax: +353 1677 3072
Abstract
Bogs are dynamic hydrological systems. The morphology of a bog changes annually, effectively swelling during the wintertime and shrinking during the summertime, and the dynamics of the morphology must be understood to effectively support the hydroecology. The advantages of airborne LIDAR surveys are to get the morphology of a large area quickly, more easily and potentially more accurately since there is no intervention between the system and the bog surface which moves underfoot in the course of carrying out a conventional global positioning system (GPS) survey. However, bogs have a vegetated and hence a quite rough (soft) surface and the uncertainty lies in whether the LIDAR laser pulse interacts with that soft surface. The topography a raised bog was surveyed using airborne LIDAR and real time kinetic GPS systems. The LIDAR and GPS surveys were in good agreement with a maximum discrepancy of about 12 cm in the surface elevation recorded over the central plateau. The surface vegetation did not appear to have interacted unduly with the reflected LIDAR laser pulses.
Keywords: bog; GPS; LIDAR; morphology; restoration; vegetation.
1. INTRODUCTION
Bogs are dynamic eco-hydrological systems that are increasingly under threat worldwide due to peat extraction and drainage of the bog for agriculture use and afforestation. For example, only about 19% of the 1.3 million hectare bog land resource that once covered Ireland currently remains intact. The dynamic part of a bog (the acrotelm) is the uppermost 30–50 cm which is supported by many metres of decayed vegetation (the catotelm). Like any live biological system, the annual cycle of growth and decay of the growing layer (top 10–20 cm of the acrotelm) consumes water. The underlying peat material also absorbs water during the wintertime and releases water (usually through evapo-transpiration) during the summertime. Hence, the morphology of the bog changes on an annual cycle, effectively swelling during the wintertime and shrinking during the summertime, with typical changes in elevation of 30–50 cm. The sustainability of healthy sphagnum mosses (the key species in the acrotelm) depends on the availability of sufficient rainwater so that the morphology of the bog is critical in understanding its hydrological functioning. The growth of the Sphagnum mosses is arrested if the bog surface becomes so steep (slopes greater than 1:30, [1]) that the rainwater runs off rather than infiltrating and swelling the bog on the annual cycle. Hence, the dynamics of the morphology must be understood to effectively support the hydroecology.
systems have been explored elsewhere [2,3] but never validated on a bog surface. LIDAR (light detection and ranging) is an optical remote sensing technology that uses laser pulses to determine the range and/or other information of a distant target (survey point) by measuring the time delay between the transmission of the laser pulse and the detection of the reflected signal by an optical telescope. LIDAR can have an accuracy of 3–100 cm depending on the type of laser system, the flight characteristics of the aircraft on which the LIDAR system is mounted and the terrain. LIDAR has higher accuracy in hard landscapes such as urban environments. However, bogs have a vegetated and hence a quite rough (soft) surface and the uncertainty lies in whether the LIDAR laser pulse interacts with that soft surface. The morphology of a bog in the Irish midlands was measured using both the LIDAR and GPS systems. The LIDAR data were calibrated against the GPS data to determine whether the accuracy of the LIDAR system on bog land is comparable with that achieved using conventional surveying techniques.
2. CASE STUDY: RAHEENMORE BOG
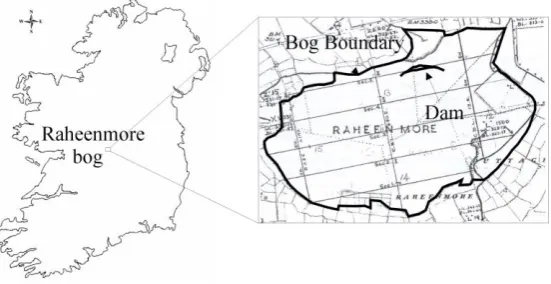
Raheenmore bog is a classical example of a raised bog and is situated about 5 km from Daingean, County Offaly, Ireland (Figure 1). The bog is a designated Nature Reserve, 162-hectares in area, with a characteristic, well-developed dome shaped relief (peat is up to 15-m in depth) that has risen above the surrounding countryside. The micro-relief comprises undulating hummock and hollow systems (10–30 cm height differential) and some ponding of water in the hollows. Overall, there is good coverage of healthy Sphagnum mosses and sparse tree cover around the bog perimeter.
Figure 1. Location and site map of Raheenmore Bog.
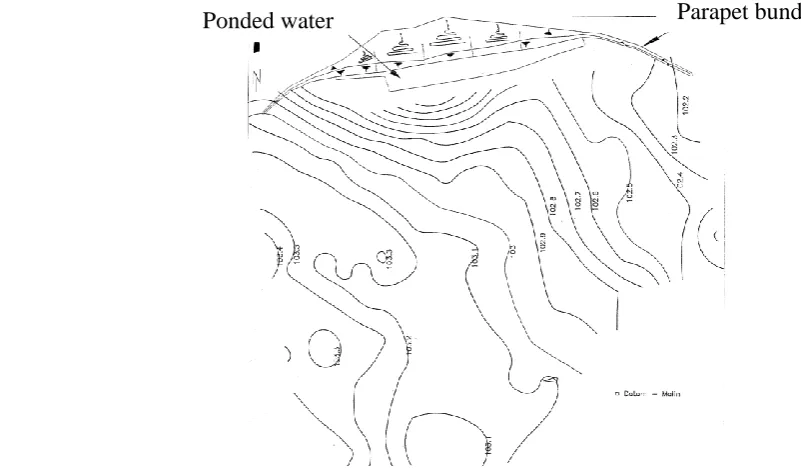
Healthy raised bogs have a naturally high groundwater table usually coincident with the bog surface. Although the margins of Raheenmore bog have been arterially drained and some peat has also been extracted in the past, the bog remained remarkably intact and was one of the few raised bogs in Ireland where the restoration of the lagg zone (natural marginal drainage channel around the bog) was feasible. In 1997, a parapet bund (about 306-m in length and 0.5–1.0 m in height, Figure 2) was constructed to engineer the conservation and regeneration of an area affected by peat extraction. The purpose of the bund was to pond surface water on the slope along the edge of the bog dome near its northern perimeter, Figure 1. The seepage beneath the bund was also reduced by installing a high-density plastic liner between the base of the bund and the underlying low-permeability lacustrine clay.
[image:3.595.162.438.365.507.2]parapet bund using the LIDAR and GPS systems. The survey data were analyzed to assess the accuracy of LIDAR in bog land environments.
Figure 2. Cross-section through the parapet bund [4].
3. EXPERIMENTAL METHODS
3.1 Ground survey using GPS
Real time kinetic GPS surveys were carried out on the bog in March and May of 2003 using the LEICA 500 and TRIMBLE 4700 systems which have reported accuracies for vertical positioning of 10 and 5 mm, respectively. The base station was located at the edge of the bog at a point of known elevation, relative to a topographic benchmark. Steel plates welded to the tops of long vertical poles that had been driven through the peat material and anchored in the underlying lacustrine clay also served as temporary benchmarks. There was a clear gap of about 50 cm between the steel plates and the bog surface. The roving station was connected to the base station by radio communication.
The March 2003 survey covered the entire bog surface using a 100-m square grid spacing (Figure 3). A finer 25-m square grid spacing was used for greater detail in the vicinity of the parapet bund where the ground was more steeply sloping. The May 2003 survey focused on the area in the immediate vicinity of the bund, and comprised a survey line along the top of the bund and three orthogonal transects (labelled A, B and C) that extended up to 300 m into the central plateau (Figure 3b).
(a) Grid coverage of the entire bog. (b) Transects in the vicinity of parapet bund. Figure 3. GPS surveys in March and May of 2003.
Transects A B
C Line of
Two measurement techniques were used:
i) The roving station was mounted on a staff pole that had been fitted with a plastic pad ‘foot’. The staff pole was rested on the bog surface at the grid points and the 3D coordinates were recorded in real time while traversing the bog.
ii) The elevations of steel spot plates resting on the bog surface were also measured using the roving station. The annular spot plates could moved freely along the length of shorter poles that had been driven vertically into the peat material so that both the plates followed the movement of the bog surface. The steel plates (30-cm square and 6-mm in thickness) were of sufficient weight that the underlying vegetation did not cause the plates to loose contact with the bog surface.
3.2 LIDAR
The LIDAR survey was carried out in March 2003 from a light aircraft flying over the bog using the Purple Crow LIDAR facility developed at the University of Western Ontario. Purple Crow LIDAR transmits both continuous wave and pulsed laser signals from the aircraft which are reflected off the ground surface and detected by an onboard receiver at set time intervals. The system had a reported vertical positioning accuracy of 15 cm for a flight altitude of about 700 m. The survey focused on the area of the bog in the vicinity of the parapet bund using a uniform 5-m square grid spacing.
4. EXPERIMENTAL RESULTS
Surface contour maps (Figure 4) were produced for the area in the vicinity of the parapet bund using the March 2003 LIDAR and GPS data sets. The contour maps were generated using AutoCAD and Kriging (a group of geostatistical techniques that are used to interpolate the elevation at an unobserved location on the basis of observations of its value at nearby locations, depending on distance).
Figure 4. Surface contour map for the area around the parapet bund.
Figure 5 shows the surface elevation profiles along the three transects that were aligned in a general north-south direction and which extended from the edge of the bog into the central plateau. The May 2003 GPS profiles shown were generated directly from the survey data that was actually recorded along the transects. The March 2003 LIDAR and GPS profiles were reduced from the surface contour maps that had been generated for the area using AutoCAD. Figure 5 (a) shows the
[image:5.595.54.455.435.672.2]central transect through the parapet bund. Figures 5 (b) and (c) show the transects that pass either side of the bund and which extended a distance of about 300-m into the central plateau. The May 2003 GPS data does not feature in Figure 5(b) as this survey did not extent far enough into the central plateau.
(a) Transect A (through parapet bund).
(b) Transect B.
(c) Transect C.
Figure 5. LIDAR and GPS surface elevation profiles in the vicinity of the parapet bund.
B o g s u rf ac e elev atio n , m OD Distance, m Central plateau Parapet bund B o g s u rf ac e elev atio n , m OD Distance, m Central plateau B o g s u rf ac e elev atio n , m OD Distance, m Central plateau
May 2003 GPS LIDAR
March 2003 GPS
LIDAR
March 2003 GPS
LIDAR
[image:6.595.128.453.121.746.2]5. ANALYSIS AND DISCUSSION
Overall, the March 2003 LIDAR and GPS surveys were in good agreement with a maximum discrepancy in the surface elevation of only about 12 cm recorded over the central plateau of the bog (Figure 5 (b) and (c)). The surface vegetation did not appear to have interacted unduly with the reflected LIDAR laser signal as the LIDAR surface elevation profile was invariably marginally below that recorded using the GPS. The groundwater table was largely coincident with the bog surface at Raheenmore, the combined effect of which was to provide a hard reflective surface for the LIDAR laser signals. The effect of this was particularly true in the area directly behind the parapet bund where the LIDAR signal was reflected off the surface of the impounded water (Figure 5(a)). The true elevation of the submerged bog surface at this location was recorded using the GPS roving station that had been mounted on a staff pole. Overall, the grid spacing used in the LIDAR and GPS surveys was adequate. During the walkover, the GPS survey had more flexibility in that the surveyor was able to record extra data points depending on the ground features encountered onsite. However, the LIDAR system used a uniform, 5-m square grid throughout. Hence, some more significant discrepancies of up to 30 cm occurred between the LIDAR and GPS surveys at the location of the parapet bund and due to some hummocks (shallow round to oval shaped mounds rising 10–30 cm above the bog lawn) located over the central plateau, which were only registered by the GPS survey. Greater definition could be achieved by simply using a finer grid spacing in the LIDAR survey.
6. CONCLUSIONS
The topography of a raised bog was surveyed using the airborne Purple Crow LIDAR and the real time kinetic GPS systems. The LIDAR and GPS surveys were in good agreement with a maximum discrepancy in the surface elevation of about 12 cm recorded over the central plateau of the bog. The surface vegetation, comprising a good coverage of healthy Sphagnum mosses and sparse tree cover, does not appear to have interacted unduly with the reflected LIDAR laser pulses with the coincidence between the groundwater and ground surface levels collectively provided a hard reflective surface. As well as covering a large area quickly and more easily, the LIDAR system can also measure the morphology more accurately since there is no intervention between the surveying system and the bog surface which itself moves underfoot during the course of the GPS survey. However, the GPS survey had more flexibility in that the surveyor was able to record extra data points depending on the ground features encountered onsite.
References
1. Schouten M.J.C. (ed.), 2002. Conservation and Restoration of Raised Bogs. Duchas, Department of the Environment, Ireland, and Geological Survey of Ireland, Staatsbosboheer, Netherlands.
2. Milton E.J., Hughes P.D., Anderson K., Schulz J., Lindsay R., Kelday S.B., Hill C.T., 2004. Remote sensing of Bog Surfaces. Report 366, ISSN 0963-8091, UK Joint Nature Conservation Committee, Peterborough, UK.
3. Pietroniro A., Toyra J., 2002. A multi-sensor remote sensing approach for monitoring large wetland complexes in Northern Canada. Proceedings of the International Geoscience and Remote Sensing Symposium, June 24–28, Toronto, Canada, Vol. II, 1069–1072.
4. Bennett J., 1998. Monitoring the hydrogeological and geotechnical performance of peat dams at Raheenmore bog, Co. Offaly, Ireland. MSc thesis, Trinity College Dublin.
![Figure 2. Cross-section through the parapet bund [4].](https://thumb-us.123doks.com/thumbv2/123dok_us/941774.607150/4.595.175.424.100.247/figure-cross-section-parapet-bund.webp)