Ames Laboratory Accepted Manuscripts Ames Laboratory
1-2019
Γ
-brasses in the Mn-Zn system: An experimental and
-brasses in the Mn-Zn system: An experimental and
computational study
computational study
Stephanie Eveland
Iowa State University and Ames Laboratory
Srinivasa Thiminaiah Ames Laboratory
Madalynn G. Marshall
Iowa State University and Louisiana State University
Gordon J. Miller
Iowa State University and Ames Laboratory, [email protected]
Follow this and additional works at: https://lib.dr.iastate.edu/ameslab_manuscripts
Part of the Materials Chemistry Commons
Recommended Citation Recommended Citation
Eveland, Stephanie; Thiminaiah, Srinivasa; Marshall, Madalynn G.; and Miller, Gordon J., "Γ-brasses in the Mn-Zn system: An experimental and computational study" (2019). Ames Laboratory Accepted
Manuscripts. 355.
https://lib.dr.iastate.edu/ameslab_manuscripts/355
This Article is brought to you for free and open access by the Ames Laboratory at Iowa State University Digital Repository. It has been accepted for inclusion in Ames Laboratory Accepted Manuscripts by an authorized
Γ-brasses in the Mn-Zn system: An experimental and computational study -brasses in the Mn-Zn system: An experimental and computational study
Abstract Abstract
The synthesis and characterization of Ni2Zn11-type γ-brasses with composition Mn2+xZn11−x (x = 0.06–0.60) are reported. The synthesis follows standard high temperature methods and characterization by single crystal X-ray diffraction (SCXRD) and powder X-ray Diffraction (PXRD) techniques as well as Energy Dispersive Spectroscopy (EDS). First principles electronic structure calculations showed preferential heteroatomic Mn–Zn bonding and repulsive effects of Zn–Zn 3d–3d orbital overlap that influence the metal atom distribution in the structure. Local bonding environments and the relationship of Mn2+xZn11-x to other γ-brasses containing 3d metals such as PdCoZn11 and Ni2Zn11 are discussed.
Keywords Keywords
Single crystal X-ray diffraction, Powder X-ray diffraction, First principles calculation methods, Intermetallic compounds, Hume-Rothery phases, Gamma brasses, Zn-rich gamma brasses
Disciplines Disciplines
Materials Chemistry
Γ-brasses in the Mn-Zn System: an Experimental and Computational Study
Stephanie Evelanda,b*, Srinivasa Thiminaiahb, Madalynn G. Marshalla,c, Gordon Millera,b
a Department of Chemistry, Iowa State University Ames, IA, USA 50011
b Ames LaboratoryAmes, IA, USA 50011
c Louisiana State University Baton Rouge, LA, USA 70803
Abstract
The synthesis and characterization of Ni2Zn11-type γ-brasses with composition Mn2+xZn11−x
(x = 0.06−0.60) are reported. The synthesis follows standard high temperature methods and
characterization by single crystal X-ray diffraction (SCXRD) and powder X-ray Diffraction
(PXRD) techniques as well as Energy Dispersive Spectroscopy (EDS). First principles electronic
structure calculations showed preferential heteroatomic Mn−Zn bonding and repulsive effects of
Zn−Zn 3d−3d orbital overlap that influence the metal atom distribution in the structure. Local
bonding environments and the relationship of Mn2+xZn11-xto other γ-brasses containing 3d metals
such as PdCoZn11 and Ni2Zn11 are discussed.
Introduction
Γ-brasses represent a family of complex intermetallic compounds derived from defect bcc
packings of atoms whose space group is determined by the coloring or decoration of individual
atomic sites. A connection between stability and chemical composition within the γ-brass family
was accomplished by Hume-Rothery’s valence electron counting rules, noting that Cu5Zn8,
2
unit. Mizutani assigned the γ-brasses into three groups according to their constituent elements:
Group I γ-brasses have a monovalent noble metal with a polyvalent metal or metalloid with a
well-defined valency; Group II γ-brasses have a partially filled 3d metal with a fully filled valence d
-band element (Zn or Cd) or a trivalent metal such as Al; and Group III γ-brasses consist of cases
that do not include transition metals. [1, 2] By definition, the monovalent component of group I
γ-brasses contributes one electron and the other component(s) has/have an accepted valence
electron count such as Al (three electrons) or Sn (four electrons).
Within Group III γ-brasses, elements from among non-transition metals combine such as
Li21Si5, which can be described from a Hume-Rothery as well as a Zintl-Klemm perspective due
to larger electronegativity differences between the constituent atoms. The unit cell of Li21Si5 can
be divided into two different 26-atom clusters, Li22Si44+ and Li20Si64−, to satisfy a Zintl-Klemm
valence electron counting scheme. Li21Si5follows the conventional counting scheme for γ-brasses
and falls close to the idealized ratio of 21/13 by assigning Li one electron and Si four electrons,
which gives 41 valence s and p electrons per 26 atoms in the formula unit, and which satisfies a
Hume-Rothery perspective. [3] However, for Group II γ-brasses, the number of valence electrons
assigned to each element with a partially filled valence d-band remains controversial and the
elements involved have similar electronegativities making a Zintl-Klemm description
incompatible. Therefore, electronic structure calculations are necessary to provide insight into the
factors affecting their structural stability.
In all three groups, γ-brasses can be described in terms of 26-atom clusters which are
comprised of four concentric shells of symmetry equivalent atoms shown in Figure 1(a). Two
tetrahedra with increasing radii, viz., an inner and an outer tetrahedron (IT and OT), a larger
3
The interatomic distances within each shell are not necessarily within reasonable bonding ranges
for the specific components.
(a) (b)
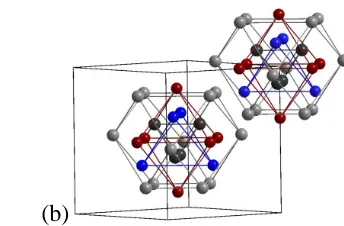
Figure 1(a) 26-atom cluster from the Mn2+xZn11−x structure (b) two 26-atom clusters located at the corner and center of the cubic unit cell. Gray indicates a site fully occupied by Zn; Mn/Zn mixed sites are red for majority Zn and blue for majority Mn. Lines emphasize the different polyhedral shells (see text) and do not necessarily identify atom pairs within bonding distances. Image was generated via the Diamond Software package. [4]
The atomic decoration of these clusters can lead to lattice symmetries of rhombohedral in
the case of Mn5Al8, body-centered cubic as observed for Cu5Al8 and Ni2Zn11 (Figure 1(b)), or
primitive cubic such as Cu9Al4. [1, 5, 6, 7] For group II γ-brasses, a series of Zn-rich structures
have been reported along with their associated prototypical coloring, without a detailed atomic
description of any Mn-Zn γ-brass. Among the transition metals small differences in
electronegativity play a role in the formation of Hume-Rothery phases such as γ-brasses with
mixed site occupancy.
The complexity of γ-brasses provides an excellent situation to study factors governing
stability of complex structures through experimental and theoretical means. Previous work in the
Cu-Zn, Ni-Zn, Pd-Zn, Pt-Zn, Co-Zn and Fe-Zn systems have all yielded cubic γ-brasses. [8-11] In
the Pt-Zn and Ni-Zn cases the earlier transition metal primarily, if not exclusively, occupies the
OT site and, in the Pt-Zn case, vacancies are observed on the Zn-occupied IT site. Pd-Zn γ-brasses
[image:5.612.290.462.139.252.2]4
and OH sites. In Fe-Zn γ-brasses two separate decorations are found: Fe2Zn11 in the lower end of
the phase width only the IT site is occupied by Fe; and in Fe3Zn10 the Fe rich end of the phase
width the OH site begins to host a mix of Fe and Zn. [11] Concerning Mn-containing brasses, it
has been previously shown to form a rhombohedral γ-brass structure Mn5Al8. The structural
dependence of Hume-Rothery phases on VEC suggests that Mn-Zn γ-brasses may form after
systematic substitution of Zn for Al in Mn5Al8, thereby lowering the VEC from 24/13 e−/f.u toward
21/13 e−/f.u.
Research performed by Liang et al. while exploring the Mn-Ni-Zn ternary system via
Powder X-Ray Diffraction (PXRD) and electron microscopy indicated the existence of a possible
γ-brass with approximate composition Mn5Zn21. [12] It was posited that the atomic decoration
would classify it as a Fe2(Fe0.5Zn0.5)2Zn9-type γ-brass based solely on PXRD refinements. In this
aristotype the earlier transition metal (Fe) is located on the IT and OT shells of the 26-atom cluster.
Data from Liang et al. shows space group I4�3m with 19.0 atomic % Mn, 81.0 atomic % Zn and a
lattice parameter of 9.1605(9) Å. The bulk sample was analyzed by Energy Dispersive
Spectroscopy (EDS), which determined significant MnZn3 was also present in the product,
although, when annealed for an additional 5 days at 350°C, the MnZn3 phase disappeared. [12] In
the following discussion, a more appropriate aristotype designation will be justified by Single
Crystal X-Ray Diffraction (SCXRD).
The most recently published experimental phase diagram for the binary Mn-Zn system
does not report this Mn5Zn21 phase, although a MnZn4 phase is included. In 1927, a MnZn4 phase
with a transition at 292 °C was identified without any crystallographic data, and in 1971 the MnZn4
phase was identified as a γ-brass type. The current experimental phase diagram provided by
5
temperature phases described as γ-brasses. [13-18] The composition and temperature ranges of
Okamato’s diagram support the annealing temperature used by Liang et al. so that it can be
surmised that the Mn5Zn21 γ-brass is the MnZn4 “ht1” phase referenced in Okamoto’s phase
diagram. The questions left after previous work are how does this phase fit into the series of
Zn-rich γ-brasses, and what can be understood about local atomic environments. To answer these
questions, SCXRD, EDXS, magnetic measurements, and first-principles electronic structure
calculations are required.
Experimental
Mn chunks (99.99% Mn, 99.99% Zn teardrop, MPC, Ames Laboratory) were individually
weighed for sample sizes of ca. 0.5 g, sealed under an Ar atmosphere in Ta ampoules, and
encapsulated under vacuum in fused silica jackets. Samples with 15-30 atomic % Mn were loaded.
All samples were heated at a rate of 1 °C per minute to a maximum temperature of 750 °C, cooled
at approximately 0.1 - 0.3°C/min, then annealed at 350°C or 400°C for 2-8 days, followed by
natural cooling to room temperature inside the furnace. Once removed from the Ta ampoules, the
samples were crushed into powder to be characterized by PXRD, and single crystals were selected
to be analyzed by SCXRD. All SCXRD data were collected at room temperature, and any
dependence of atomic site occupation on temperature was not investigated. Chunks from pure
phase samples were analyzed by EDS. For phase purity verification, all samples were
characterized by PXRD using a Stoe Stadii P diffractometer utilizing transmission geometry and
Cu Kα1 radiation. GSASII was employed for refinement of PXRD data from a sample loaded as
Mn2.33Zn10.67 [19]. Numerous single crystals selected from different loading compositions were
studied using a Bruker Apex II CCD diffractometer equipped with graphite monochromatized Mo
6
discussed below were obtained from direct methods and refined by full matrix, least squares
refinement on F2 using the ShelXTL package. [20]
Energy Dispersive X-ray Spectroscopy was performed on chunks of material from a pure phase
sample as determined by PXRD using an Oxford Aztec EDXS, to make an additional comparison
of refined composition of SCXRD with the bulk sample.
The Stuttgart Tight-Binding Linear Muffin-Tin Orbital program using the Atomic Spheres
Approximation (TB-LMTO-ASA) is a first principles computational method which was used to
compute the electronic structures of two models from the experimentally determined structures of
these Mn-Zn γ-brasses, “Mn2Zn11” and “Mn3Zn10” [21] This computational approach uses
overlapping Wigner-seitz (WS) spheres surrounding each atom so that spherical basis functions,
i.e., atomic orbital (AO)-like wavefunctions, are used to fill real space of the structure and keeping
the WS sphere overlap to be less than 16 percent. If necessary, any remaining space is accounted
for by empty WS spheres, which was the case for the “Mn2Zn11” calculations. The percent overlap
for “Mn2Zn11” was 9.113%, the Mn WS radius was 1.590 Å with a basis set which consisted of
4s/4p/3d, and the Zn WS radius range was 1.464−1.545 Å with a basis set which consisted of
4s/4p/3d. The percent overlap in “Mn3Zn10” was 9.118 %, the Mn WS radius was 1.550 Å and the
Zn WS radius range was 1.50−1.56 Å, and used the same basis set as “Mn2Zn11.” A mesh of 91
k-points in the irreducible wedge of the first Brillouin zone was used to obtain all integrated values,
including Density of States (DOS) and Crystal Orbital Hamiltonian Population (COHP) curves.
Additional calculations treating the Zn 3d orbitals as filled core orbitals were also
attempted to examine the influence of these states on the electronic structure and bonding analysis.
7
4s/4p/(3d); also, the “Mn3Zn10” WS radii remain the same but for “Mn2Zn11” the Mn WS radius
became 1.584 Å and the Zn WS range became 1.462−1.542 Å. Experimental atomic positions
derived from SCXRD were used as structural input to produce the electronic density of states
(DOS) and crystal orbital Hamilton population (COHP) curves, and total energies.
Results and Discussion
The sample used for the PXRD pattern shown in Figure 2 was loaded as “Mn2.33Zn10.67” and
underwent an extended annealing treatment of 198 hrs at 400°C to minimize the presence of
MnZn3 and Mn0.52Zn0.48 [11]. The theoretical PXRD pattern peak intensities derived from single
crystal refinement are consistent with those of the bulk sample. The experimental PXRD data
shown in Figure 2 were refined in comparison to the range of SCXRD refinements from the same
sample using GSASII [19]. Refinement of thermal parameter, lattice constant, and site occupation
factors from the PXRD pattern showed a larger lattice parameter than from SCXRD, insignificant
differences in the thermal parameters, and a strong preference for Zn on the OH and Mn on the
OT sites. See Supporting Information for more information. Although the PXRD yields good
agreement between the γ-brass structure of the bulk sample and individual single crystals picked
for SCXRD refinement, the question of phase width and site occupancy must be investigated using
8
Figure 2: Theoretical (Mn2.50Zn10.50) and experimental
(Mn2.33Zn10.67) PXRD patterns. Red shows the theoretical pattern
derived from single crystal refinement Mn2.50Zn10.50 and generated
using WinXPOW software package from the bulk sample loaded as Mn2.33Zn10.67 represented by the black PXRD pattern. [22]
The individual compositions found in other elemental mixtures with alternative heating
schemes (50 hrs at 400°C, or two-step cooling for 48 hours at 400°C then annealed for 150 hr at
[image:10.612.79.370.66.352.2]350°C) are listed in Table 1, as well as any secondary phases indicated by PXRD analysis.
Table 1: Compositions of Mn2+xZn11-x (SCXRD & PXRD)
Refined comp. Loaded comp. Refined e/a Lattice parameters Å S.G. Secondary phases in PXRD Mn2.06(3)Zn10.94 Mn3.00Zn10.00 1.683 a= 9.172(4) I4�3m β-Mn
Mn2.20(1)Zn10.80 Mn2.33Zn10.67 1.662 a= 9.161(7) I4�3m Mn0.52Zn0.48, Mn2Ta
Mn2.33(1)Zn10.67 Mn2.33Zn10.67 1.642 a= 9.155(2) I4�3m Mn0.52Zn0.48
Mn2.50(2)Zn10.50 Mn3.00Zn10.00 1.615 a=9.177(2) I4�3m Mn2Ta (trace)
Mn2.54(1)Zn10.46 Mn3.00Zn10.00 1.609 a =9.16(2) I4�3m β-Mn
Mn2.60(7)Zn10.4 Mn3.00Zn2.00 1.600 a=9.172(2) I4�3m Mn0.52Zn0.48 (majority) *The refined composition is given by SCXRD, as are the lattice parameters. Samples from row 1 and 5 were picked from the same bulk material. Samples from rows 2 and 3 were picked from the same bulk material. The Mn2Ta was
manually separated from the bulk Mn2.50Zn10.50 by visually inspecting the macroscopic morphology of chunks under
microscope.
Mn2Ta was found in varying quantities in samples where some crystals were found growing on
9
15.8-20.0 atomic % Mn, which is in agreement with the suggested MnZn4 phase width in
Okamoto’s phase diagram. [18]
The body-centered unit cell of γ-brass can be broken down into two identical 26-atom
clusters and further understood by examining the composition of the cluster’s four concentric
shells (see Figure 3). The coloring or arrangement of each element on these shells determines the
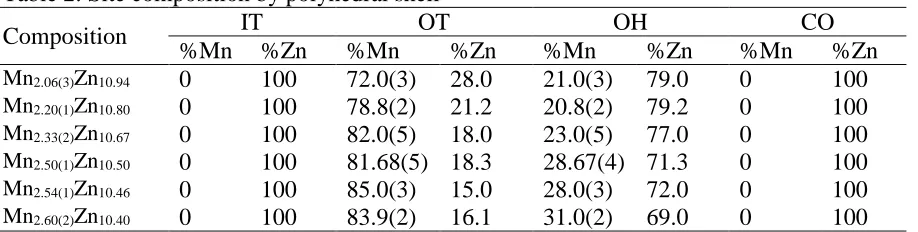
type of γ-brass. Table 2 shows the IT shell is solely occupied by Zn, whereas the OT shell is
mixed occupied with majority Mn for all single crystals examined. The OH shell also shows mixed
occupation between Mn and Zn, but with Mn as the minority component. The fourth shell, the
CO, is fully occupied by Zn.
Structural Trends and Valence Electron Counting
By taking a closer look at trends in connectivity across 3d metal-containing γ-brasses, this
system can be more accurately described. Other γ-brasses with similar atomic arrangements favor
the lower valence electron metal to be located on the OT sites, whereas some show mixing on the
OH sites, although Mn2+xZn11−x shows both with uneven mixing of the OT and OH sites between
the lower valence electron metal (Mn) and the higher valence electron metal (Zn). Many, like
[image:11.612.76.535.151.267.2]Cu5Zn8, show the OT and OH sites fully occupied at stoichiometric refinements by the lower
Table 2: Site composition by polyhedral shell
Composition IT OT OH CO
%Mn %Zn %Mn %Zn %Mn %Zn %Mn %Zn
Mn2.06(3)Zn10.94 0 100 72.0(3) 28.0 21.0(3) 79.0 0 100
Mn2.20(1)Zn10.80 0 100 78.8(2) 21.2 20.8(2) 79.2 0 100
Mn2.33(2)Zn10.67 0 100 82.0(5) 18.0 23.0(5) 77.0 0 100
Mn2.50(1)Zn10.50 0 100 81.68(5) 18.3 28.67(4) 71.3 0 100
Mn2.54(1)Zn10.46 0 100 85.0(3) 15.0 28.0(3) 72.0 0 100
Mn2.60(2)Zn10.40 0 100 83.9(2) 16.1 31.0(2) 69.0 0 100
10
valence electron element. [1] For Cu5Zn8-types that show mixing, it is generally reported as
uniform mixing on those sites, such as the Li-Ag system where 80-93% of the mixed sites are
occupied by Li throughout its phase range.[23] Figure 3 depicts differences in coloring schemes
of the Li-Ag γ-brass 26-atom cluster shown in Figure 3(a) and the 26-atom cluster of Mn2+xZn11-x
shown in 3(b).
(a) (b)
Figure 3: (a) Li18Ag8 26-atom cluster where green indicates Ag and
red indicates Li (b) Mn2+xZn11-x 26-atom cluster, where shades of
grey indicates Zn, and red indicates a majority Zn occupied mixed site while darker blue indicates a majority Mn mixed site.
For γ-brasses containing one or more 3d metals, the general convention for determining
the number of valence electrons is to count s and p electrons but not valence d electrons. For
metals such as Cu, Ag, Au, Zn, and Cd the valence d orbitals are filled. In general, this convention
leads to Ni and earlier transition metals contributing zero electrons to the e/a ratio. Although this
convention works well for late transition and post transition metals, intermetallic compounds such
as CrGa and MnGa at e/a = 1.5 do not fit well into the ideal e/aratio for rhombohedral γ-brasses.
[image:12.612.78.510.600.703.2][23, 24]
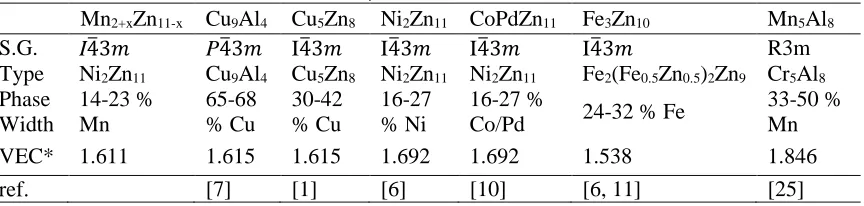
Table 3: Structural Trends Across the γ-Brasses
Mn2+xZn11-x Cu9Al4 Cu5Zn8 Ni2Zn11 CoPdZn11 Fe3Zn10 Mn5Al8
S.G. I4�3𝑚𝑚 P4�3𝑚𝑚 I4�3𝑚𝑚 I4�3𝑚𝑚 I4�3𝑚𝑚 I4�3𝑚𝑚 R3m Type Ni2Zn11 Cu9Al4 Cu5Zn8 Ni2Zn11 Ni2Zn11 Fe2(Fe0.5Zn0.5)2Zn9 Cr5Al8
Phase Width 14-23 % Mn 65-68 % Cu 30-42 % Cu 16-27 % Ni 16-27 %
Co/Pd 24-32 % Fe
33-50 % Mn VEC* 1.611 1.615 1.615 1.692 1.692 1.538 1.846
11
*The VEC is calculated based on stoichiometric compositions of the prototypical colorings shown in row 2.
I-centered, P-centered, and F-centered γ-brasses will have a closer to ideal e/a ratio of 1.63
as seen in Table 3 than those with rhombohedral packings, which tend to see e/a ratios closer to
1.8 than 1.6. [24] For stoichiometric “Mn2Zn11” and “Mn3Zn10”, the e/a ratios are 1.69 and 1.53,
respectively. The range of compositions observed, Mn2.06Zn10.94–Mn2.60Zn10.40, has an e/a ratio
range of 1.60−1.68, which is in line with the 21/13 ideal ratio for I-centered γ-brasses. The
composition range for Mn in Mn2+xZn11-x extends from approximately 15.8 to 20.0 %, which is
most similar to Ni2Zn11 and CoPdZn11. On the other hand, the Fe3Zn10 aristotype proposed by
Liang et al. has a considerably higher content of the minority component (Mn) concentrated on the
IT and OT shells. [6] And, although the space group, minority component locations, and e/a ratios
of Mn2+xZn11−x are similar to the Cu5Zn8γ-brass, the composition ranges are drastically different
with Cu comprising 30-42% of phase, further supporting the Ni2Zn11 coloring prototype discussed
above. [1]
Previous work in the Co-Pd-Zn γ-brasses has shown that systematic vacancies occur for
Co2+xZn11-y□y-x; the data presented in this body of work indicates no vacancies in the Mn-Zn γ
-brass system. Multiple attempts to refine single crystal data by incorporating vacancies were
undertaken, but this strategy produced either instabilities for Zn-rich refinements and no
observable vacancies (within standard error) for Mn-rich refinements. EDS was performed on a
specimen determined to be phase pure by PXRD after manual separation of Mn2Ta from the bulk
powder. This chunk was isolated from a single crystal, which was refined by SCXRD to
Mn2.50(1)Zn10.50. The refined composition by SCXRD matches well with that of EDS, 18.4-19.3
12
EDS and SCXRD support the compositions determined by SCXRD refinements and reinforces the
conclusion that electron density assigned to a mixed Mn/Zn site is not Zn atoms with vacancies,
as is seen in other ternary transition metal γ-brasses such as CoPdZn11. [10]
In comparison to stoichiometric Co2Zn11, atomic distributions in the structures of
Mn2+xZn11−x are similar because Zn occupies the IT and CO sites and is the majority component
of the OH sites. [10] However, in Co2+xZn11-y□y-x vacancies appear on the IT site, whereas in
Mn2+xZn11−x all SCXRD refinements indicate 100% occupancy of Zn at the IT site. When Pd is
incorporated into Co2Zn11, a similar site occupation scheme to what is observed in Mn2+xZn11−x
occurs. In Co2Pd2Zn9 the lower valence metal Co preferentially occupies the OT shell while the
slightly higher valence metal Pd preferentially occupies the OH site and the highest valence[1]
electron metal, Zn, fully occupies the IT and CO sites. The results of electronic structure
calculations of Co2Pd2Zn9 show marked similarities to Mn2+xZn11−x as well regarding the location
of pseudogaps near EF and distribution of the minority component’s valence d electrons. Dilute
ferrimagnetism was discovered in the Co-Pd-Zn γ-brasses and similarities in structure and
composition range warrant an investigation into magnetic behavior, however results on the sample
“Mn2.50(1)Zn10.50” remain inconclusive at this time.[10]
Due to the presence of Mn on both the OT and OH sites in Mn2+xZn11−x, the Cu5Zn8-type
γ-brass with major Mn deficiencies is a possible classification of these phases, although the
composition and solubility of Mn into Ni2Zn11 shown by Liang et al. make Ni2Zn11 a better
aristotype.[1, 12] Therefore, Mn-Zn γ-brasses can be written as a Ni2Zn11-type with additional
mixing on the OH sites to accommodate the Mn-rich region of the phase width.
13
Complex intermetallic systems with mixed site occupation and experimentally determined
phase widths present interesting challenges when investigating local atomic interactions using
electronic structure calculations. One of the computational challenges includes choosing an
appropriate coloring model. By combining the results of XRD, EDS, and appropriate models to
generate computational data, a greater depth of knowledge is attained regarding the factors
governing stability and local connectivity of complex compounds. Coloring models based on
Fe2(Fe0.5Zn0.5)2Zn9 as suggested by Liang et al. would have more through-space Mn-Mn
interactions than observed experimentally in Mn2+xZn11-x due to IT−IT connections and the
probability of Mn-Mn contacts through IT and mixed OT site interactions. [12] Due to the refined
Mn/Zn mixing on the OT and OH sites, two models were chosen to investigate using electronic
structure calculations: “Mn2Zn11” has OT positions exclusively occupied by Mn and no Mn-Mn
orbital overlap; and “Mn3Zn10” has OH sites occupied by Mn with Mn-Mn contacts. The lattice
parameters for “Mn2Zn11” were chosen from the Mn2.06Zn10.94 refinement and “Mn3Zn10” used the
lattice parameters from Mn2.60Zn10.40, as listed in Table 1.
In the following discussion all VECs are calculated using conventional methods assigning
zero valence s and p electrons to Mn and two valence s an p electrons to Zn. Electron counts
shown on the DOS and COHP curves include all valence electrons. In the DOS and COHP curves
of both “Mn2Zn11” and “Mn3Zn10”, Mn 3d-bands display prominently just above and just below
the respective Fermi energies. In the DOS curve for “Mn2Zn11” the Fermi energy (set to 0eV) falls
on the upward slope of states that largely arise from the Mn 3d orbitals. Just below the calculated
Fermi energy of “Mn2Zn11”, there is a deep pseudogap. Applying the rigid band model to the DOS
and COHP curves allows an estimation of electronic structure features at different electron counts,
14
structures are subject to considerable changes with composition (compare the DOS curves
“Mn2Zn11” and Mn3Zn10” in Figures 4 and 5). According to the rigid-band model, the pseudogap
extends from 145.5 e−, corresponding to “Mn2.10Zn10.89” and a VEC of 1.67 e/a to 144.7 e−,
corresponding to “Mn2.27Zn10.73” and 1.65 e/a. The corresponding Mn−Zn and Zn−Zn COHP
curves in Figure 4(b) indicate that Mn(OT)−Zn interactions become antibonding above the Fermi
level for “Mn2Zn11”, whereas both are essentially nonbonding throughout the pseudogap region of
the DOS. Lowering the valence electron count below the pseudogap and VEC lower than 1.65 e/a
would deplete significant Mn−Zn bonding states. Therefore, the combination of DOS and COHP
curves for “Mn2Zn11” indicates enhanced stability for Mn concentration exceeding “Mn2Zn11”,
i.e., Mn2+xZn11−x, but with an upper bound of x ~ 0.3 set by depleting heteroatomic Mn−Zn bonding
states in the DOS.
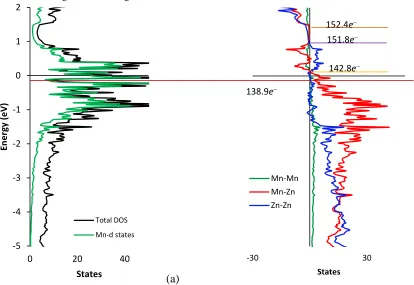
On the other hand, the DOS curve for “Mn3Zn10” in Figure 5(a) shows multiple narrow
pseudogaps within a few tenths of eVs from the calculated Fermi level arising from ligand field
splitting of the Mn 3d orbitals from through-space Mn−Mn contacts, and a broad (∼0.6 eV wide)
pseudogap near +1eV relative to EF for “Mn3Zn10”. In this broad pseudogap, the Mn−Mn, Mn−Zn,
and Zn−Zn COHP curves in Figure 5(b) show nonbonding interactions. Above this broad
pseudogap at 151.8 e−, or “Mn0.85Zn12.15” and a VEC of 1.87 e/a, Zn−Zn interactions become
strongly antibonding. The Mn−Zn interactions are antibonding above 141.8 e- (indicated by the
yellow line in Figure 5b) which corresponds to the composition of “Mn2.65Zn10.65” and a VEC of
1.64 e/a. and can be assigned as the theoretical upper bound for Mn of these binary Mn-Zn γ
15
(a) (b)
Figure 4: (a) Density of States “Mn2Zn11” (b) Crystal Orbital Hamilton Population curves of “Mn2Zn11”. The gray line
indicating 152.0 e− shows the point at which Zn−Zn interactions become antibonding when the Zn3d – band is formally filled at 130e- leaving 22e- remaining.
(a) (b)
Figure 5: (a) Density of States of “Mn3Zn10”(b) Crystal Orbital Hamilton Population curves for “Mn3Zn10”. The dark
red line indicates the minima of a pseudo gap occurring at 138.9 e− which corresponds to Mn3.42Zn9.58 which
corresponds to a VEC of 1.47 e/a. The yellow line indicates the point at which Mn−Zn interactions become antibonding and corresponds to a composition of Mn2.65Zn10.35. For electron counts near 152.0 e−, all interactions are nonbonding.
-5 -4 -3 -2 -1 0 1 2
0 20 40
En er gy ( eV ) States Total DOS Mn-d states -30 30 States Mn-Zn Zn-Zn
152.0e−
144.7e−
-5 -4 -3 -2 -1 0 1 2
0 20 40
En er gy ( eV ) States Total DOS Mn-d states -30 30 States Mn-Mn Mn-Zn Zn-Zn
138.9e−
142.8e−
151.8e−
[image:17.612.95.495.69.348.2] [image:17.612.97.511.386.671.2]16
As a result of the DOS and COHP analyses for “Mn2Zn11” (Mn on OT sites) and “Mn3Zn10” (Mn
on OH sites), optimized metal-metal bonding occurs for a range of compositions Mn2+xZn11−x. The
experimental result gives 0.06(3) ≤ x≤ 0.60(1); and the computational predictions are 0.10 ≤ x≤
0.27 from “Mn2Zn11” and 0.65≤ x≤1.00 from “Mn3Zn10”. The Mn2Zn11 model was constructed
to treat Zn rich side of phase width and the Mn3Zn10 model was constructed to highlight the Mn
rich end of the phase width. Taking these computational results together a reasonable predicted
phase width would be 0.1 ≤x≤0.65 as the “Mn3Zn10” model shows strongly antibonding Mn−Zn
and Mn−Mn interactions as number of Mn interactions increase.
To determine differences in the capacity of an individual crystallographic site to
accommodate more or less electrons, the integrated density of states was evaluated for each site
[image:18.612.71.542.470.574.2]using “Mn2Zn11” and “Mn3Zn10” (see Table 4).
Table 4: Integrated Density of States for each crystallographic site in “Mn2Zn11” (Mn on OT
sites) and “Mn3Zn10” (Mn on OH sites)
“Mn2Zn11” “Mn3Zn10”
ΔNo. e− Element ΔNo. e− Element
IT +0.0282 Zn +0.0447 Zn
OT −0.1159 Mn −0.0193 Zn
OH −0.0223 Zn +0.0130 Mn
CO +0.0279 Zn −0.0150 Zn
Comp. at EF Mn2.02Zn10.98 Mn3.02Zn9.98
In each case, we focus on the Zn sites to identify likely substitution patterns of Mn for Zn.
Since Mn has fewer 3d valence electrons than Zn, then Mn will preferentially substitute for Zn
atoms in the site(s) that achieve(s) the lowest integrated DOS. For “Mn2Zn11” with Zn atoms in
17
in IT, OT, and CO sites, the lowest population occurs at the OT sites. Thus, the optimum site
energies for Mn2+xZn11−x (0.06(3) ≤ x≤ 0.60(1)) occur for Mn and Zn atoms sharing the OT and
OH sites, with more Mn on the OT sites than OH sites, in agreement with experiment.
The metallic radii of Mn and Zn are respectively 1.27 Å and 1.34 Å, so interatomic
distances between 2.5 Å and 3.0 Å are considered potential Mn−Mn, Mn−Zn, and Zn−Zn bonding
interactions. To assess the relative strengths of polar-covalency of the metal-metal bonds in
Mn2+xZn11−x, integrated COHP values for states populated up to the Fermi energy are utilized for
the following bonding analysis.
Detailed description of individual environments and connectivity can be found in the
Supplemental Information. Tables 5 and 6 show that the strongest bonding interactions for the
26-atom clusters involve hetero26-atomic Mn−Zn contacts except for the OH−OH contact in “Mn3Zn10”,
[image:19.612.72.536.459.675.2]which is a Mn−Mn interaction through the faces and edges of the unit cell.
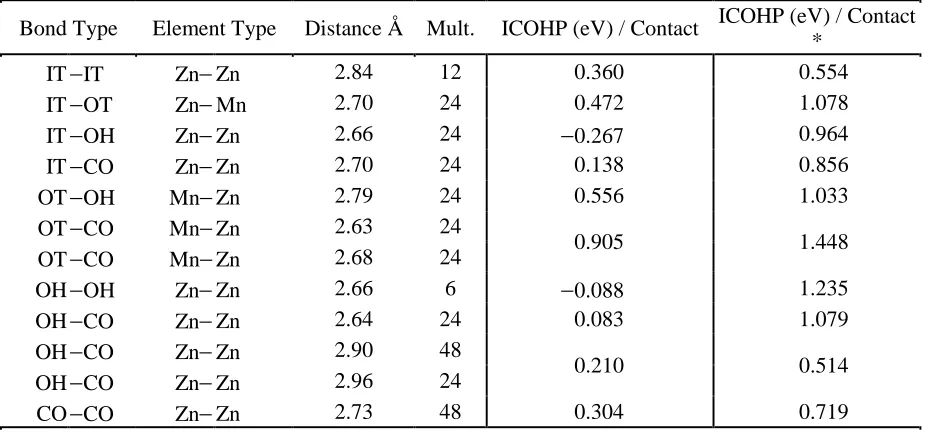
Table 5: Mn2Zn11 Bonding Analysis
Bond Type Element Type Distance Å Mult. ICOHP (eV) / Contact ICOHP (eV) / Contact *
IT −IT Zn− Zn 2.84 12 0.360 0.554 IT −OT Zn− Mn 2.70 24 0.472 1.078 IT −OH Zn− Zn 2.66 24 −0.267 0.964 IT −CO Zn− Zn 2.70 24 0.138 0.856 OT −OH Mn− Zn 2.79 24 0.556 1.033 OT −CO Mn− Zn 2.63 24
0.905 1.448
OT −CO Mn− Zn 2.68 24
OH −OH Zn− Zn 2.66 6 −0.088 1.235 OH −CO Zn− Zn 2.64 24 0.083 1.079 OH −CO Zn− Zn 2.90 48
0.210 0.514
OH −CO Zn− Zn 2.96 24
18
Table 5 shows the IT−OH and OH−OH interactions are antibonding in “Mn2Zn11” and the
48 OT−CO connections exhibit the strongest polar-covalency. OT sites make no contacts with
other OT sites so that there are no through-space Mn−Mn contacts in “Mn2Zn11,” whereas in the
refined Mn2.06Zn10.94, the probability of Mn−Mn contacts would be closer to 1.2% of all contacts,
or 3.6 potential Mn−Mn interactions for OT−OH contacts.
In Mn2.60Zn10.40 the probability of Mn−Mn contacts would be 2.2% with 6.8 potential
contacts per unit cell, although “Mn3Zn10” shows only six Mn−Mn contacts, representing 3.1% of
all bonding interactions. On scaling the number of interactions from Mn2.60Zn10.40 to Mn3.00 Zn10.00,
there would be far more than 6 potential Mn−Mn contacts per unit cell in “Mn3Zn10”. Therefore,
the Mn−Mn contacts shown in Figure 5(b) may be underrepresenting their role in the physical
[image:20.612.73.545.429.636.2]system.
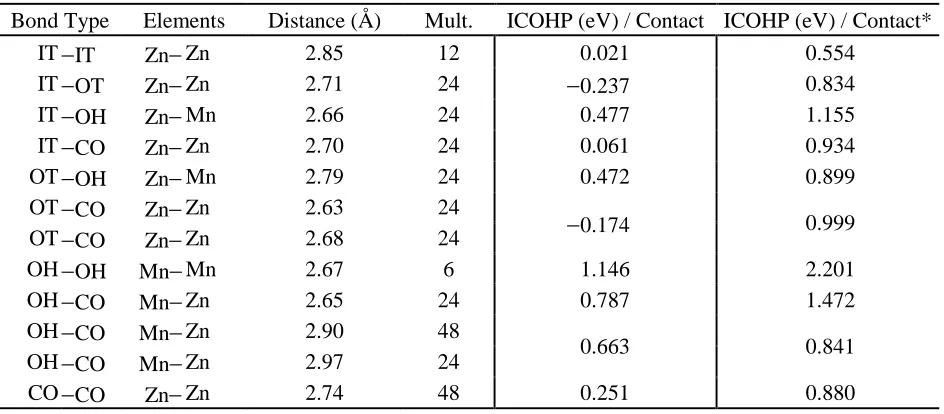
Table 6 : Mn3Zn10 Bonding Analysis
Bond Type Elements Distance (Å) Mult. ICOHP (eV) / Contact ICOHP (eV) / Contact* IT −IT Zn− Zn 2.85 12 0.021 0.554
IT −OT Zn− Zn 2.71 24 −0.237 0.834 IT −OH Zn− Mn 2.66 24 0.477 1.155 IT −CO Zn− Zn 2.70 24 0.061 0.934 OT −OH Zn− Mn 2.79 24 0.472 0.899 OT −CO Zn− Zn 2.63 24
−0.174 0.999 OT −CO Zn− Zn 2.68 24
OH −OH Mn− Mn 2.67 6 1.146 2.201
OH −CO Mn− Zn 2.65 24 0.787 1.472 OH −CO Mn− Zn 2.90 48
0.663 0.841
OH −CO Mn− Zn 2.97 24
19
Table 6 shows the IT−OT and OT−CO interactions are antibonding in “Mn3Zn10” and the
six Mn−Mn OH−OH connections are the strongest individual bonds. For a comparison to
experimental bonding schemes by element see Supplemental Information. The 3d orbitals of Zn,
which appear in the DOS approximately 7 eV below the Fermi energy, are formally filled. In this
region the COHP is strongly affected by the 3d-3d repulsions. When Zn 3d orbitals are treated as
core orbitals, all “Mn2Zn11” and “Mn3Zn10” contacts are evaluated as bonding by ICOHP. Table
4 shows that for “Mn2Zn11” the Mn−Zn interactions increased the most drastically from 0.64 to
1.19 eV per bond on average and the Zn−Zn bonds became more positive by an average of 0.74
eV per bond. The 48 OT−CO bonds remain the strongest individual interactions. As seen in Table
5, excluding the Zn 3d orbitals drastically increased the ICOHP for Mn−Zn interactions in
“Mn3Zn10” from 0.60 to 1.09 eV per bond on average with the OT−CO interactions increasing the
most significantly. Zn−Zn interactions also became more bonding by an average of 0.86 eV per
bond when Zn 3d orbitals were excluded.
Conclusion
Computation and experiment work synergistically to reveal details previously unreported
in the γ-brasses of the Mn-Zn system. The Mn-Zn γ-brasses are observed to have a phase width
of Mn2+xZn11−x(x = 0.06-0.60) and the distribution of Mn and Zn atoms most similarly mimics
CoPdZn11 with a composition range most like Ni2Zn11. Site energy analysis, electronic structure,
and SCXRD support mixed occupation of the OT and OH sites with Zn preferentially occupying
the OH and Mn preferentially occupying the OT sites. Results show that minimizing Zn−Zn
homoatomic interactions has a stabilizing effect on the structure below the Fermi energy, although
20
states which suggests that a phase width of Mn2.06Zn10.94-Mn2.65Zn10.35 may be possible before
Mn-Zn interactions become strongly antibonding. This suggested phase width matches closely to the
phase width observed experimentally. The role of Zn 3d orbitals is most felt in the Zn−Zn OH−OH
interactions in “Mn2Zn11” and the Zn−Zn connections involving the OT sites in “Mn3Zn10”. The
observed mixed occupation on OT and OH sites dampens the intensity of the Zn−Zn 3d−3d
interactions while promoting strong Mn-Mn and Mn-Zn bonds.
Acknowledgements
We are grateful for the EDS analysis by Dr. Chris R. Celania as well as Dr. Yaroslav
Mudryk for magnetic measurements referenced in this work. This research was supported by the
office of the Basic Energy Sciences, Materials Sciences Division, U.S. Department of Energy
(DOE). Ames Laboratory is operated for DOE by Iowa State University under contract
DE-AC02-07CH11358.
References
[1] A. F. Phragmen and G. Westgren, Metallwirtschaft, pp. 380-385, 1929.
[2] U. Mizutani, Hume-Rothery Rules for Structurally Complex Alloy Phases, Boca Raton: CRC Press, 2011.
[3] H.-G. von Schnering and R. Nesper, Journal of Solid State Chemistry, pp. 47-52, 1987.
[4] K. Brandenburg, "Diamond version 3.2k," Crystal Impact GbR, Bonn Germany, 2015.
[5] M. Ellner, Metall. Trans. A, vol. 21, pp. 1669-1672, 1990.
21 [7] L. Arnberg and S. Westman, Acta Crystallographica A (1978), 34, 399-404, vol. 34, pp. 399-404,
1974.
[8] O. Gourdon and G. J. Miller, Chemistry of Materials, vol. 18, no. 7, pp. 1848-1856, 2006.
[9] B. Harbrecht, S. Thimmaiah, M. Armbruster, C. Pietzonka and S. Lee, Zeitschrift fuer Anorganische und Allgemeine Chemie , no. 628, pp. 2744-2749, 2002.
[10] W. Xie and G. J. Miller, Chemistry of Materials Volume, vol. 26, no. 8, pp. 2624-2634, 2014.
[11] X. Weiwe, L. Jing, V. Pecharsky and G. J. Miller, Zeitschrift fuer Anorganische und Allgemeine Chemie, vol. 641, no. 2, pp. 270-278, 2015.
[12] J. Liang, Y. Du, C. Liao, Y. yuan Tang, L. qin Nong, F. Zheng and H. Xu, Journal of Alloys and Compounds, vol. 489, no. 2, pp. 362-368, 2010.
[13] C. L. Ackerman, Z. Metallkd., vol. 19, pp. 200-204, 1927.
[14] J. Schram, Z. Metallkd, vol. 32, pp. 399-407, 1940.
[15] E. Wachtel and K. Tsuiplakis, " Z. Metallkd., vol. 58, pp. 41-45, 1967.
[16] O. Romer and E. Wachtel, Z. Metallkd, vol. 62, pp. 820-825, 1971.
[17] Y. Nakagawa and T. Hori, Trans. Jpn Inst Met., vol. 13, pp. 167-170, 1972.
[18] H. Okamoto, L. Tanner and T. E. Massalski, Binary Alloy Phase Diagrams, II Ed, vol. 3, pp. 2625-2629, 1990.
[19] Toby, B. H., & Von Dreele, R. B. (2013). "GSAS-II: the genesis of a modern open-source all purpose crystallography software package". Journal of Applied Crystallography, 46(2), 544-549
[20] SHELXTL, version 6.10, Madison, WI: Bruker AXS INC, 2000.
[21] Jepson, O.; Andersen, O.K.; TB-LMTO, version 47; Max-Planck-Institut für Festköperforschung: Stuttgart, Germany, 2000
[22] WinXPOW, "version 3.0.0.11," Darmstadt Germany, 2010.
[23] T. Noritake, M. Aoki, S. Towata, T. Takeuchi and U. Mizutini, Acta Crstallographica B, vol. 63, no. 5, pp. 726-734, 2007.
22 [25] S. Thimmaiah, Z. Tener, T. N. Lamichhane, P. C. Canfield and G. J. Miller, Zeitschrift fuer