Deployment of UAV-Mounted Access Points
According to Spatial User Locations in Two-Tier
Cellular Networks
Boris Galkin, Jacek Kibiłda and Luiz A. DaSilva
CONNECT, Trinity College Dublin, Ireland, E-mail:{galkinb,kibildj,dasilval}@tcd.ie
Abstract—We envision small cells mounted on unmanned aerial vehicles, to complement existing macrocell infrastructure. We demonstrate through numerical analysis that clustering algo-rithms can be used to position the airborne access points and select users to offload from the macrocells. We compare the performance of these deployments against equivalent simulated picocell deployments. We demonstrate that due to their ability to position themselves around exact user locations while maintaining a direct line-of-sight link the airborne access points provide a significantly improved received signal strength than the static picocell alternatives. We alsofind that the airborne access points provide superior service quality even in the presence of user and access point positioning errors.
Keywords—UAVs, picocells, two-tier networks, small cell place-ment, flash demand, macrocell offloading.
I. INTRODUCTION
The continuing growth of data demand and the resulting in-crease in wireless traffic rates in modern cellular networks calls for new technologies and designs for commercial telecom-munication services. Among other innovations it is predicted that the 5th generation cellular standard will rely much more heavily on a dense network of low-power, short-range access points to deliver adequate data rates to the consumer [1]. This cell densification will ultimately result in higher data rates due to higher spectrum efficiency.
Picocell access points are typically deployed as part of a two-tier heterogeneous network and positioned in hotspots of user activity inside the coverage areas of existing macrocells [2]. The deployment process requires both time and manpower on the part of the mobile network operator as deploying picocells in a hotspot area typically involves trained personnel mounting and configuring the access points one by one.
As an alternative to fixed picocells we envision small cells mounted on unmanned aerial vehicles (UAVs), such as commercially available quadcopters, to complement existing macrocell infrastructure. Once a decision is made by a mobile network operator to deploy these small cells in an area of high user equipment (UE) traffic a group of UAVs is instructed to occupy positions above high concentrations of UEs and service the UEs below. We foresee three benefits of these UAV small cells over thefixed picocell alternative:
1) Performance Improvement. Because the UAVs are rapidly deployed and fully mobile they may be positioned around actual UE locations in real-time, unlike fixed picocells which are deployed around expected concentrations of
UEs. Additionally, because of their aerial vantage point the UAVs are more likely to establish line-of-sight (LOS) on the UEs than picocells. As we show in this paper, these factors ensure that UAVs can provide a higher service quality to UEs when compared to otherwise identical
fixed picocells.
2) Reduction of Service Overheads. The streamlined deploy-ment process suggests that the UAVs are suitable for deployment in flash demand scenarios where temporary UE hotspots form. In contrast, a fixed picocell deployed to service a temporary hotspot would remain under-utilised once the hotspot moved to a different location or disappeared. A mobile UAV, on the other hand, can be reassigned to another hotspot, thus servicing multiple hotspots at different times rather than remaining under-utilised.
3) Reduction of Cost. Unlike fixed picocells the UAVs do not require manpower to be mounted: these devices will instead hover over an area specified by a control unit. As this control can be largely automated we predict a reduction in cost for deployment compared to the fixed alternative.
In this paper we consider a two-tier network with macrocells that provide coverage and UAVs that provide additional ca-pacity for spatially distributed demand hotspots. For such a network we propose an algorithm based on cluster analysis which calculates suitable UAV locations given a snapshot of UE coordinates. Using simulations we demonstrate that a two-tier network with UAVs positioned according to our proposed solution outperforms a two-tier network with both planned and random picocell deployments in terms of service quality for UEs. In addition, we show that our positioning method is robust to location measurement errors.
II. RELATEDWORK
Our work draws on advances in the areas of optimal network deployment for small cell access points, as well as UAVs as a way to augment existing telecommunications infrastructure. Smart deployment of small cells has been a topic of extensive research; examples of such work include [3], where the authors use mixed integer linear programing to selectively place small access points within a heterogeneous network. The solution seeks the minimisation of a cost function representing data delivery cost.
a high-altitude platform which can provide service to users over an area spanning several square kilometers from low earth orbit. Improvements in UAV technology have made it possible to apply a similar concept on a smaller scale. The adoption of UAV-mounted access points has been widely examined for use in wireless sensor networks [5], [6], [7], with the telecom community beginning to consider similar technology in commercial cellular networks [8], [9], [10], [11]. In [9] the authors demonstrate in real-life trials that an access point mounted on a UAV is capable of acting as a relay for UEs in an urban environment. In [8], [11] the authors consider UAVs as backups in macrocell networks in the event of BS outage, with the UAVs being used to plug coverage holes that arise from a BS going offline. In [10] the authors analyse the impact of UAV mobility on UE in-service time in heterogeneous networks. To date, the wireless community considers UAV access points primarily as backup devices in emergency scenarios where
fixed infrastructure experiences outage and must be compen-sated for. The mobility and rapid deployment capabilities of UAVs make these devices good candidates for emergency applications; however, these features are also appealing for use in everyday commercial cellular networks. Our contribu-tion in this paper is to demonstrate how mobility and rapid deployment make UAV access points an attractive option for two-tier heterogeneous networks, not merely because they can be deployed in a shorter timeframe than fixed picocells, but because their mobility permits them to configure them-selves around rapidly-changing features of user demand. We demonstrate, using simulations, performance gains in a two-tier network including UAVs, when compared to equivalent picocell deployments which rely on a priori predictions of UE concentrations.
III. UAV POSITIONINGSOLUTION
System Model Let N be the number of UEs to be offloaded from the macrocell base stations, D be the num-ber of available UAVs and B the number of macrocells. Let W be a bounded window that is a subset of the two-dimensional Euclidean plane R2. The coordinates of the UEs
and macrocell base stations inside the windowW are defined as U ={u1, u2, ..., uN}⊂W andB={b1, b2, ..., bB}⊂W, respectively.
In this paper we study the network performance improvement related to network densification through UAV deployments. Therefore our goal is to intelligently deploy UAVs in such a way that they maximise the overall service quality for the UEs. We assume that the main factor which affects the service quality offered by a UAV is pathloss, as the UAVs operate in the LOS. For this reason, to maximise the service quality that a UAV can deliver to UEs it is necessary to assign UEs to UAVs and position those UAVs in such a way as to minimise UAV-UE distance. We also introduce a capacity constraintM which represents the number of UEs that a single UAV can service simultaneously; any additional UEs will remain connected to the macrocell. Because of their unobstructed vantage position in the air, the UAVs are assumed to not be constrained by coverage area but only by their capacityM.
The UAVs are assumed to maintain a height that ensures cover-age to the assigned UEs; therefore when placing the UAVs we
consider only the 2D plane where the UEs are. The challenge of positioning the UAVs is to select the coordinates which allow them to service the most UEs, with the best possible service quality. This problem is made more complicated when the number of available UAVsDis insufficient to offload all of the UEs in the scenario, i.e.DM < N. We focus our attention on this case.
Proposed SolutionThe selection ofDUAV coordinates which maximise the number of offloaded UEs is an optimisation problem which is non-smooth, non-convex and NP-hard. Fortu-nately a variety of heuristic algorithms exist in literature which are capable of finding an approximate solution. Our proposed solution is to use a K-Means clustering algorithm [12] to par-tition the windowW and the enclosed UEsU intoK subsets
which represent candidate coverage areas for the UAVs. If a UAV is assigned to service a subset it will position itself in the subset centroid and offload up to M UEs inside of that
subset from the macrocells. The value of K is selected to be
equal to�N/M�. This takes advantage of the fact that the
K-Means algorithm generates subsets with expected N/K UEs
each: ifK=�N/M�then each subset has an expected number
of UEs close to M which should take full advantage of the
UAV capacity. Because there will be more subsets than UAVs an additional step is required which selects which of the K
subsets will be serviced by D UAVs, with the rest remaining
serviced by the macrocells.
The solution to the UAV positioning problem therefore consists of two parts which are formulated as follows:
1) Partition the UEsU intoK subsets such that the sum of
distances between UEs and subset centroids is minimised. 2) Select theK subsets to be offloaded from the macrocell
onto theD UAVs.
UE PartitioningWe wish to assign all UEs inUtoK subsets.
Given a set of points X = {x1, x2, ..., xK} ⊂ W a Voronoi region is defined as:
ri={w∈W :||w, xi||<||w, xj|| ∀j�=i}, (1)
where||.||denotes Euclidean distance. We define the UE subset
si ⊂ U as the set of UEs which are located inside of the associated Voronoi cell
si=U∩ri, (2)
and the centroid ofsiis defined as the mean of the coordinates of the UEs belonging to the subset
µi=
�
u∈siu
|si| . (3)
We wish to select the points X which generate Voronoi cells and UE subsets such that
min
K
�
i=1 �
u∈si
||u, µi||. (4)
In other words, we wish to partition U into K UE subsets
the subset and the subset centroid is minimised. The Hartigan-Wong K-Means clustering algorithm [13] is selected to carry out this optimisation through a heuristic iterative process. TakingKinitial pointsX the algorithm assigns all of the UEs to the nearest point and generates subsets, then it calculates the centroids for each generated subset. In the second step the algorithm considers for every UE the change to the sum of Euclidean distances that would be observed if the UE was moved from its current subset to the subset with the next closest centroid. Whenever moving a UE from one subset to another decreases the total sum of Euclidean distances the subset assignments are updated and the centroids are re-calculated. Once all of the UEs have been checked the points X are set to the values of the centroids and another iteration is carried out. This process repeats itself until none of the subsets is updated over several iterations. The result found by K-Means clustering is a local optimum and its proximity to the unknown global optimum depends heavily on the initial points X used in the first iteration. We use the K-Means++ pre-processing algorithm to select the initial points X which are spaced as far away from one another in the windowW as possible: this selection step is shown to decrease convergence time and increase accuracy when compared to selecting intial points at random [14].
UAV Subset Selection Having obtained K subsets of the N UEs we wish to determine which of the subsets should
be offloaded from the macrocell infrastructure onto an UAV. Intuitively, the UAVs should prioritise servicing subsets with more UEs as well as those subsets that are further away from their servicing macrocell. Therefore we determine two values for each subsetj: the cardinality of subsetjand the distance of j’s centroid to the nearest macrocell. We use the two values
to create two ordered sets of the UE subsets. Subsequently, we denote nj as the position of subset j in the set ordered according to the cardinality ofjanddjas the position of subset
j in the set ordered according to the distance of j’s centroid
from the macrocell. Now, byvj we denote the weighted sum of the two scores αnj+ (1−α)dj, where 0≤α≤1 is the weighing factor. The subset selection can be formulated as an optimisation problem:
max
K
�
j=1
vjaj, (5)
where
aj=
�
1, if subsetj serviced by UAV 0, if serviced by macrocell (6)
subject to:
K
�
j=1
aj=D. (7)
Given our system model, we can apply a greedy algorithm to find the combination of D subsets that will satisfy (5),
therefore improving the overall service quality. Once a decision has been made on which subsets are to be serviced by UAVs the centroids of those subsets are made the UAV coordinates.
While the expected number of UEs per subset isM there will
be variations in the number of UEs from subset to subset. Certain subsets will have more than M UEs; if they are
selected to be served by a UAV then theM UEs closest to the UAV will be serviced by the UAV while the remaining UEs will stay connected to the macrocells.
IV. NUMERICALEVALUATION A. Simulation Model and Parameters
We compare the performance of the UAV deployments using our two-stage solution discussed above to the performance of
fixed picocell deployments. For this, we conduct a numerical evaluation in the statistical environment R. N UEs are simu-lated inside window W; the UAVs and picocell deployments are then simulated for the given UE coordinates and the resulting network performance, in terms of average signal strength experienced by a UE, is calculated. This simulation is repeated over 10,000 Monte Carlo trials.
UE Locations The UE locations are selected following the proposed 3GPP model in [15]. H hotspot coordinates are
randomly and uniformly placed inside W. These coordinates correspond to demand hotspot centres around which UEs will be generated. A random Poisson-distributed number of UEs with mean Nh are generated within a radius Rh of each hotspot. The remaining N −HNh UEs are randomly and uniformly distributed insideW independently of the hotspots. This simulation results inN randomly distributed UEs inside
of window W, a fraction of which are concentrated around randomly placed hotspots. The UE locations are assumed to be known to the central controller, which determines UAV locations, through UE localisation techniques such as observed time difference of arrival (OTDoA) [18], self-reported GPS coordinates or proposed cooperative localisation algorithms where UEs assist each other in determining location [19]. Picocell DeploymentWe simulatefixed picocell deployments as a baseline for comparing the service quality improvements that are introduced by mobile UAV deployments. We consider two strategies for deploying picocells: planned and random. The planned strategy follows the UE simulation model in [15] where H picocells are placed at hotspot centre coordinates, one picocell per hotspot. This represents the case where UE concentrations are known to the operators during picocell deployment and so the picocells are placed at the observed points of higher traffic demand. In the random strategy H
Fig. 1: Simulated window with 3 hotspots and 3 picocells. Overlaid park map denotes a typical outdoor urban environ-ment.
recommended by the 3GPP in [15]. These models represent urban environments with macrocell antennas mounted above rooftops, and they account for free space path loss in addition to multiple types of diffraction caused by buildings of varying height and density under NLOS conditions [16]. The model parameters are given in Table I.
B. Simulation Results
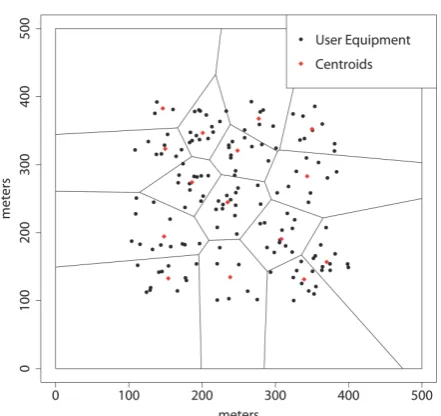
Received Signal Strength Thekmeansppfunction belonging to theLICORS package of R is used to perform the K-Means clustering of the dataset and generate UE subsets with their centroids [17]. A visual representation of the subsets generated by partitioning the UEs according to the procedure described in Section III is shown in Fig. 2. Our metric of choice for
TABLE I: Model parameters, whererdenotes distance in km Window Size 300x300m
Number of UEsN 150 Number of MacrocellsB 3 Number of UAVsD 1-10 UAV capacityM 10 Macrocell Deployment Hexagonal Macrocell Inter-site Distance 500m Number of UE HotspotsH 1-10 Hotspot RadiusRh 40m Average UEs per Hotspot 10 Subset Value Weighing Factorα 0.5 Macrocell Transmit Power 43dBm UAV & Picocell Transmit Power 23dBm Macrocell Frequency Band 1800MHz
Macrocell Pathloss (NLOS) 131.1 + 42.8log10(r)dB UAV & Picocell Pathloss (LOS) 103.8 + 20.9log10(r)dB
Picocell Pathloss (NLOS) 145.4 + 37.5log10(r)dB Lognormal Shadowingσ 3dB
Fig. 2: Voronoi regions with UE centroids denoting possible UAV coordinates.
the network service quality is the downlink received signal strength as experienced by UEs. We calculate the average received signal strength in the downlink for the UAV, planned and random picocell deployment scenarios under both LOS and NLOS channel conditions. The results are shown in Fig 3.
The picocell LOS and NLOS results can be thought of as upper and lower bounds on the channel performance of the picocell-UE link. In real life we expect the picocell-UEs to experience a mix of LOS and NLOS signalling, resulting in the received signal
LOS NLOS
Receiv
ed Signal Strength [dBm]
−
100
−
90
−
80
−
70
−
60
[image:4.595.56.279.102.312.2]UAV Planned Picocell Random Picocell Macrocell
[image:4.595.317.539.505.683.2]strength to lie somewhere in between these two extremes. It is apparent that the UAVs are able to outperform the picocells in providing a higher-quality downlink signal to serviced UEs. Even the planned picocell deployment under pure LOS conditions, representing the absolute best-case scenario for the picocells, is improved upon by approximately 3dB, with an additional 3dB improvement over the random picocell deployments. Employing UAVs results in an improvement of as much as 25dB over cases where the picocell maintains an NLOS channel. This superior performance is attributed to the efficient positioning algorithm of the UAVs, which allows them to orient around actual UE locations rather than expected concentrations. Because of this the UAVs can ensure a shorter range to their serviced UEs than the picocells.
As UAVs and picocells provide a superior received signal strength when compared to macrocells we expect the overall average received signal strength of all UEs in the window to increase as we increase the number of UAVs and picocells, and therefore the proportion of UEs that are offloaded from the macrocells. Fig. 4 shows the overall average received signal strength for the different deployment models.
The results agree with those shown in Fig. 3: the average received signal strength values are higher for the UAV deploy-ments than for the picocell deploydeploy-ments. This occurs not just because of shorter ranges between UAVs and their UEs but also because the UAV deployment is able to offload more UEs from the macrocell network. Recall that a picocell will offload up to M UEs inside its assigned UE subset, with the remaining UEs staying connected to the macrocell network. Inefficient picocell placement will result in certain subsets having more than M UEs and others fewer than M; as a result certain picocells will be overloaded while others will not be used to their full capacity. The effect of this is a smaller number of UEs offloaded from the macrocell network than if every subset utilised its picocell to full capacity without overloading it. Fig. 5 shows the average percentage of UEs in the windowW that are served by a UAV/picocell for a given number of deployed UAVs/picocells.
2 4 6 8 10
−
100
−
95
−
90
−
85
−
80
−
75
−
70
Number of UAVs/Picocells
Receiv
ed Signal [dBm]
[image:5.595.319.538.101.284.2]UAVs Planned LOS Planned NLOS Random LOS Random NLOS
Fig. 4: Average received signal strength for all UEs in the window
2 4 6 8 10
0
10
20
30
40
50
60
70
Number of UAVs/Picocells
UE Offload P
ercentage %
[image:5.595.316.537.518.694.2]UAVs Planned Random Maximum
Fig. 5: Percentage of UEs offloaded from the macrocells
It is apparent that the K-Means clustering algorithm in com-bination with optimal subset selection allows the UAVs to offload more UEs from the macrocell network than the picocell deployments. The UAVs offload almost the maximum possible number of UEs given the capacity constraint across the tested numbers of UAVs D. Because the UAVs are mobile and can
arrange themselves around UE locations in real-time they can shape their coverage areas to ensure that each UAV covers the exact number of UEs needed to take full advantage of its capacity without overloading it, leading to more efficient use of resources, including better offload performance.
Positioning Errors Up to now we have assumed perfect knowledge of UE positioning and precise placement of UAVs. Let us now consider a case where the UE locations are reported with an error of several meters and a similar error occurs in
Receiv
ed Signal Strength [dBm]
−
75
−
72.5
−
70
−
67.5
−
65
[image:5.595.56.284.534.723.2]No error 5m sd 10m sd 20m sd picocell
placing the UAVs. The authors of [18] report that 67% of OTDoA localisation errors are below 5 m and 95% are below 10 m; this can be closely approximated via a zero-mean normal distribution with standard deviation σ of 5 m. The authors of [19] cite 95% of cooperative localisation errors below 20 m which we approximate with a normal distribution with σ =
10 m. For every simulation of the window each UE location is displaced in a random direction by a random error vector of a given mean length. These perceived UE locations are then partitioned using the K-Means algorithm and UAV subsets are selected. The UAVs are also shifted with respect to the subset centroids in a random direction by a random error vector of the same mean and standard deviation; this represents imperfect navigation of the UAVs in their environment. Fig. 6 shows the received signal strength for UEs serviced by the UAVs given an error standard deviation σ setting of 5, 10 and 20 m. The results show that there is approximately a 2dB signal strength difference between the best and worst-case error scenarios. Under all tested error scenarios the UAVs perform better than the best-case picocell deployment. Even with this large error the UAVs still retain their aerial vantage and so benefit from LOS channels.
V. CONCLUSION
In this paper we have explored the concept of UAV-mounted picocells servicing UEs in a two-tier heterogeneous network. We have demonstrated how cluster analysis algo-rithms may be applied to UE positioning data to deploy a set of UAV picocells in a manner that maximises the service quality of the serviced UEs. Through simulations we have shown that as the UAVs are able to position themselves in real-time around actual UE locations rather than expected UE hotspots they outperform equivalent picocell deployments, even under ideal deployment conditions such as perfect LOS and full a prioriknowledge of hotspot centres. Even greater performance gains arise from the fact that the UAVs are able to maintain LOS to their serviced UEs with far greater reliability than terrestrial picocells when used in an outdoor scenario. These two performance benefits suggest that UAV platforms may complement fixed picocells in providing users with cellular service.
In future work we will expand the system model to consider spectrum allocation and UE traffic demand with UEs being served from a limited pool of resource blocks. This will enable us to consider the benefits that UAV mobility may bring to deliverable data rates and area spectral efficiency of two-tier networks. We will consider UAV backhaul as another resource requiring optimisation. Additionally, we may consider a scenario where UAVs are deployed to provide a specific type of service and so are positioned to prioritise certain UEs over others, subject to traffic type or service plan.
ACKNOWLEDGMENT
This material is based upon works supported by the Science Foundation Ireland under Grant No. 10/IN.1/I3007.
REFERENCES
[1] J. Andrewset al., “What Will 5G Be?”IEEE Journal on Selected Areas in Communications, vol. 32, no. 6, pp. 1065–1082, June 2014.
[2] D. Lopez-Perez, Y. Yang, and F. Gunnarsson,Heterogeneous Cellular Networks Theory, Simulation and Deployment, X. Chu, Ed. Cambridge University Press, 2013.
[3] M. Qutqut et al., “Dynamic Small Cell Placement Strategies For LTE Heterogeneous Networks,”IEEE Symposium on Computers and Communication (ISCC), pp. 1–6, June 2014.
[4] G. Djuknic, J. Freidenfelds, and Y. Okunev, “Establishing Wireless Communications Services Via High-Altitude Aeronautical Platforms: a Concept Whose Time Has Come?”IEEE Communications Magazine, vol. 35, no. 9, pp. 128–135, September 1997.
[5] K. Danielet al., “Channel Aware Mobility for Self Organizing Wireless Sensor Swarms Based on Low Altitude Platforms,”7th International Symposium on Wireless Communication Systems (ISWCS), pp. 145–149, September 2010.
[6] D.-T. Hoet al., “Performance Evaluation of Cooperative Relay and Par-ticle Swarm Optimization Path Planning for UAV and Wireless Sensor Network,”IEEE Global Communications Conference (GLOBECOM), pp. 1403–1408, December 2013.
[7] T. Heimfarth and J. De Araujo, “Using Unmanned Aerial Vehicle to Connect Disjoint Segments of Wireless Sensor Network,”IEEE 28th International Conference on Advanced Information Networking and Applications (AINA), pp. 907–914, May 2014.
[8] S. Rohde and C. Wietfeld, “Interference Aware Positioning of Aerial Relays for Cell Overload and Outage Compensation,”IEEE Vehicular Technology Conference (VTC Fall), pp. 1–5, September 2012. [9] W. Guo, C. Devine, and S. Wang, “Performance Analysis of Micro
Unmanned Airborne Communication Relays for Cellular Networks,”9th International Symposium on Communication Systems, Networks Digital Signal Processing (CSNDSP), pp. 658–663, July 2014.
[10] S.-F. Chou et al., “Mobile Small Cell Deployment for Next Gener-ation Cellular Networks,” IEEE Global Communications Conference (GLOBECOM), pp. 4852–4857, December 2014.
[11] A. Merwaday and I. Guvenc, “UAV Assisted Heterogeneous Networks for Public Safety Communications,” IEEE Wireless Communications and Networking Conference Workshops (WCNCW), pp. 329–334, March 2015.
[12] M. R. Anderberg,Cluster analysis for applications. Academic Press, 1973.
[13] J. A. Hartigan and M. A. Wong, “A K-means clustering algorithm,” Applied Statistics, vol. 28, pp. 100–108, March 1979.
[14] D. Arthur and S. Vassilvitskii, “K-means++: The advantages of careful seeding,”Proceedings of the Eighteenth Annual ACM-SIAM Symposium on Discrete Algorithms, pp. 1027–1035, January 2007.
[15] “TR 36.814: Further Advancements for E-UTRA Physical Layer As-pects (Release 9),” 3GPP, Tech. Rep., 2010.
[16] J. Zhanget al., “Propagation characteristics of wideband MIMO channel in urban micro- and macrocells,”IEEE 19th International Symposium on Personal, Indoor and Mobile Radio Communications, pp. 1–6, September 2008.
[17] G. M. Goerg, LICORS: Light Cone Reconstruction of States -Predictive State Estimation From Spatio-Temporal Data, 2013, R package version 0.2.0. [Online]. Available: http://CRAN.R-project.org/ package=LICORS
[18] J. del Peral-Rosadoet al., “Comparative Results Analysis on Positioning with Real LTE Signals and Low-Cost Hardware Platforms,”7th ESA Workshop on Satellite Navigation Technologies and European Workshop on GNSS Signals and Signal Processing (NAVITEC), pp. 1–8, December 2014.