Fig1. Location of the study area Study area
Morphometric Analysis of River Catchments Using
Remote Sensing and GIS (A Case Study of the Sukri
River, Rajasthan)
Narender Kumar
Rolta India Ltd, Senior Executive, 160101, Chandigarh.
Abstract- Remote Sensing techniques with GIS were used to
study the two sub-catchments of the upper catchment of Sukri River, Luni River basin. The measurement and analysis for the two sub-catchments were carried by using GIS for linear, areal and relief aspects. Both sub-catchments have low permeability, high surface run-off, and control of geologic structure. The morphometic analysis and measurements at sub-catchment level depicted that a good relationship existed among the morphometric parameters and the terrain characteristics. Out of both sub-catchments, sub-catchment 2 has more balanced aspects in respect to the sub-catchment 1. The analysis and measurement of basin morphometric aspects and their parameters in GIS will be of immense utility in river basin evolution, understanding the basin for natural resources assessment, planning and management at any scale. Out of two catchments, sub-catchment 2 is more prone for planning, management, and assessment in respect to the sub-catchment 1.
I. INTRODUCTION
he drainage basins are the response of slope, bedrock lithology, associate geology, and climate of that region which determines the characteristic of basins. Hence, quantities analysis and their interrelationship are important to support decisions for various themes. The method of quantitative analysis of drainage basins was developed by Horton (1945), and modified by Strahler (1964) in conventional means but recently GIS and Satellite Remote Sensing is a complete tool to analyze, to update and to correlate the measurements with periodic changes. Therefore, the results are more realistic and less time consuming. This study is to evaluate the nature of the drainage basins, and relationship with character of the terrain, and for deriving means to conserve and manage natural resources and combating natural hazards. The study is focused on linear, aerial, and relief aspects of the catchments using GIS tools.
This study is an attempt to answer the following questions: 1. To find out the use of modern tools i.e. Remote Sensing and GIS in morphometric analysis.
2. To answer the interrelationship between different aspects of the basin and to the character of the terrain.
3. To support decisions on the basis of result which may help for better implementation of the plans related to basins.
II. STUDY AREA
The study area encompasses the part of the upper catchment of the Sukri River. It extends between 730 50’39” to 740 7’11” west to east and 250 44’26” to 250 57’54” south to north on the globe, and administratively spreads in Pali and Ajmar districts of Rajasthan, India (Fig. 1). The river Sukri originates form Aravalli Hills and flow in west direction. It occupies an area of 403.59 km2. The elevation variation in the catchment lies in around 508 m with a general slope of 3.77 per cent from the mouth of outlet. The stratum of the western part of the catchment is formed of highly banded granite gneisses. The extreme eastern part of the catchments differs to some extent to its western part. It is characterized by the quartz- muscovite- biotite schist, which occurs interbedded with impersistent bands of quartzite and has a few intercalated calcareous bands as cacgneisses and impure marble (Sehgal, 1976).
III. MATERIALS AND METHODOLOGY
Fig.3 Exponential negative relationship between numbers of strems to their respective orders
Fig.4 Positive relationships between mean stream length to their respective orders.
4.36 4.61
3.67 9.00
3.94
4.31 4.57 7.00
1.00 10.00
1 2 3 4 5
Stream Order
B
ifu
rca
tio
n
r
a
tio
Sub catchment 1
Sub catchment 2
Fig.5 Bifurcation Ratio
were incorporated from LANDSAT ETM+, October, 22, 2000 (www.landsat.org). The ordering of drainage reached to the fifth order as highest order in both sub-catchments (Fig. 3). The software package which was used is ArcGIS, GIS software. The symbols of the parameters used are of standard usages. The parameters computed include stream orders and stream numbers, cumulative length and stream orders, mean cumulative length and stream orders, stream length ratio, bifurcation ratio, drainage density, stream frequency, form factor, circulatory ratio, elongation ratio, constant of channel maintenance, relative relief, percentage of slope, and relief ratio. The statistical methods were also applied to validate data and to obtain further precise results. The various aspects were studied for their inter-relationship which helps to depict the nature of the sub-catchments.
Fig2. The study area
IV. RESULTS
Linear Aspects
Stream numbers and Stream Orders: The numbers of streams (N) decreases geometrically with their respective stream orders (¬u). The exponential negative relationship between stream orders and numbers of stream to the respective orders confirm that the both sub catchments have complex terrain and compact bedrock (Nag,1998) (Fig.3) and has little bit variation. Mean Stream Length and Stream Order: Mean stream length is the product of stream length (L¬u) of any order to their numbers (N). The relationship is positive for both the sub catchments. It confirmed that the sub catchments are controlled by lithology and structure. It tends to be elongated as the orders increases (Hack, 1957). Out of the two, sub-catchment 2 seems more linear in relationship than sub-catchment 1 (Fig 4).
0.47 1.17
2.84 5.89
50.79
0.56 0.89
2.10 5.63 35.60
0.10 1.00 10.00 100.00
1 2 3 4 5 Stream Order(u)
M
e
a
n
St
re
a
m
L
e
n
g
th
(
Km
)
Mean Stream Length 1 Mean Stream Length 2 Expon. 1
Stream Length Ratio: Stream Length Ratio is the resultant of mean stream length of any order (Lu) to the mean stream length of next higher order (Lu+1). It is negatively related to their respective orders. The values of sub catchment 1 (0.66-0.16), and sub- catchment 2 (0.63-0.007) decreases with an increase in order with the exception of ratio of third order in the II sub catchments. It reveals that hard terrain is dissected and controlled by structure, and the streams have limited length of lower order steams (Joji, 2001). The ratio maintenance in the sub catchment 2 is more than sub catchment 2 (Fig. 5).
Bifurcation Ratio: Bifurcation ratio (Rb) is the ratio between the numbers of segments of any given order (Nu) to the number of segments of next higher order (Nu+1). The medium to extremely high Rb ratio of the both catchments shows the structural and lithologic control on the on-going drainage development. The high ratio shows elongated shape of the two sub-catchments (Nag, 1998). The ratios are four and above four (4.5 – 9 of sub catchment 1 and 3.9 – 7 of sub catchment 2) that shows higher structural control and elongated shape of the both sub catchments. The sub catchment 2 has lower values than sub catchment 1, which shows less dissection and less elongation (Fig. 6).
V. AREAL ASPECTS
Drainage Density: The total sum of length of segments (( ∑N)¬u) to the basin area (Au) is an expression of drainage density (Dd). The length per unit area is the measuring unit. The drainage density of the two sub catchments (2.93 km. Km-2 for sub catchment 1 and 2.59 km. Km-2 for sub catchment II) is an influence of structurally controlled low permeable rock strata with less vegetation cover. It increases high surface runoff, which cause erodability of rock, and loss of thin cover of topsoil. Out of the two, sub-catchment 2 has less drainage density in comparison to sub catchment 1.
Stream Frequency: The ratio between total number of segments (Nu¬) and area of a basin (A¬u) is termed as stream frequency (Fu¬). A dimensionless ratio is a measure of texture (in geomorphologic terms) of the drainage basin (Sharma, 1986). The ratio more than three shows the very rough texture and high run off on medium to high relief of low permeability (Reddy, 2002). Out of the two, sub-catchment I (4.64) facing more erosion in comparison to the sub catchment II.
Texture Ratio: The ratio between first order stream (Nu1) and perimeter of a basin (P) is termed as texture ratio (T). Terrain lithology, infiltration capacity, and relief are the determining factors of it (Reddy, 2002). The sub catchments with high ratio indicate low infiltration and complex relief with very low permeability. These collectively increase runoff to a higher level (Sujata, 1999). The sub catchment 1 (6.65) is more affected than sub catchment 2 (5.49).
Form Factor: The dimensionless ratio between basin area (Au) and the square of basin length (Lb2) is form factor (Rf). The shape of basin is identified by this ratio. Zero value confirms highly elongated shape and one indicates circular shape of the basin. Low form factor ratio will be for basins of flatter peak flow for longer duration (Biswas,1999) with less side flow for shorter duration and main flow for longer duration (Reddy, 2002), and vice versa for high ratio. The values of the two sub-catchments are 0.24 and 0.26, which shows flatter peak flow for longer duration in moderately elongated shape. Both the sub-catchments are of the same character.
Circularity Ratio: The dimensionless ratio of area of basin (Au) to the area of the circle having the same perimeter of the same basin (Miller, 1935). Similar to form factor, value nearer to one means more circular shape (Strahler, 1964). Runoff in circular shape basins gets more time to stay. Therefore, circular to elongate basin is inversely related in their character of movement (rapid or slow) of run off to outlet and infiltration. These are further subjected to lithology, slope and land cover of the basins or sub catchments. The both sub-catchments have values less than 0.5 which indicate elongated shape.
Elongation Ratio: It is the ratio between diameter of the circle having same area as of the basin and to the length of the same basin. Higher value indicates high infiltration capacity and low run off conditions and vice versa (Reddy, 2002). The values (0.50 for sub catchment 1 and 0.52 for sub catchment 2) indicate high run off and elongated shape of sub catchments.
Relief Aspects
The height of the mouth of the catchment is 320 meters from the sea level. The relief of catchment varies in between 508 m from the height of the catchment mouth. The percentage of slope is approximately 3.77 per cent.
Relief Ratio: Relief ratio (Rn) is the response of horizontal distance between two points (H) to the vertical difference between the same two points (L). The low values, 0.04 and 0.02 for sub catchments 2 and 1 respectively are results of low permeable and less slope. As the basin area decrease, relief ratio increases and vice versa (Joji, 2001).
Constant of Channel Maintenance: It is the inverse of drainage density and expressed with dimension of square per unit. It is defined as the area of the basin needed to develop and sustain a unit length of stream channel (Schumm, 1956).
Permeability, rock type, relief, vegetation and duration of rainfall are the affecting factor. The low values of sub-catchments 2 (0.39) and 1 (0.34) indicate that there is low permeability, moderate to steep slope and high surface run off.
VI. RELIEF ASPECTS
The height of the mouth of the catchment is 320 meters from the sea level. The relief of catchments varies in between 508 m from the height of the catchments mouth. The percentage of slope is approximately 3.77 per cent.
Relief Ratio: Relief ratio (Rn) is the response of horizontal distance between two points (H) to the vertical difference between the same two points (L). The low values, 0.04 and 0.02 for sub catchments 2 and 1 respectively are results of low permeable and less slope. As the basin area decrease, relief ratio increases and vice versa (Joji, 2001).
Constant of Channel Maintenance: It is the inverse of drainage density and expressed with dimension of square per unit. It is defined as the area of the basin needed to develop and sustain a unit length of stream channel (Schumm, 1956). Permeability, rock type, relief, vegetation and duration of rainfall are the affecting factor. The low values of sub-catchments 2 (0.39) and 1 (0.34) indicate that there is low permeability, moderate to steep slope and high surface run off.
Inter-Relationship among Areal, Linear, and Relief Aspects
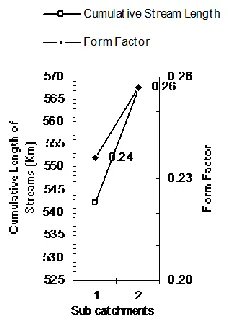
Cumulative Length of Streams vs. Form Factor: The high cumulative length and low form factor values indicate that all streams more or less equally contribute to the run off for a longer duration. Therefore, intensity of erosion is high in both the sub catchments. The sub-catchment 2 would be preferred having higher values in case of cumulative stream length and the same value in case of from factor to the sub catchment 1 (Fig 7).
Cumulative Length of Streams vs. Drainage Density:
The inter-relationship between two variables indicates more length and drainage density. The sub-catchment 2 has high cumulative length and low drainage density in respect to the sub-catchment 1. It reveals that the sub sub-catchment 2 has more capacity to sustain more streams than sub-catchment 1. Sub catchment 1 faces low infiltration and more erosion prone than sub catchment 2 (Fig 8).
Area vs. Drainage Density: The more drainage density and less area of sub catchment 1 shows more degradation than sub catchment 2, which has more area and less drainage density (Fig. 9).
[image:4.612.388.501.54.500.2]Fig. 7 Cumulative Length vs. Form Factor
[image:4.612.99.213.363.524.2]Fig. 8 Cumulative Length vs. Drainage Density
Total Segments vs. Cumulative Length of Segments:
The number of streams of the both sub catchments exceeds over their stream length. It indicates very low permeability, structural
control over drainage development, and moderate to high relief. The sub catchments 2 and 1 show very less infiltration, and shorter duration water flow. But the sub catchments 2 have less cumulative length and less number of streams in comparison to sub catchments 1(Fig. 10).
VII. MAJOR FINDINGS
The study has undertaken by using modern tool and techniques Remote Sensing and GIS which leads towards more precise and accurate results. In this case study, some morphometric parameters has been studied: individually and in inter-relationship among them. The analysis reveals that low infiltration; high surface run off, low permeability and structure of the catchments (sub-catchments) controls the development and sustenance of drainage. The results have an agreement for any drainage basin of similar, lithology, associate geologic and structure with same climatic conditions. Sub-catchment 1 has less Various studies can be undertaken similar to the present with high resolution and geometrically correct satellite data, which helps to understand surface and sub surface realities for conservation and management of natural resources, and combating natural hazards.
TABLES
Table 1. Morphometric aspects of Sub-catchment 1.
Table 2. Morphometric aspects of Sub-catchment 2.
Table 3. Definition and dimensions for sub-catchments 2 and 1.
Aspects Sub catchment 1 Sub catchment 2 Dimension Definition
Area (Au 184.81 218.78 Km-2 -
No. of Stream (N 857 722 - -
Length of basin (Lb 27.29 29.14 Km -
Perimeter (P 99.79 99.04 Km -
Area of Circle 792.56 778.66 Km
-2 -
Radius of Circle 7.66 8.34 Km -
Horizontal distance between two vertical points
20 14 Km H = Horizontal distance between two vertical points
Id
u N L L Standard
Deviation
Co-efficient of Variability Rb
L
__
__L Rl
1 1 662 308.00 308.00 0.278 1.672 4.36 0.47 0.47 0.66
2 2 152 106.60 414.60 0.593 1.182 4.61 0.70 1.17 0.42
3 3 33 55.30 469.90 1.591 1.053 3.67 1.68 2.84 0.55
4 4 9 27.40 497.30 2.383 1.277 9.00 3.04 5.89 0.07
5 5 1 44.90 542.20 0 0 0.00 44.90 50.79 0.00
Id u N L L Standard
Deviation
Co-efficient of Variability Rb
L
__
__L Rl
1 1 544 302.90 302.90 0.337 1.652 3.94 0.56 0.56 0.63
2 2 138 122.30 425.20 0.87 1.018 4.31 0.89 1.45 0.42
3 3 32 67.10 492.30 1.405 1.492 4.57 2.10 3.54 0.37
4 4 7 39.40 531.70 2.875 1.957 7.00 5.63 9.17 0.16
[image:5.612.111.214.63.270.2]5 5 1 35.60 567.30 0 0 0.00 35.60 44.77 0.00
Vertical distance between two point 399 508 Meters L= The difference between two Vertical two point
Cumulative Length (L 542.2 567.3 Km L= Lu1+2+3…
Mean Cumulative Length (__L 50.79 44.77 Km __L = L__u1+2+3….
Stream Length Ratio (Rl - - -
Rl = L
__
u/ L
__ u + 1
Bifurcation Ratio (Rb - - - Rb = Nu/Nu+1
Drainage Density (Dd 2.93 2.59 Km/Km2 Dd= L/Au
Stream Frequency (Fu 4.64 3.30 No. Km-2 Fu =Nu/ Au
Form Factor (Rf 0.24 0.26 - Rf =Au/ Lb2
Texture Ratio (T 6.64 5.49 No. Nu1.km
-1
T = Nu1/Au
Circularity Ratio (Rc 0.23 0.28 - Rc = Au/ area of the circle having same P
Elongation Ratio (Re 0.52 0.50 - Re= diameter of the circle having same area / Lb
Relative Relief (Rhp 0.34 0.51 Per cent Rhp = H/P*100
Relief ratio (Rn 0.02 0.04 - Rn =H/L
REFERENCES
[1] Gautam, N.C., et. al., 1995, Concept and Delineation of Watershed for Development; Annals, NAGI, Vol. 15, No.1, June 1995.
[2] Goudie, Andrew, et. al., 1981, Geomorphological Techniques, Edited to British Geomorphological Research Group.
[3] Horton,R.E., 1945, Erosional Development of streams and their drainage basins-hydrophysical approach to Quantitative morphology. Bulletin of Geological Scoiety of America 56.
[4] Joji, V. S., et. al., 2001, Morphometric Analysis of Fourth Order Sub-basin of Vamanapuram River basin, Southern Kerla, India; Indian Journal of Geomorphology, Vol. 6 No.1-2.
[5] Landsat.org,
http://35.8.163.34/?version=Website&sensor=ETM&path=148&row=0 42, Path 148 and Row 42
[6] Miller, V. C., 1953, A Quantitative Geomorphology study of drainage basin characteristics in the Clinch Mountain Area, Virginia and Tennessee; Department of Geology, Columbia, Technical Report 3.
[7] Nag, S. K., 1998, Morphometric Analysis Using Remote Sensing Techniques in the Chaka Sub-basin, Puralia District, West Bengal; Journal of the Indian Society of Remote Sensing, Vol. 26, No. 1-2.
[8] Pawar,D.H.,Raskar,A.K. “Linear aspect of basin Morphometry of Panchaganga river ,Kolhapur, Western, International Referred Research Jour.,2:95-97,2011.
[9] Reddy, G. P. Obi, et. al., 2002; GIS for Morphometric Analysis of River basins; GIS India, September 2002.
[10] Schumm, S.A., 1956, Evolution of Drainage Systems and Slopes in Badlands at Perth Amboy, New Jersey, Bull Geological Society America, 67.
[11] Sehgal, K. K., 1976, Rajasthan District Gazetteers, Pali.
[12] Sharma, V. K., 1986, Geomorphology, Earth Surface Processes and Land Forms.
[13] Strahler, A. N., 1964, Quantitative Geomorphology of Drainage basins and Channel Networks: Section 4-II, Handbook of Applied Hydrology, VT Chow (ed).
[14] Sujata, Biswas et. al., 1999, Prioritization of Sub watersheds based on Morphometric Analysis of Drainage Basin: A Remote Sensing and GIS Approach, India Society of Remote Sensing.
[15] Thakkar, A., Diman .S.D. “Morphometric Analysis and Prioritization of Mini Watershed in Mohr Watershed,Gujrat using Remote Sensing and GIS Techniques”,Jour. Ind. Soc. of Remote Sensing,35(4):313-321,2007.
AUTHORS
First Author – Narender Kumar , Rolta India Ltd, Senior