The greatest Sexibility with regard to choice of stationary phase, particle size, layer thickness, and chamber type is provided by RPC. Because of the availability of suitable vapour phases and combina-tion of development modes, RPC offers the greatest separating power both in terms of the amount of sample and number of compounds to be separated.
It can be stated that PPC covers a special range of preparative separations. PPC does not compete with column liquid chromatography for puriRcation and isolation of compounds from a complex matrix. In-stead, the two approaches are complementary and together they enable successful and rapid separation. It is expected that as a result of development of modern forced-Sow and multiple-development tech-niques, PPC will further expand its importance in the isolation and puriRcation of natural and synthetic products.
See also: II/Chromatography: Liquid: Large-Scale Liquid Chromatography. Chromatography: Thin-Layer (Planar): Densitometry and Image Analysis; Instrumentation; Modes of Development: Conventional; Modes of Development: Forced Flow, Overpressured Layer Chromatography and Centrifugal; Spray Reagents.
Further Reading
Geiss F (1987)Fundamentals of Thin Layer Chromatogra-phy(Planar Chromatography). Heidelberg: HuKthig.
Hostettmann K, Hostettmann M and Marston A (1996) Preparative Chromatography Techniques,Applications in Natural Product Isolation. Berlin: Springer.
Nyiredy Sz (1995) Preparative layer chromatography. In: Sherma J and Fried B (eds)Handbook of Thin-Layer Chromatography. New York: Dekker, pp. 307}340. Nyiredy Sz (1992) Planar chromatography. In: Heftmann
E (ed.)Chromatography. 5th edn. Amsterdam: Elsevier, pp. A109}A150.
Nyiredy Sz, Erdelmeier CAJ and Sticher O (1986) Instru-mental preparative planar chromatography. In: Kaiser RE (ed.)Planar Chromatography. Heidelberg: HuKthig, pp. 119}164.
Nyiredy Sz, Erdelmeier CAJ, Dallenbach-Toelke K, Nyiredy-Mikita K and Sticher O (1986) Preparative on-line overpressured layer chromatography (OPLC): A new separation technique for natural products. Jour-nal of Natural Products49: 885.
Nyiredy Sz, Botz L and Sticher O (1989) ROTACHROM威: A new instrument for rotation planar chromatography (RPC).Journal of Planar Chromatography2: 53}61. Nyiredy Sz, Dallenbach-ToKlke K and Sticher O (1988) The
‘PRISMA’ optimization system in planar chromatogra-phy.Journal of Planar Chromatography1: 336}342. Poole CF (1992) Chromatography Today. Amsterdam:
Elsevier.
Szabady B and Nyiredy Sz (1995) The versatility of multiple development in planar chromatography. In: Kaiser RE (ed.) Modern TLC. DuKsseldorf: Verlag Chemie. pp. 345}367.
Sherma J and Fried B (1995) Handbook of Thin-Layer Chromatography. New York: Dekker.
Radioactivity Detection
T. Clark, Zeneca Agrochemicals, Jealott’s Hill Research Station, Bracknell, Berkshire, UK Copyright^ 2000 Academic Press
Introduction
Thin-layer chromatography (TLC) is a technique which has been applied to a wide range of chemicals since its introduction in the early 1950s. The only limitation to its use is that a suitable method of detection must be available; however, this limitation is removed when the compounds of interest are radiolabelled. Nevertheless, since the introduction of thin-layer radiochromatography (TLRC), one major drawback in gaining widespread acceptance has been the lack of an easy method to quantify the distribu-tion of radioactivity whilst still maintaining good resolution. The available detection methods have either been very time-consuming (e.g.
autoradiogra-phy) or labour-intensive (e.g. zonal analysis) or could not match the resolution of the TLC separation itself. Over the years TLRC detectors have evolved and signiRcantly improved, starting with scanners in the 1960s, followed by linear analysers in the 1980s and now the new 1990s generation of bioimaging ana-lysers and InstantImager. The limitation of the scan-ners and linear analysers is that their resolution is lower than can be achieved by TLC itself. New detector technology such as phosphor imaging will lead to a renaissance in the use of TLRC due to the excellent resolution.
Detection and Measurement
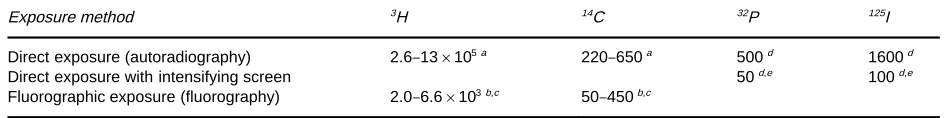
Table 1 Approximate lower detection limits on TLC plates for various exposure methods (dpm cm\2with a 24-h exposure)
Exposure method 3H 14C 32P 125I
Direct exposure (autoradiography) 2.6}13;105a 220}650a 500d 1600d
Direct exposure with intensifying screen 50d,e 100d,e
Fluorographic exposure (fluorography) 2.0}6.6;103b,c 50}450b,c
aAverage range for direct exposure of film at temperatures between!78.5 and 253C.
bTreated with a 7% solution of 2,5-diphenyloxazole (PPO) in diethyl ether and exposed at a temperature of!783C. cTreated with a mixture of 0.5% 2,5-diphenyloxazole (PPO) in methyl anthranilate at!803C with Kodak X-OMAT AR film. dExposed at a temperature of!783C.
ePreexposed Kodak X-OMAT R film with a calcium tungstate X-ray intensifying film. (Reproduced with permission from Clark and Klein,
1996.)
analysis depends on the available equipment, which generally depends on the amount of money available, and the type of experiment and information required. The various detection methods are discussed below and the technical descriptions in the present review provide information relating to the state-of-the-art modern-day detectors.
Autoradiography
Autoradiography is a detection method in which X-ray or photographicRlm is exposed to emissions from radioisotopes on TLC plates to produce an image on the Rlm. After exposure (exposure time depends on the amount of radioactivity per zone), the Rlm is developed to reveal the location of the areas of radioactivity as darkened spots or zones of varying optical density. The density is related to the amount of radioactivity in the spot/zone. QuantiRcation can be done either by densitometry using a calibration curve produced by exposure to radioactive standards or by removing the areas of radioactivity (scrap-ing/cutting) and counting them by liquid scintillation. The three principal exposure methods are direct ex-posure (autoradiography), direct exex-posure with an intensifying screen and Suorographic exposure (Suorography). The approximate minimum amounts of radioactivity that are required to give a suitable image with a 24 h exposure are shown inTable 1for the three different exposure methods.
Detection by direct exposure autoradiography involves intimate contact of the TLC plate with a photographic or X-ray Rlm. Direct exposure is useful for all of the -emitters, with the possible exception of low-level tritium-labelled samples. To improve the detection efRciency for -emitting e.g. 125I) and high energy-emitting isotopes (e.g.32P), the
plates are exposed with intensifying screens placed behind theRlm. Commercially available intensifying screens consist of plates coated with inorganic phos-phors. The fraction of radiation that passes com-pletely through theRlm is absorbed by the phosphor,
which in turn emits light that produces additional exposure of theRlm. The enhancement in sensitivity using an intensifying screen with preexposedRlm (see preSashing below) is of the order of 7}10-fold for 32P and 16-fold for 125I when compared to direct
exposure without the screen.
Weak -emitting isotopes (e.g. 3H), adsorbed on TLC adsorbents, are inefRciently detected by direct exposure to X-rayRlms. The principal reasons for this inefRciency are the low energy and short range of the -emissions and the barrier imposed by the protective coating of the X-rayRlm. To increase the sensitivity for these isotopes, a technique termedSuorography is employed. Fluorography involves the overcoating or impregnation of a scintillator into the TLC plate followed by direct exposure of the treated plate to the X-rayRlm. The scintillant, being in direct contact with the isotope, emits light when activated by the-emission and exposes theRlm photographi-cally. For efRcient detection, the spectral sensitivity of theRlm should be matched to the wavelengths of light emitted by the scintillator. The scintillants can be incorporated by mixing with the adsorbent dur-ing preparation of the TLC plate or applied after development. Fluorographic reagents, such as 2,5-diphenyloxazole (PPO), can be added by spraying or dipping the plates.
The sensitivity of the technique can be further im-proved by lowering the exposure temperature and pretreating theRlm by partially exposing theRlm to a controlledSash of light (preSashing) before expo-sure to the radioactive sample. Preexpoexpo-sure to aSash of light greatly increases sensitivity and corrects the nonlinear response at low exposure levels. For max-imum enhancement in sensitivity, both preSashing and cooling to temperatures between !70 and
!803C are utilized.
Zonal Analysis
followed by measuring the associated radioactivity with each spot or zone. The zones are removed either by scraping the adsorbent from the plate (plate scrap-ing) or by cutting pieces fromSexible-backed plates and transferring the segments into counting vials. In an alternative procedure, which allows isolation of the radiolabelled sample, the plates are segmented and the radioactive components are eluted from the adsorbent with solvents and counted. To ensure max-imum recovery of radioactivity by elution with sol-vent, the adsorbent shouldRrst be crushed to aRne powder. Measurement of radioactivity is generally accomplished using a liquid scintillation counter for the weak-emitters. For the-emitters, the sectioned zones are counted without further sample prepara-tion in an appropriate-counter.
This technique is relatively sensitive and provides quantitative detection for samples containing low levels of radioactivity. Single peaks containing 100 d.p.m. can be readily detected. Zonal analysis has been reported to be both as sensitive and speciRc as gas chromatographic-mass spectrometric analysis in the assay of [14C]-labelled clinical samples. When the radiochromatograms are cut into sections and quanti-Red using a -counter for the analysis of -emitting isotopes, the method is as precise as TLC scanning.
Radiation Detectors
Over the last 30 years or so the detection of radioac-tivity on TLC plates has taken dramatic leaps for-ward. Prior to the introduction of radiation detectors, the classical method used for the detection and quan-tiRcation of radioactivity on a plate involvedRrstly exposure to X-ray Rlm. This could take from a few hours up to 1}2 months and this technique only located the radioactivity. The second step after loca-tion was quantiRcation which was achieved by re-moving the zone of interest, either by scraping off the silica gel or by cutting away if the plates were alumi-nium or plastic, followed by liquid scintillation counting. Such a procedure is extremely labour-inten-sive and is limited in terms of accuracy and resolution (see above).
TheRrst radiation detectors were called radioscan-ners and these were developed and introduced in the early 1960s. This was a major step forward in the automatic detection and subsequent quantiRcation of radioactive components on TLC plates. The sensitiv-ity and resolution of the instruments were not very high but peaks could be detected and their relative amounts subsequently quantiRed. At around the same time, spark chambers were also developed for use with TLC plates. Although, these detectors could locate individual components on TLC plates, quan-tiRcation was not possible.
Another major step forward for radio-TLC came in the early 1980s when the so-called linear analyser was introduced. This instrument was easier to use and more sensitive than the old scanners and was automated to the extent that up to four plates could be run overnight. As a consequence, improved quan-titative results were obtained and analysis time was shortened. However, resolution was still not as good as that obtained by using autoradiography and two-dimensional plates could not easily be evaluated.
Currently there are a number of instruments avail-able which have equal resolution to that obtained with autoradiography or are at least approaching it. These instruments include those using the new phos-phor imaging technology, the multi-wire system, or the multi-detector system (micro-channel array detector).
The basic functioning of all these detectors is out-lined below and a comparison of the advantages and disadvantages of each detector is given later.
Spark chambers The spark chamber is an easy-to-use, low cost technique for photographically locating areas of radioactivity on TLC plates. Exposure times are relatively short and the images obtained on Polar-oidRlm can be quickly transferred back to the orig-inal chromatogram using an inbuilt episcope print projector. This means that the areas of radioactivity can then be removed for efRcient counting using a liquid scintillation counter. The spark chamber can also be used for the rapid qualitative screening of plant and tissue sections to assess the degree of uptake.
Reviews of spark chambers and their uses have been published previously. Essentially, the spark chamber consists of electrodes contained in a cham-ber Rlled with a mixture of argon containing 10% methane, and this gives a high sensitivity to -radi-ation. The gas is ionized by radioactive emissions and these emissions are recorded onRlm with a camera. The Polaroid Rlm integrates the individual Sashes produced over a suitable exposure period. Due to the intensity of the sparks theRlm is rapidly saturated, leading to blackening of the Rlm, and hence direct quantiRcation is not possible.
Figure 1 Schematic diagram of a linear analyser detector with a resistive anode wire. (Reproduced with permission from Clark and Klein, 1996.)
be printed on a suitable recorder or integrator-plot-ter. When the speed of the scanner and recorder are synchronized the exact location of the radioactivity on the TLC plate can be obtained by aligning the chromatogram with the TLC plate. Some manufac-turers continue to produce radioscanners but, due to the increasing number of new detection systems (de-scribed below) which have better sensitivity and res-olution, the number of radioscanners available for quantitative TLC has decreased.
Linear analysers The introduction of the linear ana-lyser provided a great boost for the users of radio-TLC since these detectors brought with them not only improved sensitivity and resolution but also much-improved automation. For example, up to four plates, each with several tracks, can be measured overnight and the chromatograms and accompanying quantitative tables automatically printed out. For the Rrst time in thisReld the resultant data can be stored and reprocessed at a later date. With the development of new desktop publishing software, the chromato-grams and quantitative results can be directly trans-ferred into reports or publications.
The linear analysers currently used are based on imaging counters developed for high energy physics and medical imaging in the late 1960s and early 1970s. Essentially, the detector head moves automati-cally to any track on the TLC plate. Once in position the head is gently lowered on to the surface of this track of the TLC plate and the instrument is then ready to begin measurement. At this point the de-tector has formed a counting chamber since the TLC plate itself has closed the opening of the detector, making the counting chamber gastight. Immediately the detector is resting on the plate theSow of count-ing gas (argon/methane) is automatically activated and within a few seconds the counting chamber is purged of air andRlled with the counting gas.
There are two kinds of systems available today which function in a similar way: each utilizes a differ-ent design to locate the exact position of the radioac-tivity on the plate. One system uses the resistive anode technique and a schematic diagram of this detector is shown inFigure 1. High voltage is applied to a 25 cm anode wire Rxed along the length of a windowless detector (1 cm wide) and positioned directly above the TLC plate. This wire is constructed of carbon-coated quartz and has a high electrical resistance. When a radioactive emission enters the detector, the gas is ionized and electrons are produced along the particle track. The free electrons are accel-erated towards the anode wire by the electric Reld produced by the high voltage. The electrons continue to ionize more gas as they approach the wire, and the
resulting number of electrons becomes large enough to be detected electronically. The pulse of electrons is collected on the anode wire near the position of the initial ionization. The charge divides in the wire, and pulses appear in the ampliRers located at both ends of the wire. The amplitude of the pulse measured by each ampliRer is proportional to the resistance be-tween that end of the wire and the position where the electrons were collected. The ratio of these two pulses is linearly related to the original position of the event on the wire. The position of each event is calculated and stored in a computer memory to provide a digital image of the distribution of radioactivity on the plate.
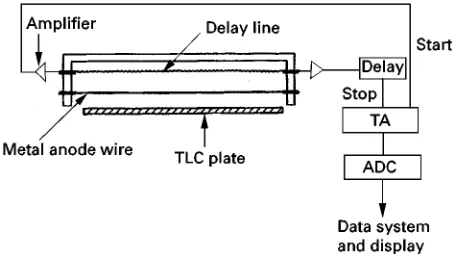
The second type of detection system uses the delay wire technique; a schematic diagram of this detector is shown inFigure 2.
The -radiation (fast electrons) emitted from the radioactive source on the plate ionizes the counting gas which has been speciRcally chosen so that this process can freely take place. This is the primary mode of ionization and the resultant charged par-ticles, free electrons and positive ions, are then accel-erated towards the anode wire and cathode, respec-tively. In this primary mode of ionization the free electrons are accelerated to such an extent that they themselves cause ionization of the counting gas, pro-ducing further free electrons and ions and this is the secondary ionization mode. This continues, causing an avalanche of ions from the primary point of ionization towards the anode wire.
Figure 2 Schematic diagram of a linear analyser detector utiliz-ing a delay wire technique. TA, Time-to-amplitude; ADC, analog-to-digital converter. (Reproduced with permission from Clark and Klein, 1996.)
ions sometimes combine with electrons, producing ultraviolet radiation of sufRcient energy to cause fur-ther ionizations in a process known as the photo-electric effect. Once sufRcient ionization has taken place, a spark is produced, which gives rise to a pulse in both the anode and cathode. The amplitude of the pulse is proportional to the number of ions produced and hence this type of detector is generally called a proportional counter.
The above is a description of the principle of detec-tion. The location of the source of the ionizations is obtained by making use of a delay wire. The delay wire is a very thin wire which is wound over the cathode and pulses pass along this wire in both direc-tions. The pulses are detected by ampliRers at each end of the wire. The arrival of a pulse at one end starts the time-to-amplitude (TA) circuit, while the other pulse is delayed and provides a stop signal in the circuit. The difference between the time of arrival at the two ends of the wire can thus be measured and is proportional to the position of the initial ionization. An analog-to-digital converter (ADC) converts the TA signal to a digital position value that is processed by the data system.
Using this method of detection, the whole of the delay line remains active and thereby the entire length of the chromatogram can be measured at the same time. Once one track of a TLC plate has been mea-sured according to the pre-set time, it automatically moves to the next and the measuring process is re-peated.
Radioanalytic imaging system (Ambis) When this instrument was introduced in about 1988, a descrip-tion of its funcdescrip-tioning was reported. The Ambis 4000 directly detects -particles from a wide variety of isotopes and is suitable for gels, blots, TLC plates and any sample type of the dimensions 20;20 cm. It is
reported in the company literature that this instru-ment can be 100 times faster than X-rayRlm.
The detector consists of 3696 individual detector elements (each giving a data point) conRgured in a hexagonal array. Image quality is improved by increasing the number of data points and this is achieved by moving the sample through 72, 144 or 288 discrete positions. Therefore, counts are recorded in 266 112, 532 224 or 1 064 448 data points (i.e. 3696;number of discrete positions) from which an image is obtained. This image can then be dis-played on a monitor and the areas of radioactivity quantiRed. A background detector which operates concurrently and in a similar way is located above the main detector, and compensates for background radiation.
Different resolution plates, which have different size and shape apertures, can be inserted into the instrument and these plates control the resolution and efRciency (i.e. sensitivity) of the instrument. In gen-eral, this means that, using the correct aperture, the detector can be tuned to obtain maximum resolution (at the expense of sensitivity). Conversely, when the instrument is tuned for maximum sensitivity, this is at the expense of resolution. Therefore, aperture choice is governed by sample size and the number and res-olution of components required within the sample.
Multiwire Proportional Counters (MWPC)
Digital Autoradiograph (Berthold) This two-di-mensional detector is reported to be 100 times more sensitive than the linear analyser and measures all areas of radiation from a 20;20 cm surface simulta-neously.
The radio-TLC plate is placed on the measuring table and is then automatically loaded into the de-tector, which also controls theSow of the P-10 count-ing gas (90% argon#10% methane). The detector is principally a two-dimensional position-sensitive MWPC. Essentially, it consists of three parallel wire planes,X,YandZ, each with 100 wires. The spacing between the planes and the wires is only a few mil-limetres. The central plane (Z) is maintained at a pos-itive potential of 1800 V and the counting chamber is Rlled with P-10 gas. Charged pulses are generated on theZplane wires by ionizing particles (-particles). The orthogonally crossed wire planesXandY, below and above Z, pick up the charge signals from the
Figure 3 Schematic diagram of the microchannels of the In-stantImager. (Courtesy of David Englert, Canberra Packard, Meriden, CT, USA.)
Figure 4 Schematic diagram of the principle of detection of the PhosphoImaging analyser. (Courtesy of Fuji Photo Film Co. Ltd, Tokyo, Japan.)
InstantImager(Canberra Packard) This microchan-nel array detector provides direct electronic detection and real-time imaging of radioactivity onSat surfaces such as gels, blots, tissue slices and, of course, TLC plates. The detector consists of an array of 210 420 so-called microchannels (diameter 400m) in a 20; 24 cm multilayer plate. The microchannel array plate is a laminated surface about 3 mm thick with alter-nating conductive and nonconductive materials. A volt-age step gradient is applied to the successive conduc-tive layers to create a high electric Reld (approxim-ately 600 volts mm\1) in the microchannels. The -particle emitted from the radioactive source ionizes a gas (argon with small amounts of carbon dioxide and iso-butane) in one of the microchannels. The electrons produced are accelerated by the high electricReld in the microchannel, further ionizing the gas, resulting in a cloud of electrons. In this way the microchannels serve as both collimators and preampliRers.
The cloud of electrons migrates up an electricReld gradient into a multiwire chamber located on top of the multilayer. This chamber consists of an anode plane of thin anode wires and two cathode planes (X
andY), as described above for the Digital Autoradio-graph. Further avalanche ampliRcation occurs, result-ing in electric pulses in the XandYcathode tracks. The resultant signals are digitized and then decoded to identify the microchannel in which the primary ionization took place, hence locating the position of the radioactive emission. A schematic representation of the microchannel detector is shown inFigure 3.
BioImaging/phosphor imaging analysers The phos-phor imagers make use of an imaging plate which is a two-dimensional sensor formed by a layer ofRne crystals of photostimulable phosphor (BaFBr : Eu2#). The emitted-energy is stored upon exposure. In the reading unit the imaging plate is scanned with a laser beam. The energy of the laser stimulates the stored
electrons to return to the ground state and to emit luminescence in proportion to the recorded radiation intensity. This luminescence is collected in a photo-multiplier tube and converted into an electrical sig-nal. A schematic diagram of the principle of detection is shown inFigure 4.
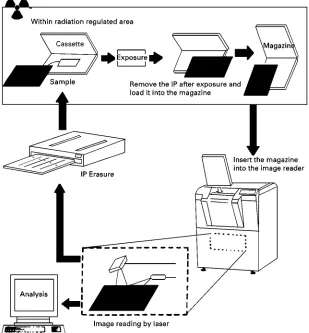
Data recording and analysis are carried out at a workstation. After reading, the image data on the imaging plate can be erased by exposure to incan-descent light and thus the plate can be reused. Imag-ing plates for the normal weak-emitters are able and a specially designed plate for tritium is avail-able. An illustration of the whole imaging process is given inFigure 5.
A prerequisite for good results is to expose the plates in a lead shielding box, particularly those that require longer than 1}2 h exposure time. In this way the contribution of natural background radiation is reduced.
Figure 5 Illustration of the phosphoimaging process. IP, Imaging plate. (Courtesy of Fuji Photo Film Co. Ltd, Tokyo, Japan.)
A further instrument using similar technology, re-cently introduced by Packard, is the Cyclone2+. In this instrument, a solid-state diode laser and confocal optical system moves down the storage phosphor screen as the screen rotates on a carousel. In this pro-cess the laser excitation and light collection optics remain in aRxed position relative to the screen sur-face, so that laser bleed associated with other de-tectors is eliminated. Furthermore, light collection is increased compared to that obtained withRbreoptic bundles.
A range of imaging plates is now available and these should be chosen according to instrument and requirement. Currently, Fuji is the leading supplier and offers the BAS III, MP, SR, TR and ND imaging plates: care must be taken when selecting a plate because not all plates can be used with all instru-ments. A range of cassette sizes is also available from Fuji according to plate size.
Comparison of TLRC Detection Methods
As described at the beginning of this article, there are three principal techniques for the analysis of
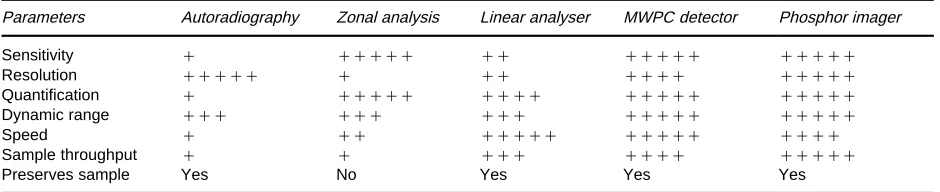
chromato-Table 2 Comparison of thin-layer radiochromatographic analysis techniques
Parameters Autoradiography Zonal analysis Linear analyser MWPC detector Phosphor imager
Sensitivity # ##### ## ##### #####
Resolution ##### # ## #### #####
Quantification # ##### #### ##### #####
Dynamic range ### ### ### ##### #####
Speed # ## ##### ##### ####
Sample throughput # # ### #### #####
Preserves sample Yes No Yes Yes Yes
#####, Excellent;####, very good;###, good;##, satisfactory;#, poor. (Reproduced with permission from Clark and Klein, 1996.)
gram development cannot be seen in real time. Also, for a single plate the analysis time with the MWPC detectors is quicker but when more sample through-put is required, then the phosphor imagers have the advantage since many plates can be exposed simulta-neously.
In general, as the newer range of detectors were brought on to the market they were very expensive in comparison to the linear analysers. However, with increasing competition and technological develop-ments, prices are slowly coming down.
Future Developments in TLRC
The new range of detectors have signiRcantly im-proved sensitivity and resolution; most have a resolu-tion of under 1 mm and the phosphor imagers are able to obtain a resolution of as low as 0.025 mm. Also, current detectors are now able to detect spots of radioactivity on a plate containing less than 10 d.p.m. in a relatively short period of time. As sensitivity and resolution are continually improving, the future ma-jor development of TLRC probably lies in the realm of full automation using robots, from the application of multiple samples to the TLC plate, to development and drying, transport to the detector, measurement andRnally printing of the chromatogram and quan-titative results.
Further Reading
Clark T and Klein O (1996) Thin-layer radiochromatogra-phy. In: Sherma J and Fried B (eds)Handbook of Thin Layer Chromatography, 2nd edn. New York: Marcel Dekker.
Filthuth H (1982) Radioscanning of TLC. In: Touchstone JC (ed.) Advances in Thin Layer Chromatography, pp. 89}123. New York: John Wiley.
Filthuth H (1989a) New detector for radiochromatography and radio-labelled multisample distributions. The digital autoradiograph.Journal of Planar Chromatography2: 198.
Filthuth H (1989b) Detection of radioactivity distribution with position-sensitive detectors, linear analyzer, and digital autoradiograph. In: Touchstone JC (ed.)Planar Chromatography in the Life Sciences, p. 167. New York: John Wiley.
Hamaoka T (1990) Autoradiography of new era replacing traditional X-rayRlm bio-imaging analyzer BAS2000. Cell Technology9: 456.
Johnston RF, Pickett SC and Barker DL (1990) Autoradio-graphy using storage phosphor technology. Electro-phoresis11: 355.
Klein O and Clark T (1993) The advantages of a new bio-imaging analyzer for investigation of the meta-bolism of14C-radiolabelled pesticides.Journal of Planar Chromatography6: 369.
Miyahara J (1989) Visualising things never seen before. The imaging plate: a new radiation image sensor.Chemistry Today223: 29.
Nakajima E (1993) Radioluminography, a new method for quantitative autoradiography in drug metabolism stud-ies.Radioisotopes42: 228.
Prydz S (1973) Summary of the state of the art in radio-chromatography. Analytical Chemistry 45: 2317.
Roberts TR (1978)Radiochromatography,The Chromato-graphy and Electrophoresis of Radiolabelled Com-pounds, pp. 45}83. Amsterdam: Elsevier.
[image:8.568.50.520.71.167.2]