Design and Implement of a Programmable Logic
Controller (PLC) for Classical Control Laboratory
*
Yousif I. Al Mashhadany
Electrical Engineering Department, College of Engineering, University of Anbar, Baghdad, Iraq Email:[email protected]
Received October 31, 2011; revised December 1, 2011; accepted December 9, 2011
ABSTRACT
The design and implementation of a classical control system laboratory based on PLC control system is introduced in this paper. To design and implement the system, two parts must be produced. The first is software for PLC and the sec-ond is hardware for experiments related to the programs. The PLC control system used in the design is LS industrial system company GM7-DR40A 24/16 Digital I/O and single Analog I/O module, two photoelectric sensors from Atonic company’: the first with the model BR100-DDT-P, and the second BEN10M-TFR. An approximate sensor with 5-sides is detected, four of CMOS BCD-7-Segment driven by CD4511B, two relays: 2-poles and 3-poles, six voltages and an ammeter measurement, DC motor and 24 VDC power supply and many connecters and pinions. Satisfactory results are obtained by executing twenty four experiments for classical control theory that fulfill the requirements of control theory in undergraduate stage and replace the old experiments executed by PID controller where the practice system is imple-mented by PLC control now.
Keywords: PLC Control System; Photoelectric Sensor
1. Introduction
PLC’s were developed in the late 1960’s to eliminate the large cost involved in changing complicated relay based machine control systems. These systems were inflexible. Their major rewiring or complete replacement was nec-essary every time when the production requirements changed and control sequences had to be modified. It became very expensive when changes were frequent. The idea to replace relay systems with flexible microproces-sor based Programmable logic controllers PLC’s was a revolutionary step in the industrial control business [1].
PLC’s have been used for many years at many appli-cations. They are the main control elements of several subsystems which require relatively slow data monitor-ing: the radiation control, personal safety, fire and smoke alarm. All these subsystems are very cost effective and reliable. Adding new equipment to control or changing operating conditions to implement new control features can easily be done by the skilled technician staff, without any help from the Controls Software Group.
The software development tool and some ideas of de-vice support for DirectNet PLC’s became the basis of a new PLC control software library at control Lab. The software acts as a DirectNet master through any RS-232 port and consists of three main parts: a PLC driver with a
state machine control block, a device support module, and a common serial driver [2,3].
Basic PLC’s are available on a single printed circuit board as shown in Figure 1. They are sometimes called
single board PLC’s or open frame PLC’s. These are to-tally self-contained (with the exception of a power sup-ply) and, when installed in a system, they are simply mounted inside a controls cabinet on threaded standoffs.
Screw terminals on the printed circuit board allow for the connection of the input, output, and power supply wires. These units are generally not expandable, meaning that extra inputs, outputs, and memory cannot be added
[image:1.595.311.525.570.714.2]to the basic unit. However, some of the more sophisti-cated models can be linked by cable to expansion boards that can provide extra I/O. Therefore, with few excep-tions, when using this type of PLC, the system designer must take care to specify a unit that has enough inputs, outputs, and programming capability to handle both the present need of the system and any future modifications that may be required. Single board PLC’s are very inex-pensive, easy to program, small, and consume little po- wer, but, generally speaking, they do not have a large number of inputs and outputs, and have a somewhat lim-ited instruction set. They are best sulim-ited to small, rela-tively simple control applications [4].
2. Hardware Design for the Model
Inputs to, and outputs from, a PLC are necessary to mo- nitor and control a process. Both inputs and outputs can be categorized into two basic types: logical or continuous. Consider the example of a light bulb. If it can only be turned on or off, it is logical control. If the light can be dimmed to different levels, it is continuous. Continuous values seem more intuitive, but logical values are pre-ferred because they allow more certainty, and simplify control. As a result most controls applications (and PLC’s) use logical inputs and outputs for most applica-tions [5].
Outputs to actuators allow a PLC to cause something to happen in a process. A short list of popular actuators is given below in order of relative popularity.
Solenoid Valves—logical outputs that can switch a hydraulic or pneumatic flow.
Motor Starters—motors often draw a large amount of current when started, so they require motor starters, which are basically large relays.
Servo Motors—a continuous output from the PLC can command a variable speed or position.
Outputs from PLC’s are often relays, but they can also be solid state electronics such as transistors for DC out-puts or Triacs for AC outout-puts. Continuous outout-puts re-quire special output cards with digital to analog convert-ers, or can be used another module for PLC analogue o/p.
Inputs come from sensors that translate physical phe-nomena into electrical signals. Typical examples of sen-sors are listed below in relative order of popularity. Proximity Switches—use inductance, capacitance or
light to detect an object logically.
Switches—mechanical mechanisms will open or close electrical contacts for a logical signal.
Potentiometer—measures angular positions continu-ously, using resistance.
LVDT (linear variable differential transformer)—mea- sures linear displacement continuously using mag-netic coupling.
Photoelectric sensor use the ultrasonic signal to detect
any interruption within limited range.
Inputs for a PLC come in a few basic varieties; the simplest are AC and DC inputs. Sourcing and sinking inputs are also popular. This output method dictates that a device does not supply any power. Instead, the device only switches current on or off, like a simple switch [6].
PLC inputs must convert a variety of logic levels to the 5VDC logic levels used on the data bus. This can be done with circuits similar to those shown in Figure 2.
Basically the circuits condition the input to drive an op-tocoupler. This electrically isolates the external electrical circuitry from the internal circuitry. Other circuit com-ponents are used to guard against excess or reversed vol-tage polarity.
PLC outputs must convert the 5VDC logic levels on the PLC data bus to external voltage levels. This can be done with circuits similar to those shown in Figure 3.
Basically, the circuits use an optocoupler to switch ex-ternal circuitry. This electrically isolates the exex-ternal electrical circuitry from the internal circuitry. Other cir-cuits components are used to guard against excess or reversed voltage polarity [7].
COM DC input TTL TTL hot AC input neut.
+5V +5V
optocoupler
[image:2.595.310.537.363.721.2]optocoupler +5V
Figure 2. PLC input circuits [6].
TTL
Sourcing DC output
AC input +V +5V optocoupler optocoupler TTL
The overall design of the model is shown in Figure 4.
and the schematic of this design shown in Figure 5. The
full description of connection for this design is very complex and it has many details, therefore I will describe the connection of the main parts only.
Figure 4. Classical control system laboratory based on PLC.
Figure 5. Schematic of the lab.
3. Hardware Design of PLC Trainer Model
The hardware design of this trainer consists of three main parts:
Main unit of PLC model and its power supply
The PLC model used in this design contains two parts. The first presents the main digital PLC that contains: RS232 connecter to apply the software program to PLC, 24 digital inputs drawing on cover by I00 → I23, 16 dig-ital outputs drawing by O00 → O15with six common ports and 25-pins adapter to execute the additional mod-ules of PLC. Figure 6 shows the main unit of PLC with
power supply.
The second part of this unit is a single analog PLC that contains two channels of analog inputs which are draw-ing by symbols (CH0(input) (I0,V0,COM0) and CH1 (input) (I1,V1, COM1)), one analog output channel (CH0(output)(V+,V–,I+,I–) and 25-pins adapter to add another module (see Figure 6).
Power supply for this unit is 24 VDC/5 A contain two supply ports (see Figure 6). The connection of I/O PLC
with board achieved by sets of pinions and LED’s for indication (On/Off). Figure 7 presents the connection
between PLC unit and in the experiments board.
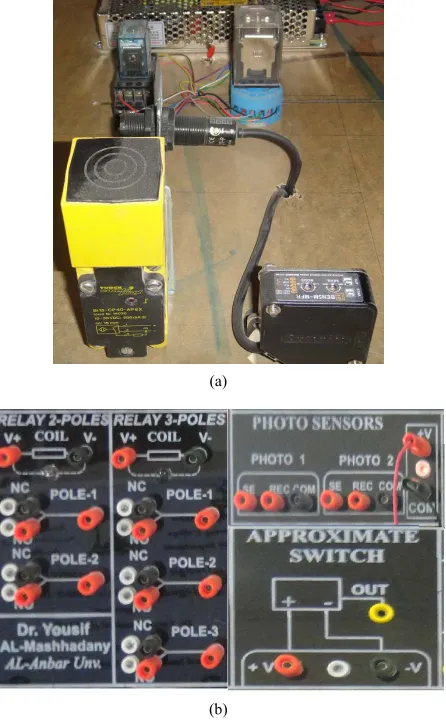
Sensor, Relay and other components
The trainer contains two types of sensors; an approxi-mate sensor that has 5-sides detection with model TURCK Bi15-cp40 APcx sn:15 mm and photoelectric sensors with two models BR100-DDT-P and BEN10M-TFR. The first detects any interrupt within a range of 8 meters and the second detects the reflection from a certain crystal surface within a range of 8 meters.
Two types of relays are used in the board: two-poles and three-poles 24VDC. Figure 8 presents the two relays,
the sensors and the connection in the board.
Many other components that are used in the broad to connect the experiments such as four 7-segments, three digital ammeters and three digital voltmeter, three vari-able resistance 20 Kohm to execute the analog to digital convertor (A/D) and opposite (D/A) and power supply with two 12VDC ports, two 5VDC ports and four 24 VDC ports. Figure 9 presents the power supply ports in
the board. Figure 10 presents the ammeters and
con-verter A/D.
Analog module PLC 25-pin adapter Main digital
PLC Input ports RS 232 adapter 24VDC/5A
Power supply output
ports
Figure 7. PLC connection with experiments board.
(a)
(b)
[image:4.595.311.536.83.480.2]Figure 8. Relay and sensors and its connection in the board.
Figure 9. Power supply connection in the board.
Input vol
ta
ge
In
put
cu
rr
ent
Va
ri
ab
le
2
0k
Ω
A
nal
og P
L
C
o/
p
Figure 10. Ammeters and varying for A/D.
DC motor with model GMN-3MX027A DC24V and driver for AC and DC motor start/stop, direction and emergency control of DC motor and speed control AC motor are implemented in the board. Figure 11 presents
the connection of the motor and drivers in the board.
Experiments board
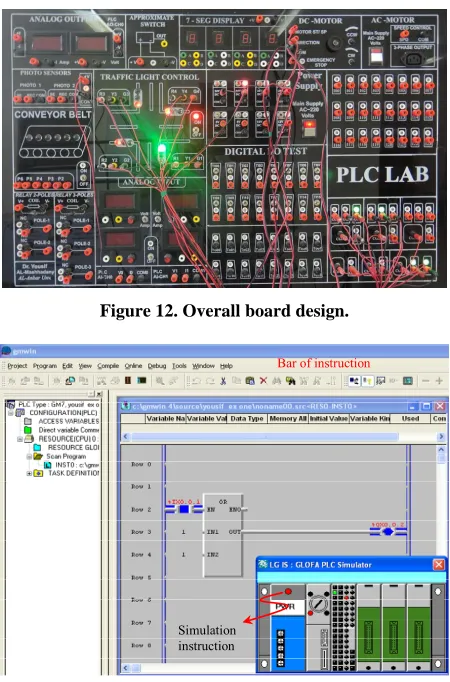
The board is designed to implement many experiments, some of the experiments the connection diagram is plot-ted on the board such as traffic light control, I/O PLC test DC motor and 7-segemnts. Figure 12 presents the
over-all board design.
4. Software Design of PLC Trainer Model
[image:4.595.63.286.356.716.2]experiments. Figure 13 presents the main window for
building the program and simulating the instruction be-fore writing on the memory of PLC through the RS232 connecter.
Every instruction in the program must be compiled before writing the process code to the memory of PLC. After compilation we can simulate the program to check and explain the working of real PLC with this program and the input to simulation process can be done manually, all these processes are shown in Figure 13.
5. Experiments of PLC Trainer
This trainer is designed to implement the experiments of classical control laboratory to replace the PID controller
[image:5.595.62.285.269.350.2]To AC motor motor
[image:5.595.60.285.377.718.2]Figure 11. DC and AC motor drivers’ connection.
Figure 12. Overall board design.
Bar of instruction
Simulation instruction
Figure 13. Main LD program and its simulation.
by PLC controller where the last has a wide range in in-dustrial application. The experiments that are imple-mented in this lab can be divided into three main groups according to application field in classical control ap-proach: Logic process, power system and interactive process control, where by using this trainer six experi-ments can be done in logic process, ten experiexperi-ments in power system and eight experiments in the interactive process control. Every experiment has a procedure for connection on the board and program for writing with PLC memory and then run the connection. For example, the implementation of traffic light control can be dis-cussed by the procedure as follows:
1) Switch OFF main supply 220VAC & switch OFF 24VDC.
2) Connect (24VDC) from Power supply to (COM) of (O00 ··· O11).
3) Connect (O00 ··· O11) to traffic light diagram on the board according to the diagram that is shown in Table 1.
4) Switch ON main supply 220VAC.
[image:5.595.309.537.391.516.2]5) Download the ladder program of traffic light control to PLC. The program is similar to the program that is shown in previous page (Figure 13).
Table 1. Connection diagram of traffic light (experiment).
No.
From Port o/p PLC
To Port on board No.
From Port o/p PLC
To Port on board
1 O00 R1 7 O06 R3
2 O01 Y1 8 O07 Y3
3 O02 G1 9 O08 G3
4 O03 R2 10 O09 R4
5 O04 Y2 11 O10 Y4
6 O05 G2 12 O11 G4
Table 2. Sequence of light ON in traffic display.
No. Time Traffic 1 Traffic 2 Traffic 3 Traffic 4
0 to 10 sec Green 1 Red 2 Red 3 Red 4 State 1
11 to 15 sec Yellow 1 Red 2 Red 3 Red 4
16 to 25 sec Red 1 Green 2 Red 3 Red 4 State 2
31 to 40 sec Red 1 Yellow 2 Red 3 Red 4
41 to 45 sec Red 1 Red 2 Green 3 Red 4 State 3
46 to 50 sec Red 1 Red 2 Yellow 3 Red 4
51 to 60 sec Red 1 Red 2 Red 3 Green 4 State 4
61 to 65 sec Red 1 Red 2 Red 3 Yellow 4
66 to 75 sec Green 1 Red 2 Red 3 Red 4 Return to
State 1
6) Switch ON 24VDC, the traffic light LEDs must be activates according the sequence at is shown in Table 2.
Note: the value of time in this experiment is taken fast to
explain all process in short time.
The practice connection for this experiment is shown in the previous page (Figure 12).
6. Conclusions
The practice results that are obtained in real implementa-tion of all experiments in the laboratory and the simula-tion results by LD program, it can be seen that the im-plementation of PLC controller with classical control systems is necessary. This implementation has high per-formance, high accuracy and more speed response com-pared to the classical controller.
The trainer presents practice simulation for many real systems; therefore it is very suitable for classical labora-tory unit with undergraduate students.
7. Acknowledgements
Special thanks are due to AL Anbar University/Engi- neering College for support me with the implementation of the PLC trainer laboratory.
REFERENCES
[1] P. Chevtsov, S. Higgins, S. Schaffner and D. Seidman, “PLC Support Software at Jefferson Lab,” Jefferson Lab, Newport News, 2002.
[2] J. R. Hackworth and F. D. Hackworth, “Programmable Logic Controllers: Programming Methods and Applica-tions,” Prentice Hall, Upper Saddle River, p. 13. [3] L. A. Bryan and E. A. Bryan, “Programmable Controllers
Theory and Implementation,” 2nd Edition, Industrial Text Company Publication, Atlanta, 1997.
[4] H. Jack, “Automating Manufacturing Systems with PLCs, Version 4.7,” Copyright (c) 1993-2005 Hugh Jack, 2005. [5] S. Yurkovich and K. M. Passino, “A Laboratory Course
on Fuzzy Control,” IEEE Transactions on Education, Vol. 42, No. 1, 1999, pp. 15-21.
[6] A. Sirinterlikci, “Development of a Comprehensive In-dustrial Controls Course in a Manufacturing Engineering Program,” American Society for Engineering Education, Washington DC, 2006.
![Figure 1. Open frame PLC [4].](https://thumb-us.123doks.com/thumbv2/123dok_us/9260242.415531/1.595.311.525.570.714/figure-open-frame-plc.webp)
![Figure 2. PLC input circuits [6].](https://thumb-us.123doks.com/thumbv2/123dok_us/9260242.415531/2.595.310.537.363.721/figure-plc-input-circuits.webp)