Munich Personal RePEc Archive
A Tale of Two Cities? The
Heterogeneous Impact of Medicaid
Managed Care
Marton, James and Yelowitz, Aaron and Talbert, Jeffrey
Georgia State University, University of Kentucky, University of
Kentucky
2014
Online at
https://mpra.ub.uni-muenchen.de/54105/
A TALE OF TWO CITIES?
THE HETEROGENEOUS IMPACT OF MEDICAID MANAGED CARE
James Marton1* Georgia State University
Aaron Yelowitz University of Kentucky
Jeffery C. Talbert University of Kentucky
February 25, 2014
Evaluating Accountable Care Organizations is difficult because there is a great deal of heterogeneity in terms of their reimbursement incentives and other programmatic features. We examine how variation in reimbursement incentives and administration among two Medicaid managed care plans impacts
utilization and spending. We use a quasi-experimental approach exploiting the timing and
county-specific implementation of Medicaid managed care mandates in two contiguous regions of Kentucky. We find large differences in the relative success of each plan in reducing utilization and spending that are likely driven by important differences in plan design. The plan that capitated primary care physicians and contracted out many administrative responsibilities to an experienced managed care organization
achieved significant reductions in outpatient and professional utilization. The plan that opted for a fee-for-service reimbursement scheme with a group withhold and handled administration internally saw a much more modest reduction in outpatient utilization and an increase in professional utilization.
JEL classification: I18; I38; J13
Keywords: Medicaid; Managed Care; Child Health
*
Marton: Georgia State University, Department of Economics, P.O. Box 3992, Atlanta, GA 30302-3992; 404 - 413 - 0256 (p); 404 - 413 - 0145 (f); [email protected]. Yelowitz: University of Kentucky, Department of Economics, 335 Business and Economics Building, Lexington, KY 40506-0034; 859-257-7634 (p); 859-323-1920 (f);
[email protected]. Talbert: University of Kentucky, College of Pharmacy, 237 BPC, 789 S. Limestone St., Lexington, KY 40536-0596; 859-323-7141 (p); 859-323-0069 (f); [email protected].
We would like to thank Tania Barham, Glenn Blomquist, J.S. Butler, Julia Costich, Janet Currie, Al Headen, Lorens Helmchen, Inas Rashad Kelly, Carlos Lamarche, Adriana Lleras-Muney,Jim Ziliak, participants at the 2008 ASHE conference, the 2008 AHEC conference, the 2010 SHESG conference, the 2010 EEA meetings, seminar participants at the University of Kentucky, Emory University, Western Kentucky University, and Georgia State University, the staff at the Kentucky Cabinet for Health and Family Services, and two anonymous referees for their valuable comments. We would also like to thank Gao Liu, Erin Coffman, T.J. Christian, Jamie Turner, and Subha Basu for their work as research assistants. Any errors are, of course, our own. This project was supported with a grant from the UK Center for Poverty Research through the U.S. Department of Health and Human Services, Office of the Assistant Secretary for Planning and Evaluation, grant number 5 ASPE417-03 as well as a Georgia State University Faculty Research Initiation Grant. The opinions and conclusions expressed herein are solely those of the authors and should not be construed as representing the opinions or policy of the UKCPR or any agency of the Federal
2
I. Introduction
Although the implementation of the key features of the Affordable Care Act (ACA) is
well underway, policymakers continue to struggle with the best health care finance and delivery
system to achieve the “Triple Aim” of improved quality of care, improved population health, and
reduced cost (Berwick, Nolan, and Whittington (2008)). This is especially true among state
Medicaid programs, as many states have recently expanded their Medicaid programs in January
2014, despite concerns about the impact of the expansion on state budgets.1
One relatively new approach to this problem is to create what are known as Accountable
Care Organizations (ACOs), which can be generally defined as coordinated networks of medical
providers that assume the risk for the quality and total cost of care for their patients (Burns and
Pauly (2013)). As discussed in Fisher et al. (2012), much like more traditional managed care
organizations (MCOs), health maintenance organizations (HMOs), or integrated delivery
networks, ACOs may differ both in terms of specific contract characteristics and the populations
they serve, with current ACOs providing care through contracts for Medicaid, Medicare, private
payers, and different combinations of these groups.
One challenge associated with evaluating the success of ACOs, MCOs, or integrated
delivery networks, is the fact that there may be a great deal of heterogeneity across these
networks / organizations / plans in terms of their reimbursement incentives and other key
programmatic features (Gaynor, Rebitzer, and Taylor (2004)). For example, some plans may
reimburse primary care providers via capitation while others may reimburse via fee-for-service
(FFS). Research attempting to make blanket statements about the impact of ACOs or MCOs in
improving quality and reducing costs seem to sweep this heterogeneity under the rug. This
1
3
challenge, along with the concern about the non-random selection of participants, suggests that
there is little convincing evidence on the impact of such plans on the utilization of health care
services, health care costs, and health outcomes.
The purpose of our paper is to directly examine how reimbursement incentives and other
key programmatic features among Medicaid accountable / managed care plans impact health care
utilization and spending using a quasi-experimental approach that exploits the timing and
county-specific implementation of Medicaid managed care mandates in Kentucky in the late
1990s.2 The Medicaid program in Kentucky was changed from a FFS system to a managed care
plan in two geographically distinct sub-sets of counties. We can compare recipients initially in
each of the two sets of “treatment” counties before and after this reform with recipients initially
in neighboring “control” counties that remained in a FFS system, in order to deal with any
concerns about non-random selection into the plans.
Despite serving Medicaid recipients in the same state, and operating less than 100 miles
apart, the two plans selected very different reimbursement mechanisms for physicians and
diverged along other plan dimensions as well. These differences motivate our heterogeneous
treatment effect approach of modeling the impact of each plan separately. The
Louisville-centered plan (Passport) elected to reimburse physicians using a capitated payment scheme,
while the Lexington-centered plan (Kentucky Health Select or KHS) opted for a modified FFS
reimbursement scheme for physicians featuring a group withhold. Another important difference
is that the Louisville-centered “capitated” plan contracted out administrative responsibilities,
such as utilization review, to an experienced MCO while the Lexington-centered “withhold” plan
decided to handle such responsibilities internally. These fundamental organizational differences
2
4
between the two plans could have an impact upon their ability to improve quality, while at the
same time reducing utilization and spending.
We find that both organizations / plans decreased the probability of any monthly
outpatient utilization among the children in our sample, though the Louisville-centered
“capitated” plan was able to do so to a greater degree (a 61 percent reduction versus a 17 percent
reduction). In addition, both plans appear to have had a minimal impact on the probability of
any monthly inpatient utilization for children, which may be explained by low baseline inpatient
utilization rates. Our most striking finding is that the Louisville-centered “capitated” plan
reduced the monthly probability of any professional (physician) utilization by 44 percent among
children, while in the Lexington-centered “withhold” plan professional (physician) utilization
actually increased by 6 percent. If we instead measure utilization along the intensive margin
(using the number of monthly visits or monthly expenditures), we still find that the
Louisville-centered “capitated” plan led to significant reductions in professional and outpatient utilization
not matched by the Lexington-centered “withhold” plan.
Both plans increased the probability of having any monthly well child visits, though the
Louisville-centered “capitated” plan did so to a greater degree. Therefore, the heterogeneous
treatments generated by differences in plan design between the two regions led to different
outcomes with respect to utilization. Finally, we find suggestive evidence that the reductions in
utilization observed in the Louisville-centered “capitated” plan did not lead to adverse health
outcomes for asthmatic children, as measured by inpatient hospitalizations. These results are
robust to a variety of specification checks.
The rest of the paper is organized as follows: section II provides a description of the
5
reimbursement and Medicaid managed care and describes how our approach contributes to this
literature. Our methodological approach and identification strategy is described in section IV
and our data in section V. Sections VI and VII present our results and specification checks.
Section VIII concludes with a discussion of policy implications.
II. The Introduction of Managed Care in Kentucky Medicaid
Brief History
In October 1995, the Commonwealth of Kentucky received Centers for Medicare and
Medicaid (CMS) approval to initiate a major restructuring of the Kentucky Medicaid program by
dividing the state into eight regional managed care networks. Within each region public and
private providers were expected to collaborate to form managed care partnerships to oversee the
provision of Medicaid services, rather than contracting these services out to commercial
managed care providers. The goals of this restructuring were to improve access and quality of
care, stabilize cost growth, and emphasize primary care and prevention.
In November 1997, Medicaid managed care enrollment began in the two regions that
contain the state’s two major urban areas, region 3 (anchored by Louisville) and region 5
(anchored by Lexington).3 These, along with the other regions, are labeled in Figure 1. The
managed care organization / plan covering region 3 was named the Passport Health Plan
(Passport) and the managed care organization / plan covering region 5 was named the Kentucky Health Select Plan (KHS). Ultimately, the other six regions were not able to successfully create
managed care partnerships. Passport, designed around the University of Louisville network, was
3
6
charged with providing Medicaid managed care coverage to all Medicaid recipients in Jefferson
County (containing Louisville) and 15 surrounding counties. Similarly, the KHS plan was
designed around the University of Kentucky network and was charged with providing Medicaid
managed care to all Medicaid recipients in Fayette County (containing Lexington) and 20
surrounding counties.4
Both organizations also agreed to continue reporting encounter data to the state as they
had under Medicaid FFS reimbursement rules. Because the organizations were made up of local
providers that were already accustomed to reporting claims to the state for billing purposes, this
did not represent a change in reporting practice.5 The region 5 partnership dissolved within two
and a half years of its introduction. Today Medicaid recipients in region 3 are still covered under
the Passport managed care plan, while Medicaid recipients in the rest of the state (including
recipients in region 5) were covered under Fee-For-Service (FFS) Medicaid until late 2011.6
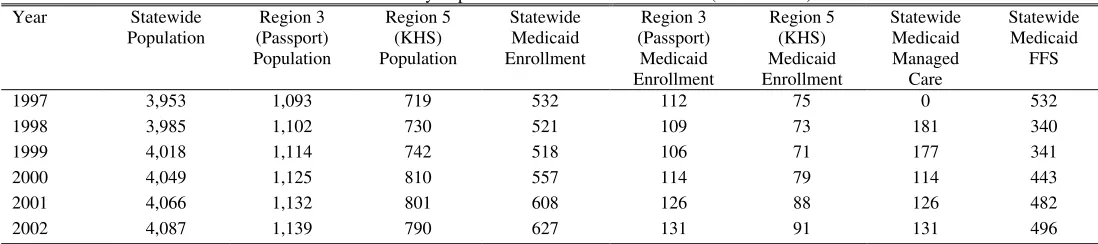
Table 1 provides trends in overall and managed care eligibility over time. The table
suggests that these two regions account for almost half of the state's total population and roughly
35 percent of the state's Medicaid population. Table 1 also suggests that Medicaid is an
important potential source of insurance coverage in Kentucky.
State Capitation Payments to Passport and KHS
Both Passport and KHS were given the responsibility of providing comprehensive health
care coverage for their Medicaid enrollees in exchange for capitation payments (flat monthly
4
There are some Medicaid recipients in these counties that are excluded from managed care. They include those in nursing facilities or psychiatric facilities for an extended stay, those served under home and community-based waivers, and those who must spend down to meet eligibility income criteria.
5
This model of having a single community-organized health system (COHS) manage care in a given region without accepting commercial bids was one of several models used in California to implement Medicaid managed care. 6
The discussion of the history and institutional structure of the Passport and KHS health plans presented here draws in large part from Bartosch and Haber (2004), a report completed by RTI International for the Centers for Medicare & Medicaid Services. To learn more about the most recent reforms to the Kentucky Medicaid program see:
7
fees per recipient based on their category of eligibility) negotiated with the state. The monthly
capitation rates for most of the timeframe we analyze in this paper are presented in Table 2A.
Appendix Table 1 presents a list of the services covered under these capitation payments and
those excluded for both plans. The excluded services were to be covered by the state directly
through FFS reimbursement or capitated through a separate waiver.
Plan Reimbursement for Providers
Passport elected to reimburse primary care providers (PCPs) on a capitated basis, with the
capitation rate adjusted for the age, gender, and eligibility mix of their patients.7 In addition,
PCPs were eligible for performance-based bonuses based on such activities as extending office
hours, maintaining an appointment reminder system, accepting new patients, and meeting goals
for utilization of emergency room visits, inpatient days, and specialty referral costs. In order for
Passport to better measure resource use, an encounter claims bonus of roughly $1 for every
non-FFS claim submitted was also established for PCPs. Hospital reimbursement was set up on a per
diem basis using the Medicaid fee schedule with a 10 percent withhold.8
KHS instead elected to reimburse physicians and hospitals on a FFS basis using the
Medicaid fee schedule with a 20 percent withhold. This means that physicians would receive 80
percent of the fee associated with each service performed and the remaining 20 percent was held
back until the end of the year to be used as a potential reward for meeting budget targets. PCPs
were organized into “pools of doctors” or PODs with each POD assigned a budget by KHS. If
actual health care expenditures attributed to the POD exceeded the budget, then the proportion of
7
When we say that Passport capitates primary care providers, we mean Passport makes capitated payments to primary care practices. These could include different numbers of individual primary care providers whose individual compensation from the practice is not observed.
8
8
the 20 percent withhold returned to the POD at the end of the year would be reduced. If the POD
came in under budget, then the entire withhold would be returned as well as the surplus.
Summary of the Key Differences between the Plans
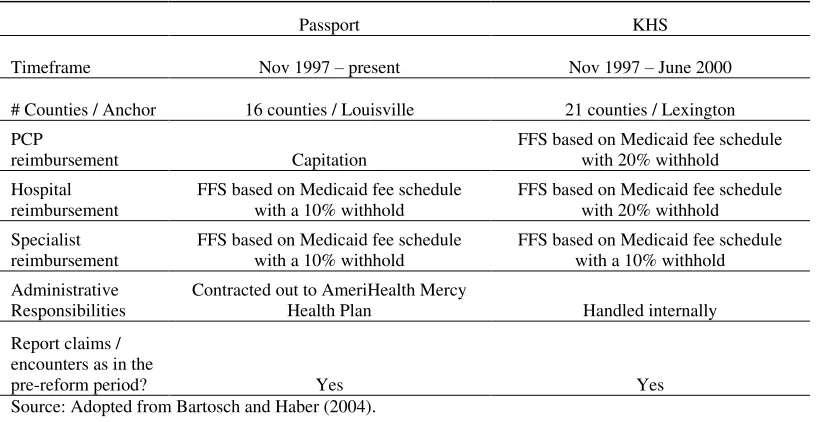
As summarized in Table 2B, a key difference between the two organizations was the way
in which physicians were reimbursed. Passport used capitation, while KHS opted for FFS with a
20 percent withhold. Under the Passport plan, the marginal revenue generated for a PCP from an
additional office visit is essentially zero. On the other hand, PCPs still received additional
revenue from additional visits under the KHS plan. Although the withhold may have encouraged
some utilization reduction, it is important to note that this bonus was not measured at the level of
the individual provider. Therefore, each individual physician may have had an incentive to “free
ride” off of the utilization reductions generated by other members of their POD, while keeping
their own schedule full.
Another key difference between the two organizations was the way in which they
performed basic administrative functions, such as claims processing, member/provider services,
case management, and information sharing. Passport opted to outsource these responsibilities to
an administrative service organization (ASO), AmeriHealth Mercy Health Plan, based in
Philadelphia. KHS decided to handle these responsibilities internally, despite a lack of
experience at managing a managed care network. To the extent that MCOs / ACOs reduce
utilization / spending through increased coordination of care and careful review of physician
practice patterns, experience in these basic administrative functions may be crucial. Passport's
choice to outsource these functions to an experienced ASO may have contributed to its relative
9
These initial choices described above made by the Passport organization (capitating
reimbursement for PCPs and outsourcing important administrative functions to an experienced
ASO) created a plan that was in many ways much closer to a “textbook” HMO / MCO / ACO
than the KHS plan. Thus, we would anticipate Passport to be more successful at reducing
utilization than KHS.
III. Literature Review
Through our description of Kentucky’s Medicaid reform outlined in previous section, we
view our study as contributing to two distinct strands of literature in health economics.9 First,
although many academic studies on different forms of managed care (such as ACOs, MCOs,
HMOs, PCCMs and IPOs) have emphasized the incentives of capitation payments, the
reimbursement to physicians within the organization can vary, even though the organization as a whole is paid on a capitated basis.10 In particular, the KHS combination of FFS physician
reimbursement and a group “withhold” for meeting budget targets has rarely been examined, and
only in the context of a private managed care plan. Second, there is a somewhat larger “case
study” literature that has examined the effects of a given state’s changes in its Medicaid program
on utilization, cost, and health outcomes.
With respect to physician reimbursement within an organization, Cooper and Rebitzer
(2002) note that “most of the empirical literature on physician incentives and managed care
organizations treats physician incentive systems as a black box whose internal operation is
9
Note that there is a lengthy literature that examines the effects of private managed care plans as well as Medicaid managed care. See, for example, Luft (1981), Miller and Luft (1994, 1997), Glied (2000), Cutler and Zeckhauser (2000), and Cutler et al. (2000) for discussions of managed care, and Sparer (2012) for a recent summary on Medicaid managed care studies. For a discussion of Medicare managed care, see Kaiser Family Foundation (2007) Fact Sheet “Medicare Advantage” and for more discussion of Medicaid managed care, see Kaiser Family
Foundation (2012) Policy Brief “Medicaid and Managed Care: Key Data, Trends, and Issues.”
10
10
obscured from view.” (p. 12). One exception is Gaynor, Rebitzer and Taylor (GRT, 2004), who
study how PCPs in managed care networks respond to incentives to contain medical
expenditures.11 The HMO in that study divided physicians into panels of doctors (or PODS).12
Part of the reimbursement for the group was withheld, and then the entire group was given
financial rewards if they collectively contained costs. GRT found that there was significant
free-riding when the size of the POD became too large. For example, PODs with three physicians
were much more effective at coming in under the cap than PODs with six or more physicians.
Our study sheds further light on the ineffectiveness of extremely large PODs, since the
Lexington region had a similar withholding policy for physicians, and the POD size averaged 20
primary care physicians.13
Although there is a large literature on Medicaid managed care (see the recent summary
contained in Duggan and Hayford (2013)), the most convincing studies in this area have either
focused on the “case study” of California, which created a quasi-experiment set up by phasing in
Medicaid managed care in different counties, or at the national level through different
state-by-state implementations.14 The published studies that take advantage of California’s county-level
Medicaid managed care mandates are most similar to our approach. Duggan (2004) examines
the impact of managed care on Medicaid spending and birth outcomes. Aizer, Currie, and
Moretti (2007) also examine the impact of managed care on birth outcomes.15 These studies
emphasize the impact of the capitated payment that the state government offers to the managed
11
See Chalkley and Tilley (2006) and Dusheiko, Gravelle, Jacobs and Smith (2006) for examples from the UK. 12
There is also a theoretical literature that explores the consequences of organizational fragmentation in the health care system, which emphasizes that physicians are central to resource allocation and care processes within a hospital, but are largely independent of hospital management. See Cebul, Rebitzer, Taylor and Votruba (2008). 13
Bartosch and Haber (2004), p. 23. 14
Examples at the national level include Duggan and Hayford (2013), Herring and Adams (2011), Currie and Fahr (2005), and Kaestner, Dubay and Kenney (2005).
15
11
care organization per patient, but do not discuss in detail the reimbursement of physicians.16 To
date, no study has systematically examined how physician reimbursement within managed care
organizations has affected utilization in Medicaid. Unlike California, where there were a
multitude of organizations who may have different reimbursement arrangements with their
physicians, in Kentucky, Passport and KHS each had clear, and uniquely different
reimbursement regimes for physicians.
There are several other differences between the Kentucky reform and the California
reform that we exploit to our advantage. First, unlike in Kentucky, the California Medicaid
managed care data used in the literature has no information on utilization for Medicaid managed
care recipients. Duggan (2004) focuses on Medicaid capitation payments rather than utilization
in his individual level analysis and looks at birth outcomes at the county level using hospital
discharge data rather than Medicaid claims data. Aizer, Currie, and Moretti (2007) focus on
birth outcomes, rather than overall utilization, using the California Birth Statistical Master File
and Birth Cohort files. A second issue with the California Medicaid data is that the mandates for
managed care were not binding for much larger groups of recipients and services than in
Kentucky. For example, in some California counties undocumented workers, SSI recipients, and
foster children were not required to participate in Medicaid managed care. In Kentucky,
Medicaid managed care is mandatory for SSI recipients and foster children if they live in any of
the managed care counties. Both California papers attempt to deal with this issue in their
16Duggan (2004) notes that in California “fee
12
analysis of birth outcomes by focusing on those in their data for whom the managed care
mandate is most likely to be binding.
Song et al. (2012) also provide more recent “case study” evidence from Massachusetts by
examining provider organizations that entered into an alternative contracting arrangement with
Blue Cross Blue Shield in 2009-2010. This contracting arrangement consists of a global budget
with pay-for-performance and places the participating provider organizations at risk for
excessive spending. They found that rates of spending increases slowed in these provider
organizations as compared to control practices, with a bigger difference in the second year after
implementation than the first.
IV. Methods and Identification Strategy
Identifying the Impact of Medicaid Managed Care
It is well recognized by health economists that selection bias represents a key barrier to
assessing the impact of managed / accountable care on utilization. In many settings, especially
in the private market, consumers have the choice between some form of a managed care plan and
a FFS plan. Since the managed care plan represents the cheaper, but less generous option, it will
tend to be more attractive to healthier individuals.17 We refer to this as “enrollee selection.”
Thus the lower costs per managed care enrollee may reflect more stringent financial incentives
on providers and alternative delivery methods, a healthier pool of participants (enrollee
selection), or both. To identify the “pure” managed care effect one needs to keep the health
composition within each type of plan constant, and, in general, OLS estimates will fail to do so
and thus overstate the pure managed care effect.
17
13
In the context of public health insurance, especially Medicaid, the selection issues are
perhaps somewhat different. The Medicaid population is poor and typically faces no
copayments, premiums, or deductibles. In some contexts – such as the California Medicaid
managed care setting that Duggan (2004) and Aizer, Currie and Moretti (2007) studied –
recipients were initially able to voluntarily choose Medicaid managed care or stay in FFS, and
then some California counties later mandated managed care enrollment. At least in the voluntary
setting, it is not clear that the financial incentives to be in a managed care plan are very strong
because Medicaid FFS plans tend to have little patient cost-sharing. Thus, it is not clear whether
the selection bias will be the same as in the private setting.
In the Kentucky context, the switch from FFS to managed care was mandatory for a large
portion of the Medicaid population, occurred at essentially one point in time, and was
implemented in some, but not all Kentucky counties. In other words, a Medicaid recipient could
not simply choose to opt into a managed care program, instead enrollment was based purely on
county of residence. Therefore, enrollees in certain counties were automatically enrolled in
managed care, while those in neighboring counties outside the managed care boundaries were
not. This description of managed care implementation in Kentucky suggests a “difference
-in-differences” approach to identify the impact of managed care on health care utilization that is
free from the “enrollee selection” problem that plagues much of the literature.
One option for implementing this difference-in-differences approach would be to collect
monthly enrollment and utilization data on all Medicaid enrollees in all 120 Kentucky counties
before and after the reform. We could run a regression with an indicator of any monthly
utilization as the dependent variable and an indicator of managed care enrollment, which would
14
managed care counties in the post period, as the independent variable. Thus we would be
comparing the monthly utilization of those living in the 37 managed care counties before and
after the reform with those living in any of the other 83 counties (see Figure 1).
While such an approach would shed light on the impact of managed care, it suffers from
several problems. First, it would treat managed care counties containing Kentucky's largest
cities (Louisville in Jefferson county and Lexington in Fayette county) the same as much more
rural managed care counties. In addition, these cities served as the “hub” for managed care
activities within their respective regions, so they are also different from more rural areas in that
regard. It may be the case that because Jefferson county contains Louisville, it is too different
from other Kentucky counties for any comparison to be feasible. Second, it may not be
reasonable to use counties in the far eastern or western parts of the state as controls for managed
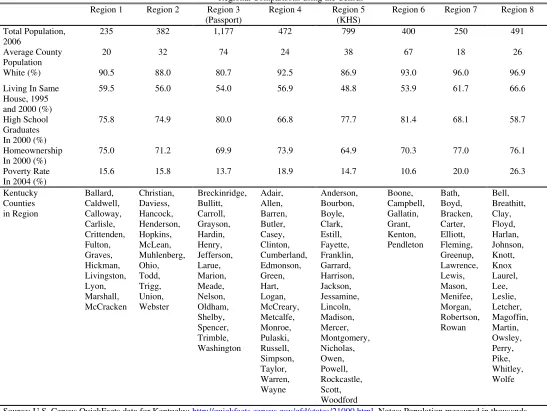
care counties in central Kentucky. Table 3 provides a descriptive comparison of each of the
eight proposed managed care regions using “QuickFacts” data from the U.S. Census and
confirms that there are important differences between the regions.18 Third, there are also
important differences in utilization patterns in adults versus children, so an analysis of all
enrollees would ignore these differences. Finally, it does not address the potential endogeneity
of residence. Enrollees may move across county lines in order to opt in or opt out of managed
care. We refer to this as “migration endogeneity”,an issue recognized in the California Medicaid
context by Aizer, Currie and Moretti (2007).
Given these concerns, an alternative approach would be to focus our attention on
enrollees in the outermost counties in both managed care regions that share a border with a FFS
18
15
county. These outermost managed care counties and their FFS neighbors are likely to make for
much more homogenous treatment and control groups than would be the case if we used all 120
counties. These outermost managed care counties are also more likely to have been “followers”
rather than “leaders” in terms of setting managed care policy for their regions. This “border
county” approach is motivated by, among others, the Black (1999) analysis of the effects of
school test scores on housing prices. By looking at geographic areas that are contiguous and
relatively homogeneous - yet are treated very differently by the implementation of managed care
- we feel more confident that any measured impacts do not represent other omitted county-level
factors.
In order to address migration endogeneity, we use managed care eligibility based on
county of residence in January 1997 as a proxy for actual managed care enrollment. Presumably,
choice of residence in January 1997 is exogenous to the implementation of the Medicaid
managed care that occurred in November 1997. We also follow the literature and focus on our
attention on children, specifically children enrolled continuously from January 1997 to June
1999.19 As a specification check, we replicate our analysis on partially enrolled children. The
results are unchanged from what we present.
19
16
While this alternative approach is promising, there is one final issue to be addressed:
whether or not it makes sense to model the managed care “treatments” in each region as being
homogeneous. Our prior description of the differences in plan characteristics across the two
regions clearly suggests that we should model the impact of managed care in each region
separately. Our use of separate border county FFS control groups for each region should handle
other baseline differences between the two regions, such as differences in baseline utilization.
To summarize our empirical strategy, we define separate treatment and control
shared-border counties for each of the two managed care regions and track the utilization of all children
that i) live in those counties in January 1997 and ii) are continuously enrolled in Medicaid until
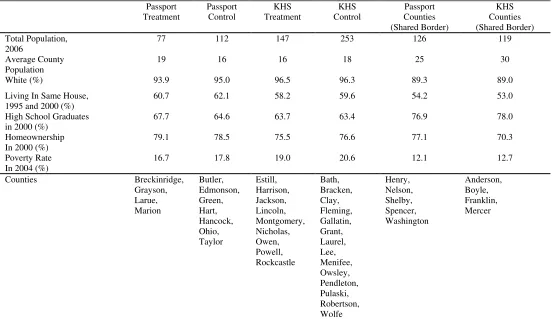
June 1999. Figure 2 illustrates the 4 Passport treatment and 7 control counties as well as the 9
KHS treatment and 14 control counties used in this analysis.20 Table 4 provides a descriptive
comparison of the treatment and control counties using “QuickFacts” data from the U.S. Census.
The first two columns describe the Passport treatment and control counties, followed by the KHS
treatment and control counties. We also present descriptions of Passport and KHS counties that
share a common border. For both Passport and KHS, the treatment and control counties are very
similar in terms of measurable county-level characteristics. Observable differences across the
two regions further motivate separate Passport and KHS analyses. Finally, it is interesting to
are differential take-up rates in managed care and FFS counties. Although we observe long-run insurance status and utilization far more accurately than previous work, by restricting the sample of Kentucky children to those who were continuously enrolled, it is likely that the children are poorer and less mobile than other Medicaid recipients. In order to evaluate this formally, we examined data from the Survey of Income and Program Participation (SIPP) from 1997-1999. We find that children continuously enrolled in Medicaid tend to be more disadvantaged than those with intermittent Medicaid enrollment. Additionally, sources of health insurance coverage for these children when not formally participating in the Medicaid program varied with the length of time spent on Medicaid. This suggests that our results based on continuously enrolled children may not be generalizable to the Medicaid population as a whole. 20
17
observe how similar the Passport and KHS counties are that share a common border. Later we
compare the impact of the different managed care “treatments” in each these two similar sets of
counties.
Empirical Model Specification
The key issue which motivates the instrumental variables approach we adopt in this paper
is that mobility across Kentucky’s 120 counties is non-trivial, and could be correlated with the
implementation of Medicaid managed care. Put differently, location could be endogenous to
health care utilization and Medicaid generosity. In the broader literature on welfare benefits,
Gelbach (2004) convincingly finds that among women likely to use welfare, movers move to
higher-benefit states, and do so earlier in the life cycle. If one believes that state-to-state moves
occur due to differences in cash welfare generosity, then county-to-county moves (which are
clearly less costly for families) due to differences in Medicaid generosity may be an important
issue to account for.
To do so, we argue that county of residence in January 1997 is exogenous to the
implementation of the Medicaid managed care that occurred in November 1997. This follows
the approach of Aizer, Currie, and Moretti (2007) who control for the endogeneity of location by
assigning Medicaid managed care status based on the first county in which a recipient is
observed. Thus, we predict managed care enrollment separately in each region based on the
interaction of two variables: time period (pre- or post-implementation) and whether the initial
county of residence becomes a managed care county. In other words, in each region we are
using managed care eligibility based on county of residence in January 1997 as an instrument for
actual managed care enrollment. This exogenous eligibility measure should not affect health
18
Our first stage models for each region, estimated as linear probability models, are given
below:
HMOijt=β0+ β1 HMO_elig_Passport_initial_countyit+ β2 Age_6-12it
+ β3 Age_13-18it+ Month_Year_Dummies β4+ αi+ εijt (1a)
HMOijt= β0+ β1 HMO_elig_KHS_initial_countyit+ β2 Age_6-12it
+ β3 Age_13-18it+ Month_Year_Dummies β4+ αi+ εijt (1b)
where HMO represents actual managed care enrollment for child i in county j at time t,
HMO_elig_Passport_initial_county represents Passport eligibility for child i based on initial
county of residence and current time period (i.e. it equals 1 if the child initially resided in a
Passport county and the time period is November 1997 onward), HMO_elig_KHS_initial_county
represents KHS eligibility for child i based on initial county of residence and current time period, and Month_Year_Dummies is a vector containing an indicator for each of the 30 months (January
1997 to June 1999) in our sample.21 We also include two indicators for different child age
groupings, child fixed effects (αi), and εijt represents a standard error term. The inclusion of child
fixed effects controls for time-invariant child characteristics that are not observed in our
administrative data.
Our primary second stage specification, which examines three types health care
utilization (professional, outpatient, and inpatient services), is also estimated as a separate linear
probability model for each region:
21
19
Any_Monthly_Utilizationijt= β0+ β1 HMOijt+ β2 Age_6-12it+ β3 Age_13-18it +
Month_Year_Dummies β4+ αi+ εijt (2)
where Any_Monthly_Utilizationijt is a dummy variable equal to 1 if child i in county j used one
of our measures of health care utilization in month t (outpatient, professional, or inpatient), HMO
represents actual HMO enrollment in our OLS specifications and predicted HMO enrollment
from the first stage in our IV specifications, and the other variables are defined as before.22 We
will modify this specification where needed to accommodate different measures of utilization,
such as a measure of the monthly number of visits or monthly medical expenditures.
V. Data
In order to implement our empirical analysis, we were provided with de-identified, linked
Medicaid claims and enrollment data by the Kentucky Cabinet for Health and Family Services.
As described above, for each region our sample consists of children that i) live in the region's
treatment or control counties in January 1997 and ii) are continuously enrolled in Medicaid until
June 1999.23 During these 30 months, there were no changes in the company managing the
Kentucky Medicaid information systems.
Electronic Data Systems (EDS) was responsible for managing Medicaid information
systems for Kentucky from 1994 to 2000 and a new vendor, Unisys, began managing these
databases in January 2000. We begin our analysis in January 1997 because data prior to that date
22
For a discussion of the use of linear probability models in two state least squares estimation see Angrist and Krueger (2001) and Kelejian (1971).
23
20
from EDS were not available.24 During transitions to new vendors with new database models,
the medical claims information goes through a testing and verification period for about one year.
We are not confident in the comparability of the new Unisys database with the previous system
during this intermediate period, which is why we end our analysis in June 1999 (several months
before the transition). The benefits of using this timeframe include the fact that it spans the
reform we are investigating and we are assured the changes in utilization we observe are not
being driven by vendor changes. The cost is that we cannot observe longer-run utilization
changes.
After dropping a few children with age discrepancies, we are left with 4,706 children in
our Passport sample (1,890 initially in one of the 4 Passport treatment counties we are interested
in and 2,816 initially in one of the 7 control counties) and 13,590 children in our KHS sample
(4,273 initially living in one of the 9 KHS treatment counties we are interested in and 9,317
initially living in one of the 14 control counties). Descriptive statistics from our final samples
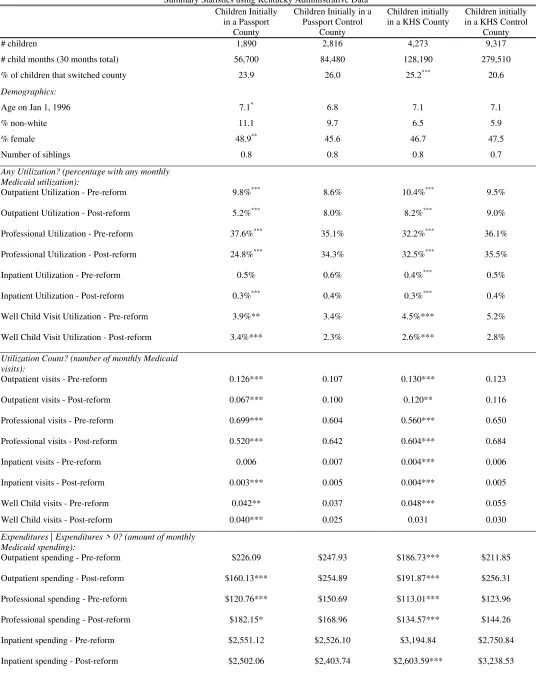
for each region (split into treatment and control sample sub-categories) are shown in Table 5.
Comparing the 1,890 children initially in a Passport county with the 2,816 initially in a bordering
FFS county, we see that there was a slightly lower probability of moving across county lines
among the Passport children (24 percent versus 26 percent). On the other hand, there are more
movers among the children initially in a KHS county than their FFS controls. The amount of
moving that we observe in both regions reinforces the motivation for our IV approach to control
for migration endogeneity.25 Table 5 reinforces the finding from Table 4 that we are comparing
24
A longer time series of pre-reform data would have been preferable, but given that we have micro-level data measured at the monthly level, ten months of pre-reform utilization data allows us to sufficiently investigate the "common trends" assumption that is important in any difference-in-differences analysis.
25
21
extremely homogenous sets of counties within each region. The children in our final Passport
and KHS samples appear extremely similar to their FFS controls in terms of demographics and
pre-reform utilization.
Our health care utilization data – which is recorded regardless of whether the payment
arrangement is FFS or managed care – is at the monthly level. Inpatient services are defined to
be services delivered in a hospital with an overnight stay, while outpatient services are services
delivered in clinics or hospitals in which there is no overnight stay (such as an ER visit).
Professional services typically represent physician services, but could also include services
provided at locations other than physician offices, such as dental clinics and public health clinics.
The bottom of Table 5 presents the monthly utilization rates for each type of service in the
pre-period (January 1997-October 1997) and the post-pre-period (November 1997-June 1999) for
children in each set of counties of interest. These simple summary statistics in many ways tell
the entire story. We see large reductions in outpatient and professional utilization for children
initially living in the Passport counties that is not matched by children initially living in the
non-Passport border counties. Children initially living in the KHS counties, while experiencing some
reduction in outpatient utilization, actually have a slight increase in professional utilization.
They tend to look much more similar to children initially in the non-KHS border counties (i.e.,
children continuing to receive FFS Medicaid).
VI. Results
22
In this section we report our empirical results and in the next section we discuss a series
of specification checks. We then synthesize the results and discuss how they contribute to the
previous literature.
Effects of HMO Enrollment on Health Care Utilization – Descriptive Evidence
The heterogeneous impact of the two different managed care “treatments” is made
especially clear in Figures 3 and 4. Figure 3 compares for each of the three types of services
differences in the monthly utilization rate for the 1,890 children initially living in a Passport
county (labeled “treatment”) to the utilization rate for the 2,816 children initially living in a non
-Passport border county (labeled “control”). We see similar utilization rates in the pre-period for
each type of service in both the treatment and control groups (visual support for the "common
trends" assumption) and then striking reductions in outpatient and professional utilization for the
Passport treatments relative to their controls. There seems to be less of a managed care impact
on inpatient utilization, but the extremely low baseline utilization rate makes the possibility of a
significant reduction less likely, as does the fact that inpatient stays were still reimbursed on a
FFS schedule with a withhold, rather than with a capitated payment.
Figure 4 provides the same comparison for our KHS treatment and control samples.
These graphs clearly tell a different story. We again see similar utilization rates between the
treatment and control counties in the pre-period. The KHS pre-period utilization rates also
appear to be very similar to the Passport pre-period utilization rates, with slightly lower
outpatient and professional rates and a slightly higher inpatient rate. In the post-period, we see
very little difference between the KHS treatment utilization rates and the controls. Therefore,
23
Passport program and almost no impact of the managed care treatment associated with the KHS
program.
Effects of HMO Enrollment on Health Care Utilization – Extensive Margin Regressions
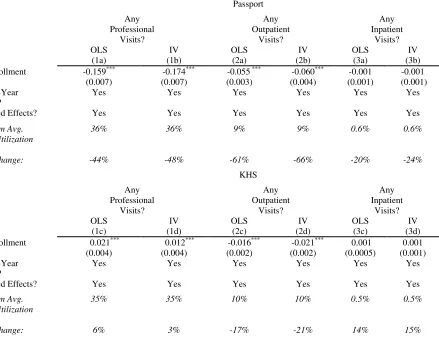
The top panel of Table 6 presents the results of a series of regressions based on equation
(2) for the Passport region where the dependent variable in each model is a (0, 1) indicator of any
monthly utilization of professional, outpatient, or inpatient Medicaid services. The key
independent variable of interest is managed care enrollment (HMO). In order to isolate the effect of the Passport managed care program on utilization, each model includes a series of month year
dummies and child fixed effects. The OLS estimate presented in column 1a suggests that the
introduction of the Passport program led to a statistically significant 16 percentage point decline
in the probability of any Medicaid professional utilization for the children in our sample. This is
relative to a monthly professional utilization rate of 36% in the pre-reform period, thus
representing a 44% reduction in the overall monthly probability of any Medicaid professional
utilization. The other OLS estimates suggest a statistically significant 5.5 percentage point
decline (61% reduction) in the monthly probability of any outpatient utilization and a more
modest 0.1 percentage point decline (20% reduction) decline in the monthly probability of any
inpatient utilization.
Table 6 also presents results of a similar specification estimated using our Kentucky
Health Select (KHS) sample. The OLS estimate presented in column 1c suggests that the
introduction of the KHS program actually led to a statistically significant 2 percentage point
increase (6% increase relative to baseline) in the probability of any Medicaid professional
utilization. The other OLS estimates suggest a statistically significant 2 percentage point decline
24
and a 0.1 percentage point increase (14% increase) in the monthly probability of any inpatient
utilization.26
Identification in the OLS models is achieved through the assumption that this Medicaid
reform in Kentucky is an exogenous change to insurance type, not driven in a given county by
some sort of related changes in Medicaid spending / utilization (policy endogeneity) or because
of changes in the characteristics of recipients (migration endogeneity).27 In our IV models we
address migration endogeneity by instrumenting actual managed care enrollment with Passport
or KHS eligibility based on initial county of residence.28 Because we first observe each child in
our sample in January 1997, our identifying assumption is that their county of residence in
January 1997 is exogenous to the implementation of managed care in November 1997.29 The
results reported in Table 6 illustrate that using an IV approach leaves the coefficient estimates
largely unchanged. This suggests migration endogeneity is not a major source of bias to our
26
Although outpatient and inpatient services were not capitated under the Passport plan, one would expect that both the capitation of primary care providers and their role as gatekeepers, as well as other aspects of managed care, such as utilization review, would have an effect on these services. As discussed in Baicker, Chernew, and Robbins (2013), the literature on managed care spillover suggests that such effects are important to consider.
27
As is argued in Duggan (2004) in the case of California, one could argue in Kentucky that since the planning for the introduction of managed care preceded the actual implementation by multiple years, policy endogeneity is unlikely to be a major issue. Moreover, the cost dynamics in these border counties are likely to have been far less important in policy decisions than the urban centers of the managed care regions.
28
Aizer, Currie, and Moretti (2007) take a similar approach to control for the endogeneity of location by assigning managed care status to each woman in their sample based on the first county in which she is observed.
29
Appendix Table 2 presents the results of the first stage regressions in which Passport or KHS eligibility based on initial county of residence is used to predict actual managed care enrollment (HMO). The instrument is clearly a very strong predictor of actual managed care enrollment with a marginal managed care participation rate of 69 percent for Passport and 79 percent for KHS. The estimated marginal take-up rate is not 100 percent in either case because of difficulty in measuring managed care enrollment in the first 4 months of the reform and some children moving across county lines, potentially into the adjacent managed care area.
25
OLS estimates of the impact of Passport and KHS on health care utilization. Although we do
observe children moving, those moves do not appear to be motivated by differences in Medicaid
provision across counties.
Our primary results suggest that both Passport and KHS decreased outpatient utilization
among the children in our sample along the extensive margin, though Passport was able to do so
to a greater degree (61% reduction versus 17% reduction). In addition, both programs appear to
have had a minimal impact on inpatient care utilization for children along the extensive margin,
which is probably not surprising given the low overall utilization of inpatient services for
children. A key difference between the effects of the two programs is that Passport reduced
professional utilization by 44% along the extensive margin, while KHS actually increased
professional utilization by 6%. We now consider changes along the intensive margin and
changes in health care spending. Given that migration endogeneity and policy endogenity do not
appear to bias our results, we do not instrument for HMO status in our subsequent analysis.30
Effects of HMO Enrollment on Health Care Utilization – Intensive Margin Regressions
In order to analyze changes along the intensive margin, we modify equation (2) by
replacing the dependent variable with a count for the number of monthly professional, outpatient,
or inpatient visits. Since each of these dependent variables includes a large number of zeros, we
estimate these regressions as Poisson models. The results of the Poisson models for both
Passport and KHS are given in Table 7, where the marginal effects associated with HMO
enrollment are presented for each outcome of interest.
Similar to the impact along the extensive margin, the introduction of the Passport
program led to reductions in the number of monthly professional, outpatient, and inpatient visits
30
26
along the intensive margin, with all three reductions being statistically significant in this case.
We see no statistically significant change in the number of outpatient or inpatient visits
associated with the KHS plan, but a statistically significant increase in the number of monthly
professional visits. Thus, the KHS plan was associated with increases in professional visits
along both the intensive and extensive margin, while the Passport plan was associated with
reductions in professional visits along both margins.
Effect of HMO Enrollment on Health Care Spending
Next we turn our attention to the effects of HMO enrollment on monthly health care
spending. The results reported in Table 6 can be viewed as changes in health care spending
along the extensive margin. In other words, those results tell us whether or not managed care
had an impact on the likelihood that an enrollee had any monthly health care expenditure. The
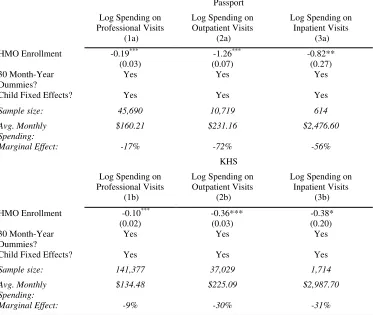
estimates presented in Table 8 focus on the intensive margin; those months in which a patient
had positive expenditures. These results come from a modified version of equation (2) where the
dependent variable is the log of monthly spending on professional, outpatient, or inpatient care,
conditional on having non-zero monthly spending. We estimate each equation using OLS.
Table 8 suggests that both programs led to statistically significant reductions in monthly health
care spending, conditional on non-zero monthly spending. The magnitude of the effect is larger
for Passport than KHS.
We also take an alternate approach to model monthly health care spending that allows us
to determine where on the distribution of medical spending any observed reductions in utilization
are coming from. For example, is the 61% reduction in the monthly probability of consuming
any outpatient services observed in the Passport region achieved by reducing utilization among
27
for outpatient and professional services in both the Passport and KHS regions. We create new
dependent variables equal to 1 in months where the child’s professional or outpatient Medicaid
spending exceed the 50th percentile of the respective monthly spending distribution (conditional
on having positive spending). In the first column, the dependent variable equals 1 in a given
month if a child has professional service spending / claims above $50 (approximately the 50th
percentile of professional spending), and in second column the dependent variable equals 1 if in
a given month a child has outpatient spending /claims above $100 (approximately the 50th
percentile of outpatient spending).
Table 9 reports that Passport led to a 92% reduction in the probability of having monthly
outpatient spending above $100. This suggests a far stronger impact of Passport on outpatient
utilization for those with relatively high outpatient spending / claims. For professional services
we see that Passport focuses on the left tail of the distribution. Passport leads to a 32% reduction
in the probability of having any monthly professional spending above $50, as compared to a 44%
reduction in the probability of having any monthly professional spending (Table 6). For KHS,
more of the action for both outpatient and professional spending is coming from high spenders,
though the interpretation differs because the signs differ. The reduction in the overall probability
of any monthly outpatient spending for KHS is driven more strongly by reductions among the
high spenders, while the increase in the overall probability of any monthly professional spending
is being driven more strongly by increases among the high spenders.
28
While our previous results examine broad categories of utilization, one specific type of
service is of particular interest, well child office visits.31 If managed or accountable care
organizations want to reduce utilization through improvements in preventive care, then we would
expect them to promote such office visits. There may be some concern, however, that the
incentives created by the Passport capitation of primary care providers may reduce such visits.
Table 10 examines the impact of the introduction of Passport and KHS on monthly well
child utilization along both the extensive and intensive margins. Both plans increased both the
probability of having a monthly well child visit (extensive margin) as well as the number of well
child visits received (intensive margin). The magnitudes of the increases are larger for Passport
than for KHS. In particular, the introduction of Passport led to a 31% increase in the probability
of having a well child visit in a particular month, while the introduction of the KHS plan led to a
9% increase.
Effect of HMO Enrollment on Health Outcomes
Our Passport results provide compelling evidence that utilization can be reduced through
the high-powered incentives provided in typical managed care arrangements. One common
criticism, however, is that this reduction in utilization comes at a real cost: patients do not
receive some of the appropriate or necessary care they were getting under FFS. Above we
examined a particular type of service associated with such concerns (well child visits). Now we
examine a particular type of enrollee, children with asthma. If the utilization reductions in
Passport we observe imply poorer primary care for this vulnerable population, we would expect
31
29
a higher hospitalization rate after Passport is implemented among this group (Aizer and Currie
(2002) & Aizer (2007)).
Table 11A provides regression results on utilization for various groupings of Kentucky
counties. The first set of columns breaks out the 4,706 children from the 4 treatment and 7
control counties for Passport into 323 asthmatic children and 4,383 others.32 As in the full
sample, we see no statistically significant change in inpatient utilization for asthmatics along the
extensive margin. Asthmatics also have similar changes in outpatient and professional
utilization. For comparative purposes, the second column reports the regression results for the
non-asthmatic children.
Because the asthmatic sample size is relatively small, we expanded the sample in two
ways. First, we expand the sample to include all 30 month enrolled children in all 16 Passport
counties as the treatment group and all 30 month enrolled children in all 19 Region 4 counties to
the south (see Figure 1) as the control group. As the second set of columns show, this increases
the number of asthmatics to 2,027, but the basic conclusions do not change. Second, we also
expand the sample by including all 30 month enrolled children in Regions 4 (19 counties) and 2
(12 counties) as the control group. The third set of columns show that this increases the number
of asthmatics to 2,447. Again the results do not change. Because we find that hospitalizations
did not go up for asthmatic children, we take this as suggestive, but certainly not conclusive,
evidence that there were not detrimental health impacts associated with Passport utilization
reductions. Table 11B reports the results of similar analysis for the KHS plan. Splitting our
initial KHS sample into asthmatics and non-asthmatics also shows no statistically significant
32
30
change in inpatient admissions for asthmatic children. A full analysis of the health impacts of
managed care is beyond the scope of this paper, but will be the subject of future research.
VII. Specification Checks
In this section we consider a variety of specification checks to test the robustness of our
primary results. We expand our sample by allowing for children that were partially enrolled and
by allowing for children that live in non-border counties. We then restrict our sample to a one
year post-reform timeframe. Next we formally test the common trends assumption associated
with difference-in-differences analysis. We then examine utilization changes for children that
live on the Passport – KHS border and conclude by considering changes in provider participation
in Medicaid.
Allow for Partial Enrollment
Table 12 replicates our primary specifications estimated in Table 6 with an expanded
sample that allows for children that were not enrolled in Medicaid for all 30 months in our data.
This increases the number of children in the Passport analysis from 4,706 children to 8,693
children and the KHS sample from 13,590 children to 23,825 children. Focusing on the OLS
results, we see that expanding the sample in this way does not change our primary results.
Passport still led to large reductions in professional and outpatient utilization, while KHS led to a
more modest reduction in outpatient utilization and an increase in professional utilization.
Neither plan had a statistically significant impact on inpatient utilization. This implies that our
primary results are not being driven by selection into continuous Medicaid coverage over our
timeframe.
31
Next we consider how our conclusions would change if we used a larger, but more
geographically diverse sample. Recall that our “Passport experiment” used only four of sixteen
counties in Region 3 for the treatment group, as well as seven contiguous counties outside of
Region 3 for the control group. The “KHS experiment” used nine of twenty-one counties in
Region 5 for the treatment group, and fourteen counties outside of Region 5 for the control
group. In addition, given the differences in plan design, the managed care “treatment” was
fundamentally different in the two regions.
Table 13 shows the results of expanding the sample using the same OLS models that
were used in Table 6 (the coefficients from that table are presented in the first two rows of Table
13 as reference). We begin by combining the treatment regions, estimating the effect of
managed care without regard to the underlying differences between the two regions. As might
be expected, the treatment effect of managed care is essentially a weighted average of the
treatment effects in the two managed care regions. Overall, professional utilization falls by 4
percentage points, far smaller than the 16 percentage point drop in the Passport region, but a
substantially larger drop than the 2 percentage point increase observed in the KHS region. The
conclusions for outpatient utilization mirror those for professional utilization, while the effect on
inpatient utilization is in all cases insignificant.
We conclude that ignoring the underlying incentives created by different forms of
managed / accountable care can lead to very different conclusions about the magnitude of its
effect on utilization. This implies that studies that ignore such heterogeneity across MCOs or
ACOs, which is often the case in the literature, may end up with biased estimates of the impact
32
Next, we expand our sample to include continuously-enrolled children in all Region 3
and Region 5 counties as the treatment group, and all continuously-enrolled children in the other
six regions as the control group. It should be clear from our previous comparison of the eight
regions (Table 3) that doing so makes the treatment and control groups far more heterogeneous.
Relative to the approach of focusing on geographically contiguous regions, our estimated
impacts of managed care are roughly 15 to 20 percent smaller. We interpret this difference as
suggesting that un-modeled, omitted factors are correlated with both the implementation of
managed care and utilization in the larger sample; for example, it is possible that utilization
trends in urban areas trended differently over time than utilization in rural areas, and the urban
areas also adopted managed care.
Restrict Sample to One Year Post-Reform Timeframe
Figure 3 suggests a dip in outpatient utilization one year after the implementation of the
Passport program (November 1998) that is larger than the utilization reduction that occurs
immediately after Passport began operating. We investigate the sensitivity of our results to this
dip by restricting the post-reform timeframe in the models reported in Table 6 to 12 months.
Thus for these models the pre-reform timeframe is January 1997 through October 1997 (10
months) and the post-reform timeframe is November 1997 through October 1998 (12 months).
Table 14 shows that restricting the post-reform timeframe to 12 months reduces the
magnitude of the Passport reduction in professional utilization from 44% to 38% and the
reduction in outpatient utilization from 61% to 29%. In both cases the results for professional
and outpatient services are highly statistically significant, while the estimated impact on inpatient
utilization is not. Restricting the post-reform timeframe in this way makes almost no change to
33
primary result: Passport led to large reductions in professional and outpatient services that were
not matched by the KHS plan.
Test for Common Trends in the Pre-Period
In order to formally test whether or not there were differential utilization trends between
the treatment and control counties in each region prior to the reform, we re-estimated the models
reported in Table 6 with a treatment indicator interacted with dummies for each of the first eight
months of the pre-reform time period. As shown in Table 15, in our Passport models for
professional, outpatient, and inpatient utilization we cannot reject the null hypothesis that these
pre-reform interaction terms are jointly equal to zero. In our KHS models we cannot reject this
same null hypothesis in our outpatient and inpatient utilization models. There does seem to be
some evidence of differential trends in professional utilization. Overall these results formalize
what we can observe in Figures 3 and 4, that there do not appear to be major differential
utilization trends in the pre-reform time period for either region.
Comparing Treated Border Counties
As Figure 1 illustrates, the Passport and KHS regions also share a border, meaning that as
an additional specification check we can compare utilization pre- and post-reform for 5 Passport
(Washington, Nelson, Spencer, Shelby, and Henry) and 4 KHS (Boyle, Mercer, Anderson, and
Franklin) counties that were excluded from the previous analysis. The final two columns of
Table 4 suggest that these counties are extremely similar, other than the managed care region
they were assigned to. Figure 5 presents outpatient, professional, and inpatient utilization
comparisons. The figure suggests similar utilization rates in both sets of counties prior to the
34
neighbors. These graphs therefore lend further support to the notion that the Passport plan was
better able to reduce utilization than the KHS plan.
Provider Participation
Our final specification check examines provider participation. Are the reductions in
Passport utilization coming from reduced access to health care (i.e., fewer providers participating
in the program), rather than more efficient delivery of services? A managed care network would
likely restrict the number of doctors, but were those restrictions so severe as to cause the
reduction we observe? From the universe of Medicaid recipients in the treatment/control
counties, we are able to extract unique provider identifiers. Figure 6A illustrates that although
the number of Medicaid providers did not grow in the Passport counties (as they did in the
control counties), they did not shrink either. In addition, the figure shows that the number of
providers did not abruptly change with the implementation of managed care, even though
utilization did. The differences in levels seem to reflect population size differences. Figure 6B
shows a similar pattern for the KHS plan. As a result, it is difficult to believe that the sharp drop
in utilization we observe within Passport is the result of reduced access.
VIII. Discussion and Conclusion
The unique introduction of managed care in the Kentucky Medicaid program allows us to
document and analyze organizational differences between two Medicaid managed care plans that
started at the same time, operated in close proximity to one another, and served relatively
homogeneous sets of enrollees. In particular, we focus on differences in physician
reimbursement systems used by the two plans because such reimbursement systems are,
according to Copper and Rebitzer (2002), often considered a “black box whose internal operation