Abstract — The Ethylene production process is one of the most important aspects of a petrochemical plant. The bulk of the worldwide annual commercial production of Ethylene is based on thermal cracking of petroleum hydrocarbons with steam. This process is commonly called Steam cracking process. This article deals with Amir Kabir Petrochemical Olefin Furnaces that are located in special region of Bandar Imam in Iran and all required information and data for modeling are offered in this article.
In this research, the effect of COT (Coil outlet temperature) on the reactor yield is gained. A simulator is developed by the use of a mathematical model, which describes the static operation of a naphtha thermal cracking furnace. The model is used to predict the steady state profile of Ethylene and Propylene products yield.
To study even more, the thermal cracking is simulated with Linde company software. The results of mathematical model and simulation have been compared with laboratory results of Olefin unit of Amir Kabir Petrochemical.
Key Words: Thermal Cracking Furnace, Mathematical pyrolysis, simulation, Coil Outlet Temperature.
I. INTRODUCTION
Production of Olefin is one of the main processes in petrochemical industries. As we know, heat transfer is an essential phenomenon in industries [1]. The radiation heat transfer is the main way to crack the feed. In the future the new radiation source values, which have been calculated using the new approach, will replace old ones in the fluent for attaining more accurate results until a certain convergence limit is reached [2].
The reactions of thermal cracking of hydrocarbons are done inside of long tubes in the furnace boxes under the heat of the furnace burners. In fact, the furnace of thermal Cracking is the heart of pyrolysis system. Feed and steam (as diluents) are mixed before entering the reactor [3]. The furnace of thermal cracking is made of three parts that is divided in to: convection, radiation and stack. The convection zone is used for heating and evaporation of feed that TLE (Transfer line exchangers) are in this zone [4]
* Corresponding author Ph. D Student of Chemical Engineering. (Corresponding author to provide phone: 00989166523309; fax: 00986113329193; e-mail: zarinabadi@ yahoo. com).
1- Faculty member of Islamic Azad University, Ahvaz branch,Iran. 2- Young Researchers club- Islamic Azad university, Ahvaz branch, Iran.
3- MSC student of chemical Engineering of Islamic Azad University Mahshahr branch, Iran.
4- Faculty member of Islamic Azad University, Mahshahr branch, Iran (e-mail: [email protected]).
Feed and dilution steam are mixed together in this zone. Reactions of cracking do not take place in convection zone. These reactions should be done after entering feed and steam to radiation zone. Because in this zone, the major part of heating reactor can be transferred along with tubes. Since both Ethylene and Propylene are important products of petrochemical industry, operation and control of this unit is very important. Parameters such as feed type, residence time, dilution steam ratio and coke deposition effect on production efficiency [5]. Coil outlet temperature
(COT) is one of the most important parameters. Rao, et al [6] simulated the reactor and the radiant box
simultaneously; several packages were developed by other researcher [7-13]. In this article, by using the mathematical mode and the effect of COT on the reactor yields are studied.
For this purpose, the cracking reactor of Amir-Kabir petrochemical is modeled with three methods by using the Table Curve 2D software and experimental data by Linde software and with Masoumi [14] model and mass, energy balance. Finally, results of three methods are compared and concluded.
II. Mathematical model
In order to find out the best operating conditions for cracking furnace of Amir-Kabir petrochemical Olfin unit, the furnace is modeled. The purpose of modeling is to obtain the best COD that is the most important parameter in cracking reactors.
In this paper, the reactor was modeled with three different methods. In the first method, using laboratory data obtained from Amir-Kabir Olefin unit and the Table Curve 2D software, an optimal value of COT for Ethylene and Propylene is obtained. In the second method, using the Linde software, cracking reactor is simulated at actual temperature, pressure… of operation condition. In the third method, using modeling based on mass balance and energy on the differential element of the coil of reactor and using the model provided by Masoumi et al, the optimum Cot to produce Ethylene and Propylene is obtained. This model was selected because of its acceptable results in comparison with the results obtained from experimental and Linde software. In the third methods, the effect of temperature is studied with constant residence time and constant dilution steam ratio in reactor.
A. Mathematical model using the Table Curve 2D software
In this section a mathematical model provided with experimental results for Amir-Kabir petrochemical Olfin unit. The tests were done for the feed that injected to the
Modeling and Simulation for Olefin Production
in Amir Kabir Petrochemical
liquid furnaces. For each temperature (COT)at least three experiments were done non- simultaneously. Some results tests were ignored because of they were far from other results (The reason of this action is possibility of error in some experiments or some measurement tools). The results of tests for different temperatures COT are given at the table 2 for important products of the reactor. In this section the results of experiments performed via gas Chromatography are offered.
The figures show increasing COT will increase the Ethylene yield. Through the use of Table Curve 2D software, the equations 1 and 2 are obtained. Figures 3 and 4 show the best curves for experimental results points. For equation 1; X is amount of COT in degree centigrade and Y is yield of Ethylene in product. a, b, c, d are constants value.
Y= a+b (lnx) ² +clnX+d/lnX (1) a= 22440751
b= 165449.75 c= -3337322.3 d= -50301632
For equation 2; X is amount of COT in degree centigrade and Y is yield of Propylene in product. a, b, c, d are constants values.
Y=a+bX +cX²+dX³ (2) a=141668.94
b= -512.07222 c= 0.61675711 d= -0.0002474
In order to obtain the optimum point for Propylene production, derivative from equation (2) and the root of that the value of X is the optimum COT for the highest Propylene production. This optimum COT is 848.4 ºc. In the other word, if the highest production of Propylene is desired, the operating conditions must be controlled that COT will adjust around 849 ºc.
B. The simulation of Olefin reactor of Amir-Kabir petrochemical with LINDE software suitable
The Linde software is very suitable for simulating of Olefin furnace. This software have this ability to calculate the yield of production of reactor at different COT with entering the operational data such as feed composition, feed flow, number of furnaces, steam dilution ratio and furnace pressure. Ethylene and Propylene is desired product because these are priceless.
Thermal coil systems is a long tube inside the furnace that Naphta feed is entered into these tubes and after thermal cracking with steam, several products are produced. Naphtha is a mixture of hydrocarbons, which are mostly in ranges from C5 to C10 paraffin. In the reactor numerous cracking reactions occur to produce Ethylene and Propylene.
In this work, a free-radical reaction set with the kinetic parameters for 90 species and 543 reactions has been used. [15]
Masoumi et al model was selected because of near results comparison with LAB results and same operation condition. The geometry of the model configuration for the reactor tube is shown in figure 6.
The following assumption has been considered for the mathematical model:
1- One dimensional flow
2- Plug flow and turbulent regime
3- Radial concentration gradient and axial dispersion are negligible
4- Ideal gas behavior
5- Inertness of the dilution steam in feed
6- No hydrodynamic or thermal entrance region effects 7-Quasi steady state in coke deposition model
In this form, the coking rate model is pseudo steady-state with respect to time. In other words, coking rate is assumed to be constant to be constant over a time step. This assumption would be indeed valid as long as the coke
formation rate does not change appreciably over a sufficiently small time step.
Mass, energy and momentum equations are as follows: Mass balance:
(3)
Energy balance:
(4)
Momentum balance:
(5) With the friction factor:
(6)
And for the tube bends as:
(7) Where Rb and Λ are tube bend radius and bend angle
respectively. Since, the coking is slow, quasi steady-state conditions may be assumed, so that, we can write the rate of coke formation.
(8)
The governing mass, energy and momentum balance equations for the cracking coil constitute the two-point boundary value problem which is highly stiff. The implicit Euler method [16] is used for solving the equations. The rate of coke formation has been taken into account [17, 18, and 19]. The tuning parameters, such as overall heat transfer coefficient and coking rate factor can be adjusted to make the model prediction close to the actual data [20]. The developed software receives the feed specifications and provides products yield and get temperature profile.
III. Modeling result
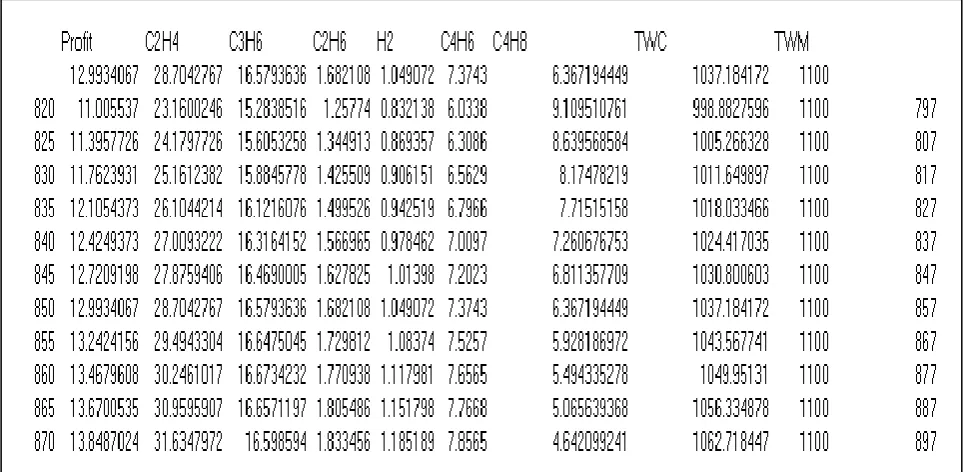
Specifications of NAFTA feed are given in Table (4). In order of obtain Ethylene and Propylene yield at different COT, the effect on COT is studied with constant stem dilution ratio at 0.7 and feed flow at 10 g/min. Table 5 shows the results of modeling after run the program.
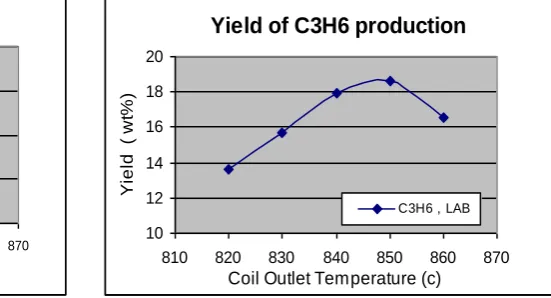
Figures (7) and (8) shows that increasing COT will increase the Ethylene yield. Increasing COT up to 850 ºc increases the Propylene yield and after that decreases the yield of Propylene.
IV. Comparison of three method results
In this section, the three obtained results of models is compared together. These results have been are given in figure (9).
Based on fig. (9), in all three models. Increasing COT will increase the Ethylene yield. Also increasing temperature will increase the rate of coke deposition in the inner tube surface of cracking coil. According to design documents of Amir-Kabir Olefin reactor [21], the allowed coil outlet temperature (COT) is less than 860 ºc. Comparison of the simulation, modeling and experimental results show similar trends.
Based on Fig (10), comparison of the simulation, modeling and experimental results show similar trend in all three methods. Increasing temperature will increase the Propylene yield at first, and then will decrease it, because Propylene is used in the second reactions and consequently decreased the Propylene yield.
The maximum of Propylene yield in these three models are slightly different because of models assumptions and some measurement experimental errors.
V. Discussion and conclusion
In order to have best temperature for having better production that shall be economically optimize we shall perform some calculations.
In according to the best operating condition for cracking furnace, it was modeled with three different models. The most important parameter of operating condition is coil outlet temperature. So the effect of this parameter was studied on Ethylene and Propylene yield. The comparison of the results of three methods shows that these models predict the behavior of cracking reactor properly. For all of three models, increasing COT will increase the Ethylene yield. Consequently, if Ethylene is desired product, the operating parameter must control to adjust COT on allowed limit of (860 ºc).
Increasing COT will decrease Propylene yield at first and then it will decrease. Because Propylene is used in the second reactions.
According to results the best COT is 850 ºc. This temperature is very suitable. Because increasing COT, will increase coke deposition inside the coils, and due to shut down of the unit for decoking operation. This operation is very costly.
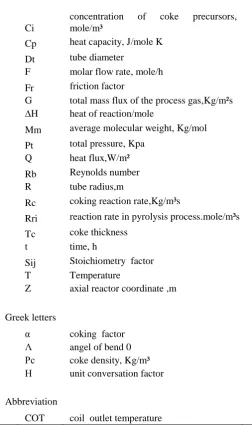
Nomenclature
Table (6):Parameters used in model based mass,energy balance
Ci
concentration of coke precursors,
mole/m³
Cp heat capacity, J/mole K
Dt tube diameter
F molar flow rate, mole/h
Fr friction factor
G total mass flux of the process gas,Kg/m²s
∆H heat of reaction/mole
Mm average molecular weight, Kg/mol
Pt total pressure, Kpa
Q heat flux,W/m²
Rb Reynolds number
R tube radius,m
Rc coking reaction rate,Kg/m³s
Rri reaction rate in pyrolysis process.mole/m³s
Tc coke thickness
t time, h
Sij Stoichiometry factor
T Temperature
Z axial reactor coordinate ,m
Greek letters
α coking factor
Λ angel of bend 0
Ρc coke density, Kg/m³
Η unit conversation factor
Abbreviation
[image:3.595.304.557.164.590.2]Appendix
Figure (1): Production of Ethylene based on coil Outlet temperature Figure (2): Production of Propylene based on coil Outlet temperature
Figure (3): Yield of Ethylene at different amount of COT Figure (4): Yield of Propylene at different amount of COT
Figure (5): Entering data page in Linde software
Yield of C2H4 production
20 25 30 35 40
810 820 830 840 850 860 870
Coil Outlet Temperature (c)
Y
ie
ld
(
w
t%
)
C2H4,LAB
Yield of C3H6 production
10 12 14 16 18 20
810 820 830 840 850 860 870
Coil Outlet Temperature (c)
Yi
e
ld
(
w
t%
)
[image:4.595.240.516.77.226.2]
Figure (6): Differential element of cracking coil Figure (7): Production of Ethylene based on coil outlettemperature
Figure (8): Production of Propylene based on coil outlet temperature Figure (9): Production of Ethylene based on coil outlettemperature
Figure (10): Production of Propylene based on coil outlet temperature
Yield of C2H4 production
25 27 29 31 33 35 37
820 830 840 850 860 870 880 890 900
Coil Outlet Temperature ( c)
Yi
e
ld
(w
t%
)
C2H4,MODEL
Yield of C3H6 production
10.8 11 11.2 11.4 11.6 11.8 12 12.2 12.4
820 830 840 850 860 870 880 890 900
Coil Outlet Temperature ( c)
Y
ie
ld
(
w
t%
)
C3H6,MODEL
Comparison MODEL & LAB & SIM results for Ethylene
0 5 10 15 20 25 30 35 40 45
810 820 830 840 850 860 870 880 890 900
Temperature ( c)
Y
ie
ld
(
w
t%
)
MODEL SIM LAB
Comparison MODEL & LAB & SIM results for Prophylene
0 3 6 9 12 15 18 21 24
810 820 830 840 850 860 870 880 890 900
Temperatute ( c)
Y
ie
ld
(
w
t%
)
[image:5.595.32.550.61.225.2] [image:5.595.35.551.293.486.2] [image:5.595.171.419.544.739.2]Table (1): The component of feed injected to liquid furnaces in Amir Kabir Olefin unit.
Table (2): The value of Ethylene and Propylene produced in the Olfin reactor of Amir-Kabir petrochemical
Table (3): After entering all data and run the program, the yield of products is obtained at different COT. Coil Outlet
Temperature
C2H4 yield
(Wt%) C3H6 yield (wt%)
820 27.01 13.63
830 29.99 15.67
840 31.96 17.89
850 35.33 18.61
[image:6.595.62.546.113.376.2] [image:6.595.172.422.414.513.2] [image:6.595.60.542.565.801.2]Table (4): Specification of Naphtha feed (wt %) Carbon
no. n-Paraffin Iso-paraffins Naphthenes Aromatics
4 0.22 2.67 … …
5 25.22 17.94 4.19 …
6 14.88 23.41 2.82 2
7 1.67 3.27 … 0.97
8 … 0.57 … 0.2
Total 41.99 47.83 7.01 3.17
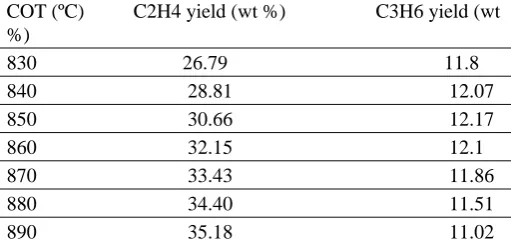
Table (5): Modeling result for Ethylene and Propylene yield at different COT
COT (ºC) C2H4 yield (wt %) C3H6 yield (wt %)
830 26.79 11.8 840 28.81 12.07 850 30.66 12.17 860 32.15 12.1 870 33.43 11.86 880 34.40 11.51 890 35.18 11.02
References
[1] Zairian. E, Zarinabadi. E., "Transport Phenomena, Byron Bird, Warren Stewart, Edvin Lightfoot", translated to Persian by, Ahvaz University, 2009.
[2] Ziarifar. E, Zarinabadi. E., "Identification & Removing Problems of Heat exchangers in Industries", International conference on heat exchanger application in oil & Energy Industries, Tehran, Iran, 2009.
[3] Ziarifar. E, Zarinabadi. E.,"Study of the Mechanism of coke formation in Amir Kabir petrochemical complex (Olfin plant)" , M. Hosseini, M.Abdideh, conference of research in chemistry and nanotechnology, dourod, ran, 2009.
[4] Ziarifar. E, Zarinabadi. E, Rahimi.Y, Golabi. E.," Mathematical modeling of transfer line exchanger (TLE) and Optimization of steam drum blow down", The National conference of chemical engineering, Islamshahr, Tehran, Iran, 2009.
[5] Ziarifar. E, Hosseini. M, Hosseini Tarighaleslami. A., A., Bozorgian., "Offering Cracking model of Olfin Furnaces and finding optimized temperature of Process", The National conference of chemical engineering, Islamshahr, Tehran, Iran, 2009.
[6] Rao, R. M. N., Plehiers, M. N.and Froment, G. F., "chem. Eng.Sci", 43, 1223, 1998.
[7] Froment, G. F.,Van de steen , B. O., Berghe , P. J. V.,and Goossens, G. A., AICHE, J., 23, 93,1997.
[8] Dente, M., Ranzi, E., Barendregt, S., and Goossens, G. A., AICHE 72nd annual meeting, 1979.
[9] Dente, M., Ranzi, E and Goossens, G. A., Comp Chem. Eng, 3, 61, 1979.
[10] Towfighi, J., Nazari, H., and Karimzadeh, R., APCCHE, CHEMECA 93, Melbourne, Australia, 3,337, 1993,
[11] Joo, E.,Lee, k., Lee, M., and Park, S., Comp. hems. Eng., 24, 1523, 2000.
[12] Gothem , M. W. M ., Kleineedorst , F. I., Leeuwen , C. V., and Velaen , N. V. ," Comp.Chem.Eng ", 24, 905, 2001. [13] Joe, Eland Park, S., Ind. Eng. Chem. Res., 40, 2409, 2001 [14] Masoumi M. E., Sadrameli M., Towfighi J., Niaei A.
Simulation., "Optimization and control of a thermal cracking furnace". Iran J Chem Eng., 2006, pp. 516-27. [15] Joo, E., Park S., "Pyrolysis reaction mechanism for
industrial Naphtha thermal cracking furnaces". Ind Eng. Chem. Res, 2002, pp. 40, 2409-15.
[16] Thomas P., "Simulation of industrial process". London, Butterworth, 1999.
[17] Kopinke FD, Zimmermann G, Nowak S.,"On the mechanism of coke formation in steam Cracking, conclusion from results obtained by trace experiments. Carbon, 1998.
[18] Kopinke FD, Zimmermann G, Rayners G, Froment GF. Relative rate of coke formation from hydrocarbon in steam cracking of Naphtha, 2. Parafins, Naphthenes, mono, di and cyclo Olefins and acetylenes. Ind Eng Chem Res 1993, pp.56-61.
[19] Kopinke FD, Zimmermann G, Rayners G , Froment GF."Relative rate of coke formation from hydrocarbon in steam cracking of Naphta", ,3 Aromatic hydrocarbons. Ind Eng Chem Res 1993, pp.2620-5 [20] Towfighi, J., Niaei, A., Hoseini, S., "Development of
Kinetic model for coke formation in thermal cracking of Naphta" .Iran J Sci Technol, Trans B 2001.
[image:7.595.168.420.58.181.2] [image:7.595.165.421.210.332.2]