Use of Project Management and Lean
Manufacturing Tools in SMEs: A Case Study
Mr. Y.S. Sable1, Rohan Pujari2, Anurag Lahoti3, Shreyas Kuthe4 1
Assistant Professor, 2, 3, 4Student, Department of Mechanical Engineering, PES College of Engineering, Aurangabad, Maharashtra.
Abstract:In this article, we have implemented Lean tools on a project, as a result of the competitive environment in small enterprises, it's obligatory to complete projects in time. Effective project management is necessary to reduce the lead time of the project and to complete a project without delay with available resources, in this study we have used project management technique like CPM and PERT to find the critical path and the buffering time of the project. We have also implemented lean tools such as Kanban, Multi-Activity Chart, PPC to reduce the lean waste. At the end of the study the result will be analyzed, In this study tools like Gantt chart, Manual dot entry, Fever Chart are used to track the progress of the project.
Keywords: Lean Manufacturing, Project Management, CPM, PERT, SME.
I. INTRODUCTION
In the last years so called SME, small and medium sized enterprises, moved into the focus of many authors in their scientific work. The reason for this trend is based on the fact, that micro, small, and medium-sized enterprises are numerous and usually the backbone of the economy.[1] As lean reduces the cost of the production along with increasing the quality hence improves profit. In a perfect world, organizations have come to realization that when waste are reduced through Lean Manufacturing there is increase in overall profit and quality of the product. Goal of any SME is mainly to value customer, to have perfect process.
The systematic implementation of Lean Manufacturing in SMEs will yield huge benefits such as quality improvement, cycle time reduction and good customer responsiveness. [2] The best practices which can be implemented are use of Kanban card for information sharing between supplier and customer. Completing a project in SME on time and within budget is not an easy task. In spite of advances in the field of project management today, most projects in SME today face cost and time over-runs which increases with the increase in complexity of the project involved. A large number of factors contribute to delays. This is because some project activities are critical in the sense that delays the overall project completion time. Therefore proper planning and scheduling of project is important to overcome the delays.[3]
A project can defined as a set of activities performed in a certain sequence determined technologically, in our case the project is a press tool die.
The two approaches that have been proved for planning, scheduling and finding the critical path and the buffering time of the project are Critical Path Method (CPM) and Project Evaluation and Review Technique (PERT). This activities help to evaluate the start time and the earliest finish time, slack time, define critical path of the project which helps in evaluate the overall project duration.
The analysis used in both techniques is very similar. The major difference is that. In CPM activity times are assumed proportional to the amount of resources allocated to them, and by changing the level of resources the activity times and the project completion time can be varied. Thus CPM assumes prior experience with similar projects from which the relationships between resources and job times are available. On the other hand, PERT incorporates uncertainties in activity times in its analysis. It determines the probabilities of completing various stages of the project by specified deadlines. It also intends the expected time to complete the project. An important and extremely useful by product of PERT analysis is its identification of various bottlenecks in a project.
II. OBJECTIVES
Objectives of this study are to:
1) Implement and develop a model of lean technique for industry
2) Solving problem of industry by implanting Project Management and lean tools
3) Reduce defects
4) Reduce lead time of the project
5) Improve labour productivity
6) Increase output
III. SURVEY
What were the problems for the Growth of SME?
1) High project lead time of 22 days
2) No awareness of concept of Elimination of Waste
3) No formal training system on Lean
4) No scientific production planning
5) Demand is more than Supply.
IV.METHODOLOGY
Target: To reduce production time from 22 days to 18 days. Preceding activities
1) Study all the processes.
2) To find alternate solutions.
3) Problems faced while production.
4) Finding key activity responsible for time loss.
A. CPM and PERT
In this study, CPM and PERT, which are project management techniques, will be used to improve lead time of the project. CPM (Critical Path Method) and PERT (Programme Evaluation and Review Technique) are the scheduling techniques which are used to plan, schedule, and control a project consisting of number of interrelated activities. These techniques provide a frame which defines the job to be done, integrates them in a logical sequence and provides a system of control over the progress of the plan. [4]
The PERT technique is a method of minimizing trouble spots, programed bottlenecks, delays and interruptions by determining critical activities before they occur so that various activities in the project can be coordinated.
To + 4 Tm + Tp
Expected Time (Te) = ---
6 Where,
To is the Optimistic time,
Tm is the most likely time,
Tp is the Pessimistic time.
B. Manual Dot Entry
Manual dot entry is a tool used to track the progress of the project. In which the blank box represents that the work has not been started, single dot represents that the work is in progress, and two dots in the box represent that the work is completed. Use of the manual dot entry is easy and it easily shows the progress of the project.
C. Multi Activity Chart
Multiple Activity Charts (or Multi-Activity Charts) are a very useful tool for understanding the flow of work in a cyclical process and as a consequence understanding which resource is controlling the overall progress of the work. The tool can be used to model different scenarios to determine the optimum mix of resources for the work. The example below is based on using a tower crane to lift concrete from the street to a high floor for placing. Each resource is represented by a column; time is on the vertical axis.[5]
D. Kanban System
V. RESULTS AND ANALYSES A. CPM Before Implementation
The Figure shows the processes to manufacture a blanking press tool die. In which spacer plate takes the maximum time to get manufactured. Spacer plate manufacturing being the critical path of the project taking time of 22 days.
Table I
Description Activity Predecessor Start Date End Date Duration Path
VD19008-Bottom Plate-Design A - 08-Jan-19 12-Jan-19 4 te1
VD19008-Bottom Plate-RM Purchase B A 12-Jan-19 14-Jan-19 3 te12
VD19008-Bottom Plate-Turning/Milling C B 13-Jan-19 13-Jan-19 1 te13
VD19008-Bottom Plate-Grinding D C 13-Jan-19 16-Jan-19 4 te14
VD19008-Bottom Plate-DRO/Jig Boring E D 16-Jan-19 19-Jan-19 3 te15
VD19008-Bottom Plate-Verification F E 19-Jan-19 19-Jan-19 1 te16
VD19008-Die Plate-Design G - 08-Jan-19 11-Jan-19 4 te1
VD19008-Die Plate-RM Purchase H G 11-Jan-19 16-Jan-19 6 te22
VD19008-Die Plate-Turning/Milling I H 16-Jan-19 16-Jan-19 1 te23
VD19008-Die Plate-Grinding J I 16-Jan-19 16-Jan-19 1 te24
VD19008-Die Plate-HT K J 17-Jan-19 18-Jan-19 2 te25
VD19008-Die Plate-Spl. M/c L K 19-Jan-19 19-Jan-19 1 te26
VD19008-Die Plate-Verification M L 19-Jan-19 19-Jan-19 1 te27
VD19008-Pad-Design N - 08-Jan-19 11-Jan-19 4 te1
VD19008-Pad-RM Purchase O N 11-Jan-19 16-Jan-19 6 te32
VD19008-Pad-Turning/Milling P O 16-Jan-19 16-Jan-19 1 te33
VD19008-Pad-Grinding Q P 17-Jan-19 17-Jan-19 1 te34
VD19008-Pad-HT R Q 17-Jan-19 19-Jan-19 2 te35
VD19008-Pad-Spl. M/c S R 20-Jan-19 20-Jan-19 1 te36
VD19008-Pad-Verification T S 20-Jan-19 20-Jan-19 1 te37
VD19008-Spacer plate-Design U - 08-Jan-19 11-Jan-19 4 te1
VD19008-Spacer plate-RM Purchase V U 13-Jan-19 18-Jan-19 6 te42
VD19008-Spacer plate-Turning/Milling W V 18-Jan-19 18-Jan-19 1 te43
VD19008-Spacer plate-Grinding X W 20-Jan-19 22-Jan-19 3 te44
VD19008-Spacer plate-DRO/Jig Boring Y X 22-Jan-19 22-Jan-19 1 te45
VD19008-Spacer plate-Spl. M/c Z Y 22-Jan-19 23-Jan-19 2 te46
VD19008-Spacer plate-HT AA Z 24-Jan-19 26-Jan-19 2 te47
VD19008-Spacer plate-Verification AB AA 26-Jan-19 26-Jan-19 1 te48
VD19008-Punch-Design AC - 08-Jan-19 12-Jan-19 4 te1
VD19008-Punch-RM Purchase AD AC 12-Jan-19 17-Jan-19 6 te52
VD19008-Punch-Turning/Milling AE AD 17-Jan-19 17-Jan-19 1 te53
VD19008-Punch-Grinding AF AE 17-Jan-19 17-Jan-19 1 te54
VD19008-Punch-HT AG AF 18-Jan-19 20-Jan-19 2 te55
VD19008-Punch-Spl. M/c AH AG 21-Jan-19 21-Jan-19 1 te56
VD19008-Punch-Verification AI AH 21-Jan-19 21-Jan-19 1 te57
VD19008-Top Plate-Design AJ - 08-Jan-19 12-Jan-19 4 te1
VD19008-Top Plate-RM Purchase AK AJ 12-Jan-19 17-Jan-19 6 te62
VD19008-Top Plate-Turning/Milling AL AK 17-Jan-19 17-Jan-19 1 te63
VD19008-Top Plate-Grinding AM AL 17-Jan-19 19-Jan-19 2 te64
VD19008-Top Plate-DRO/Jig Boring AN AM 20-Jan-19 20-Jan-19 1 te65
VD19008-Top Plate-Verification AO AN 20-Jan-19 20-Jan-19 1 te66
VD19008-Die-Validation AP F,L,T,AB,AI,AO 27-Jan-19 27-Jan-19 1 te2
VD19008-Die-Dispatch AQ AP 28-Jan-19 28-Jan-19 1 te3
Fig. I
Table III
Critical Path= 22 DAYS
This data shows that the path U-V-W-X-Y-Z-AA-AB-AP-AQ has maximum lead time and it is the critical path. From table it is seen that design and raw material purchase are common activities in all the processes and in all kind of manufacturing, as there is no constant and mirror production the main focus of the project should be on design and raw material purchase. As design phase is taking 4 days to make complete design and raw material purchase is taking 3 to 6 days these paths should be optimized and lead time should be reduced.
B. CPM After Implementation
As the design and Raw material procurement was common in all the process. So we focused on reducing the time in material procurement by first designing the assembly design and producing the bill of material in 1 day so that the material can be ordered earlier. Due to which the detail design and material procurement is going simultaneously which reduces the lead time. The other method used to reduce the lead time is finding alternate vendors who can complete the processes within minimum time. The below figure shows the CPM after implementing the above points.
Path Lead Time Float
A-B-C-D-E-F-AP-AQ 18 4
G-H-I-J-K-L-M-AP-AQ 18 4
N-O-P-Q-R-S-T-AP-AQ 18 4
U-V-W-X-Y-Z-AA-AB-AP-AQ 22 0
AC-AD-AE-AF-AG-AH-AI-AP-AQ 18 4
Table IIIII
Description Activity Predecessor Start Date End Date Duration
VD19021-Assembly Design A - 02-Feb-19 02-Feb-19 1
VD19021-RM Order B A 03-Feb-19 03-Feb-19 0
VD19021-RM Purchased C B 03-Feb-19 05-Feb-19 3
VD19021- Detail Design D A 03-Feb-19 04-Feb-19 2
VD19021-Bottom Plate-Turning/Milling E C,D 05-Feb-19 05-Feb-19 1
VD19021-Bottom Plate-Grinding F E 06-Feb-19 07-Feb-19 2
VD19021-Bottom Plate-DRO/Jig Boring G F 08-Feb-19 09-Feb-19 2
VD19021-Bottom Plate-Verification H G 10-Feb-19 10-Feb-19 1
VD19021-Die Plate-Turning/Milling I C,D 05-Feb-19 05-Feb-19 1
VD19021-Die Plate-Grinding J I 06-Feb-19 07-Feb-19 2
VD19021-Die Plate-HT K J 08-Feb-19 09-Feb-19 2
VD19021-Die Plate-Spl. M/c (WC) L K 10-Feb-19 10-Feb-19 1
VD19021-Die Plate-Verification M L 11-Feb-19 11-Feb-19 1
VD19021-Punch holder-Turning/Milling N C,D 05-Feb-19 05-Feb-19 1
VD19021-Punch holder-Grinding O N 06-Feb-19 07-Feb-19 2
VD19021-Punch holder-DRO P O 08-Feb-19 09-Feb-19 2
VD19021-Punch holder-Verification Q P 10-Feb-19 10-Feb-19 1
VD19021-Stipper plate-Turning/Milling R C,D 05-Feb-19 05-Feb-19 1
VD19021-Stipper plate-Grinding S R 06-Feb-19 07-Feb-19 2
VD19021-Stipper plate-DRO/Jig Boring T S 08-Feb-19 09-Feb-19 2
VD19021-Stipper plate-Spl. M/c (WC) U T 10-Feb-19 10-Feb-19 1
VD19021-Stipper plate-Verification V U 11-Feb-19 11-Feb-19 1
VD19021-Punch-Turning/Milling W C,D 05-Feb-19 05-Feb-19 1
VD19021-Punch-Grinding X W 06-Feb-19 07-Feb-19 2
VD19021-Punch-DRO/Jig Boring Y X 08-Feb-19 09-Feb-19 2
VD19021-Punch- HT Z Y 10-Feb-19 11-Feb-19 2
VD19021-Punch-Spl. M/c (WC) AA Z 12-Feb-19 12-Feb-19 1
VD19021-Punch-Verification AB AA 13-Feb-19 13-Feb-19 1
VD19021-Top Plate-Turning/Milling AC C,D 05-Feb-19 05-Feb-19 1
VD19021-Top Plate-Grinding AD AC 06-Feb-19 07-Feb-19 2
VD19021-Top Plate-DRO/Jig Boring AE AD 08-Feb-19 09-Feb-19 2
VD19021-Top Plate-Verification AF AE 10-Feb-19 10-Feb-19 1
VD19021-Die-Validation AG H,M,Q,V,AB,AF 14-Feb-19 15-Feb-19 2
VD19021- Trial & Rework AH AH 16-Feb-19 16-Feb-19 1
Table IVV
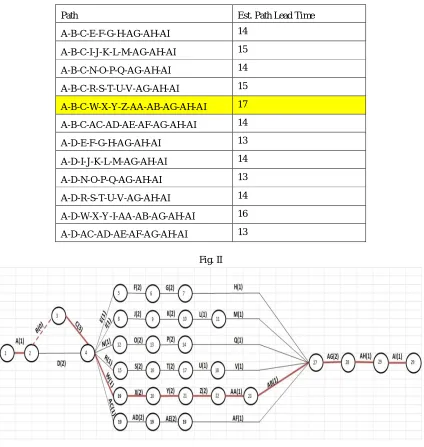
Path Est. Path Lead Time
A-B-C-E-F-G-H-AG-AH-AI 14
A-B-C-I-J-K-L-M-AG-AH-AI 15
A-B-C-N-O-P-Q-AG-AH-AI 14
A-B-C-R-S-T-U-V-AG-AH-AI 15
A-B-C-W-X-Y-Z-AA-AB-AG-AH-AI 17
A-B-C-AC-AD-AE-AF-AG-AH-AI 14
A-D-E-F-G-H-AG-AH-AI 13
A-D-I-J-K-L-M-AG-AH-AI 14
A-D-N-O-P-Q-AG-AH-AI 13
A-D-R-S-T-U-V-AG-AH-AI 14
A-D-W-X-Y-I-AA-AB-AG-AH-AI 16
[image:6.612.95.519.93.540.2]A-D-AC-AD-AE-AF-AG-AH-AI 13
Fig. II
It is observed from the data that after implementation critical path reduces from 22 days to 17 days by optimizing time required for design and material purchase. To reduce time we have followed following procedure.
1) When customer actually places an order then only assembly drawing should be prepared. It should take nearly one day.
2) On the same day B.O.M. should be prepared and sent to material supplier.
3) Supplier takes minimum 3 to 4 days to send material.
4) In period of these 3 to 4 days detail drawing of die should be prepared. In this way critical path is reduced from 22 days to 17 days.
C. Programme Evaluation and Review Technique (PERT)
Table V
Description Activity Predecessor t0 tm tp te sd sd2
VD19021-Assembly Design A - 1 1 2 1.17 0.17 0.028
VD19021-RM Order B A 0 0 1 0.17 0.17 0.028
VD19021-RM Purchased C B 3 3 4 3.17 0.17 0.028
VD19021- Detail Design D A 2 2 3 2.17 0.17 0.028
VD19021-Bottom Plate-Turning/Milling E C,D 1 1 2 1.17 0.17 0.028
VD19021-Bottom Plate-Grinding F E 2 2 3 2.17 0.17 0.028
VD19021-Bottom Plate-DRO/Jig Boring G F 2 2 3 2.17 0.17 0.028
VD19021-Bottom Plate-Verification H G 1 1 2 1.17 0.17 0.028
VD19021-Die Plate-Turning/Milling I C,D 1 1 2 1.17 0.17 0.028
VD19021-Die Plate-Grinding J I 2 2 3 2.17 0.17 0.028
VD19021-Die Plate-HT K J 2 2 4 2.33 0.33 0.111
VD19021-Die Plate-Spl. M/c (WC) L K 1 1 2 1.17 0.17 0.028
VD19021-Die Plate-Verification M L 1 1 2 1.17 0.17 0.028
VD19021-Punch holder-Turning/Milling N C,D 1 1 2 1.17 0.17 0.028
VD19021-Punch holder-Grinding O N 2 2 3 2.17 0.17 0.028
VD19021-Punch holder-DRO P O 2 2 3 2.17 0.17 0.028
VD19021-Punch holder-Verification Q P 1 1 2 1.17 0.17 0.028
VD19021-Stipper plate-Turning/Milling R C,D 1 1 2 1.17 0.17 0.028
VD19021-Stipper plate-Grinding S R 2 2 3 2.17 0.17 0.028
VD19021-Stipper plate-DRO/Jig Boring T S 2 2 3 2.17 0.17 0.028
VD19021-Stipper plate-Spl. M/c (WC) U T 1 1 2 1.17 0.17 0.028
VD19021-Stipper plate-Verification V U 1 1 2 1.17 0.17 0.028
VD19021-Punch-Turning/Milling W C,D 1 1 2 1.17 0.17 0.028
VD19021-Punch-Grinding X W 1 2 3 2.00 0.33 0.111
VD19021-Punch-DRO/Jig Boring Y X 1 2 3 2.00 0.33 0.111
VD19021-Punch- HT Z Y 2 2 4 2.33 0.33 0.111
VD19021-Punch-Spl. M/c (WC) AA Z 1 1 2 1.17 0.17 0.028
VD19021-Punch-Verification AB AA 1 1 2 1.17 0.17 0.028
VD19021-Top Plate-Turning/Milling AC C,D 1 1 2 1.17 0.17 0.028
VD19021-Top Plate-Grinding AD AC 2 2 3 2.17 0.17 0.028
VD19021-Top Plate-DRO/Jig Boring AE AD 2 2 3 2.17 0.17 0.028
VD19021-Top Plate-Verification AF AE 1 1 2 1.17 0.17 0.028
VD19021-Die-Validation AG H,M,Q,V,AB,AF 1 2 3 2.00 0.33 0.111
VD19021- Trial & Rework AH AH 1 1 2 1.17 0.17 0.028
D. Manual Dot Entry
[image:8.612.86.528.525.717.2]The Table VI shows the data obtained from the Manual Dot Entry, in which all the dots show that the project is completed. The data obtained is plotted on the graph in Fig. III.
Fig. III
Table VI
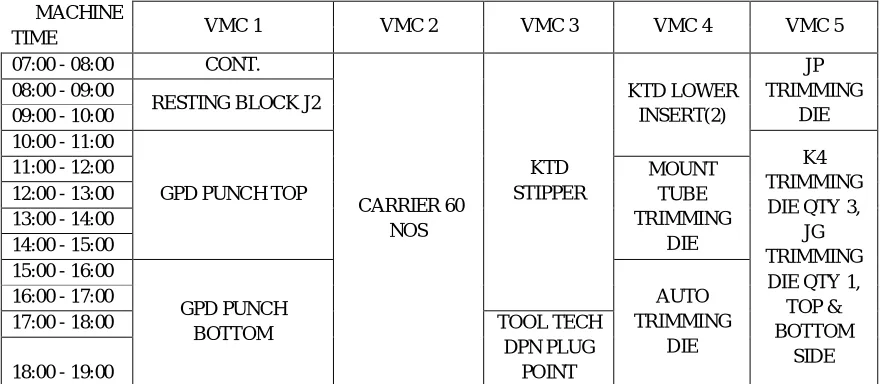
E. Multiple activity Chart
The Table VII shows the planning done to allocate the jobs on a particular machine. Which helps the forecasting of production plan easily, Quick response to customer for delivery, Production loss is reduced as pre planning is done and Machine load is easily visible.
Table VVI
MACHINE
VMC 1 VMC 2 VMC 3 VMC 4 VMC 5
TIME
07:00 - 08:00 CONT.
CARRIER 60 NOS
KTD STIPPER
KTD LOWER INSERT(2)
JP TRIMMING
DIE 08:00 - 09:00
RESTING BLOCK J2 09:00 - 10:00
10:00 - 11:00
GPD PUNCH TOP
K4 TRIMMING DIE QTY 3,
JG TRIMMING DIE QTY 1,
TOP & BOTTOM
SIDE
11:00 - 12:00 MOUNT
TUBE TRIMMING
DIE 12:00 - 13:00
13:00 - 14:00 14:00 - 15:00 15:00 - 16:00
GPD PUNCH BOTTOM
AUTO TRIMMING
DIE 16:00 - 17:00
17:00 - 18:00 TOOL TECH
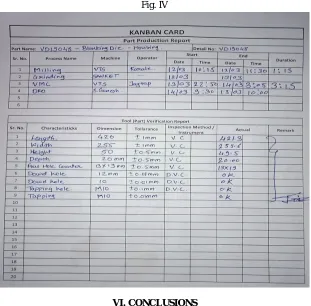
F. Kanban
[image:9.612.151.462.185.491.2]Kanban system is a tool which comes under lean manufacturing. It helps in managing the operations of the job. We used the Kanban chart to as the part production report which included the part name and detail of the particular job. The kanban card easily showed the processes on the job and which machine and operator is allotted to do the job. It also showed the start and end time of the process and the total time needed to complete the job. In the other table it showed the characteristics of the job i.e. length, width and height of the job. It showed the tolerance of the job. Due to the use of this card it is easy to do the processes according to the plan and would manufacture defect free product. Here, the kanban card not only shows the quantity of the product and helps to control the inventory but also the characteristics which is an added benefit.
Fig. IV
VI. CONCLUSIONS
This Study addressed the implementation of lean and project management tools on manufacturing of press tool dies. Using CPM where our project took actual 22 days to complete, by crashing and applying lean tools to the project without incurring additional cost and with the same resources can be completed within 18 days. This is 4.5% decrease in project duration and productivity increased by 18.18%. Reduced lead time ensures fast delivery and satisfaction to the customer. Increase in productivity improves the cash flow so there is a reduction in cost. Implementation of project management and lean tools to all the projects can increase the turn over by 15-20% in the same resources. From the results we thus conclude that the schedule proposed by reduces lead time of the project as compared to the actual time taken by the project and paves the way for use of CPM scheduling for Press tool Die.
REFERENCES
[1] Müller E, Baum H, Schütze J. Process-oriented cooperation assistance system for collaborative networks of micro-businesses. Proc. of CARV 2007, 2nd
int. conf. on changeable, agile, reconfigurable and virtual production 2007; p. 1223–30.
[2] Rose, A.M.N., Deros, B.Md., Rahman, M.N.Ab. & Nordin, N, Lean manufacturing best practices in SMEs, International Conference on Industrial Engineering and Operations Management Kuala Lumpur, Malaysia, January 22 – 24, 2011.
[3] Wallace Agyei, Project Planning and Scheduling Using PERT and CPM Techniques with Linear Programming: Case Study, international journal of scientific & technology research volume 4, issue 08, august 2015.
[4] Operations Research by Manohar Mahajan, Dhanpat Rai & Co.
[5] www.mosaicprojects.com.au/WhitePapers/WP1025 Multi-Activity Charts.pdf
[6] R.Sundara, A.N.Balajib, R.M.Satheesh Kumar, A Review on Lean Manufacturing Implementation Techniques, 12th global congress on manufacturing and management, gcmm 2014.
[7] Jukka Majava, University of Oulu, Industrial Engineering and Management Research Unit, Finland, lean production development in smes: