A Study Analysis of IEEE 802.15.4 Zigbee based
WSN in Campus
Lavpreet Kaur1, Prabhjot Singh2, Damanpal Singh3, Dr. Raju Sharma4 1, 2, 3
Department of Electronics and Communication, Baba Banda Singh Bahadur Engineering College, Fatehgarh Sahib (140407), Punjab, India.
4
Assistant Professor at Department of Electronics and Communication, Baba Banda Singh Bahadur Engineering College, Fatehgarh Sahib (140407), Punjab, India.
Abstract: In this paper, we are analysing the use of Zigbee WSN in domestic applications, here in our case, it is smart campus. This smart campus consists of multiple offices, which are designed in such a way that each office has several sensors, assigned for various environmental factors. The sensor nodes are represented by the Zigbee end device and the master node is represented by the Zigbee coordinator. The data traffic is sent from the end nodes towards the master node or the coordinator, which takes, all the values from sensor nodes as input. The Opnet modeler v17.5 was used for the simulations and study. Our paper analyses, in terms of delay, throughput, load, data traffic received, data traffic sent and data dropped, the WSN performance. Four variations in design were studied according to the number of nodes, rooms, sensor nodes. The study concluded that multiple coordinators (or nodes) reduced the delay in the transmission, while with one coordinator, larger delays are observed. Similarly, others parameters are affected by the number of nodes.
Keywords: Zigbee WSN, Opnet modeler v17.5, delay, throughput, load, data traffic.
I. INTRODUCTION
The latest technology includes the Wireless LAN s. Effective design of wireless sensor networks has become the major concern of researchers in the recent years. In WSNs, the communication is accomplished between various devices as they are gathering information from their monitored fields. [10] The data travels through multiple nodes. Along with the nodes- which are wireless sensors, WSNs also consist of base stations. Such networks exhibit potential in monitoring the physical conditions (or the stimuli) such as sound, temperature, humidity and pass data through the network of nodes to the main station, where the information is needed.
II. ARCHITECTURE OF WSNs
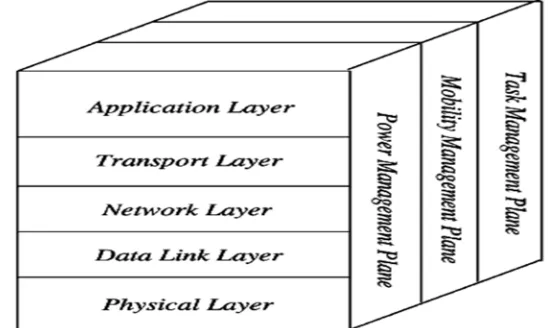
The architecture of WSNs reveal the presence of five major layers- (1)Application layer, responsible for data traffic control and software management (2)Transport layer, for reliable delivery of information through the network (3)Network layer, and is stakeholder for routing (4)Data link layer with the responsibility of framing, multiplexing data streams, error control and MAC, ensuring efficiency of connection in nodes (5)Physical layer furnishes an interface to transmit data stream over the physical medium.
[image:1.612.165.441.546.710.2]III. TOPOLOGIES OF WSNs
There are three main topologies under the Wireless Sensor Networks, namely; star, tree and mesh topologies. [1]
Star Topology- In this topology, each node connects directly to a single gateway which can communicate messages to various other nodes.
Figure. 2(star topology)
Tree Topology or the Cascaded-Star topology- Consecutive nodes are connected where one node is higher in the tree than the other and hence the network expansion is possible.
Figure.3 (Tree topology)
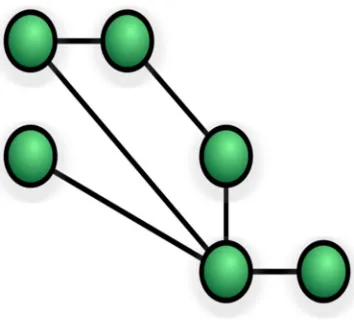
Mesh Topology- This topology enables communication of data, within a radio transmission range, from a node to node. Flaws can be identified easily.
[image:2.612.240.369.137.295.2] [image:2.612.205.407.348.491.2] [image:2.612.217.394.539.706.2]A. Standards For Wireless Connection
In our study, we have used Zigbee, based on the standard, IEEE 802.15.4 is a standard protocol for Wireless Sensor Networks (WSNs) and Wireless Personal Area Networks (WPANs).
B. Zigbee Architecture Or Layers
Zigbee has mainly three layers – (1) Application layer which is responsible for conversion of data into digital form (2) Network Layer is a buffer between the application layer and the data link layer. It is accountable for security, routing and structure of network (3 The standard IEEE 802.15.4 supplied the Data link layer which is further divided into two sublayers, namely; MAC- Medium Access Control and physical layer.
1) Zigbee Coordinator- ZC: It is the originator and hence the root/ centre of the network. It is also capable of storing information about the network and hence is reliable. [3] It is also the one that offers security keys to the network.
Figure. 5 (Zigbee coordinator)
2) Zigbee Router – ZR: Responsible for multi-hop routing of messages. Its function is also as passing the data from the devices through the network.
Figure.6 (Zigbee router)
3) Zigbee End Device – ZED: It is just a sensor/actuator node. It exhibits high power consumption.
[image:3.612.244.370.219.362.2] [image:3.612.234.375.399.532.2]IV. ZIGBEE TOPOLOGIES
There are three major topologies possible with the ZigBee standard: STAR, TREE and MESH
A. Star topology is quite simple in the way, that is represents one parent coordinator and multiple end nodes as children.[4]
Figure.8 (star topology)
B. Tree topology is named relevantly as in this one, the function of roots is performed by the coordinator, the router behaves as the branches of the tree and the fruits are the end nodes.
Figure.9 (Tree topology)
C. Mesh network has a complex formation where coordinators and routers exhibit multiple links among each other and are linked with the end nodes as well. Redundancy in this network topology enables efficient routing and robustness in network.
V. ZIGBEE – FEATURES
It has numerous features susceptible to wireless networking, including: (1) low power consumption, (2) lower time delay, (3) effective cost (4) High security and (5) Superior network quality
This study draws a performance comparison for the effect of number of end nodes and coordinators arranged in the star topology on four different network scenarios based on Zigbee standard using Opnet modeler 17.5. Four parameters namely; THROUGHPUT, DELAY, LOAD and DATA TRAFFIC are analysed for four scenarios where number of nodes and number of coordinators are varied to see their effect.[5]
A. WSN in Campus
This paper deals with the use of Zigbee WSN in campus. This model can be named as the SNART OFFICE CONTROL. it comprises of multiple offices, designed in a way such that each office has sensors for varied environmental factors. Monitoring the safety of the campus is the prominent feature of this paper. The primary purpose of WSN in the campus is to collect internal data like temperature, humidity and light intensity along with a function of sensing the electricity failure from different sensors.
B. Simulation Designs
The OPNET modeler v17.5 was utilised for simulation for this network. In this network, The Zigbee end devices were substituted as sensors and the Zigbee coordinator acted as the master node. In the set-up (in this study, it is office), there are four Zigbee end nodes used, which are the sensors, responsible for collecting data in the form of physical parameters from the stimuli. The ZigBee coordinator furnishes control over all the nodes and their respective data.
In our study, we have suggested four scenarios, for each of which, performance analysis would be made by varying the number of end nodes and/or coordinators in different cases.
1) Scenario 1: A total of eight sensors (end nodes) are controlled by a single coordinator. Four sensors each constitute a office. So, two office set-ups are connected with a single coordinator. In this scenario, the data from these eight sensors are the input to the coordinator.
2) Scenario 2: The eight sensors are now grouped into two, each group having four sensors. Each group of four sensors each constitutes an office set-up. One coordinator is assigned to each group of four sensors. So, four sensors are controlled by one coordinator and hence there are two coordinators for two office set-ups in this scenario.
Figure.12 (scenario_2)
3) Scenario 3: Four office set-ups, each having four sensors as its constituent, are controlled by a single coordinator. So, data from these sixteen sensorsact as input to single coordinator.
4) Scenario 4: In this scenario, we have assigned four separate coordinators to the four separate office set-ups. The data from each office, constituting four sensors, are controlled by a single coordinator. The same pattern repeats for all the four offices.
Figure.14 (scenario_4)
VI. RESULTS AND DISCUSSIONS
We implemented four scenarios using OPNET modeler. The results were generated for six parameters in each scenario- Delay, Throughput, Load, Data Traffic Sent, Data Traffic Received, Data Dropped
A comparison was drawn between scenarios one -two and scenarios three-four depending upon the number of offices, coordinators and sensors. [1] Additional ciphering was done in order to observe the effects on the performance of the system by increasing the master nodes. The major parameters analysed include delay, throughput, load, data dropped, data traffic sent and received. The duration of the simulations lasted up to 2000seconds.
The results are explained below-
A. Scenario 1 And Scenario 2 1) Delay
Figure.15 Delay (seconds)
0 0.005 0.01 0.015
0 500 1000 1500 2000 2500 3000 3500 4000
D
e
la
y
Time
Delay
zigbee_network_1-scenario1-DES-1: ZigBee 802_15_4 MAC.Delay (sec)
Comparing the delay of the two scenarios, one with one coordinator and the other with two coordinators (with the same number of nodes =4). The delay is increased with increasing the number of coordinators for the same number of offices (and hence same number of end nodes). [9]
Hence, delay in scenario 2 increases while it is lower in case of scenario-1.
2) Throughput
Figure.16 Throughput (bps)
It is the rate of successful message delivery over a communication channel. This data may be delivered in any way, either via a physical link or any logical link. [6] It may also pass through any network node in our scenarios. It is usually measured in bits per seconds.
We observed that throughput increased when we increased the number of coordinators from one in scenario-1 to two in scenario-2. As throughput increases, the efficiency increases for any communication network. When we increase the coordinators from one to two, the probability of successful message delivery increases as now instead of delivering information for eight nodes, one coordinator is delivering information for four nodes only.
3) Load
Figure.17 Load (bps)
0 10000 20000 30000 40000 50000 60000
0 500 1000 1500 2000 2500 3000 3500 4000
Th
ro
u
gh
p
u
t(
b
it
s)
Time(sec.)
Throughput
zigbee_network_1-scenario1-DES-1: ZigBee 802_15_4 MAC.Throughput (bits/sec)
zigbee_network_1-scenario2-DES-1: ZigBee 802_15_4 MAC.Throughput (bits/sec)
0 500 1000 1500 2000 2500 3000 3500 4000
Lo
ad
(b
it
s)
Time(sec)
Load
zigbee_network_1-scenario1-DES-1: ZigBee 802_15_4 MAC.Load (bits/sec)
4) Data Dropped
Figure.18 Data dropped (bits/sec)
5) Data Traffic Received And Data Trffic Sent
Figure.19 Data traffic sent and Data traffic received (bits/sec)
B. Comparison Table Of Scenario 1 And Scenario 2
SCENARIO S
DELAY (sec.) LOAD (bits/sec.) THROUGHPU T (bits/sec.) DATA DROPPED (bits/sec.) DATA TRAFFIC SENT (bits/sec.) DATA TRAFFIC RECEIVED (bits/sec.) Max. Min. Max. Min. Max. Min. Max. Min. Max. Min. Max. Min.
Scenario -1 0.00685 72
0.0062 2585
10296 4656 10296 45556 72 0 11664 5331.5 556
93312 42213 6 Scenario -2 0.01421
15
0.0124 164
21472 8705. 7778
59104 23105 .778 6447.5 556 2209. 5556 19093 .333 7703.7 778 103194 .67 42857 .778
In the above table, we observed that scenario-1 is more efficient as compared to scenario-2.
0 5000 10000
0 500 1000 1500 2000 2500 3000 3500 4000
D at a D ro p p ed (b it s) Time(sec.)
Data Dropped
zigbee_network_1-scenario1-DES-1: ZigBee 802_15_4 MAC.Data Dropped (Retry Threshold Exceeded) (bits/sec)
zigbee_network_1-scenario2-DES-1: ZigBee 802_15_4 MAC.Data Dropped (Retry Threshold Exceeded) (bits/sec)
0 100000 200000
0 500 1000 1500 2000 2500 3000 3500 4000
D at a tr af fi c se n t an d r e ce ive d (b it s) Time(sec.)
Data traffic sent and data trafffic received
zigbee_network_1-scenario1-DES-1: ZigBee 802_15_4 MAC.Data Traffic Rcvd (bits/sec)
zigbee_network_1-scenario2-DES-1: ZigBee 802_15_4 MAC.Data Traffic Rcvd (bits/sec)
zigbee_network_1-scenario1-DES-1: ZigBee 802_15_4 MAC.Data Traffic Sent (bits/sec)
C. Scenario- 3 And Scenario-4 1) Delay
Figure.20 Delay (seconds)
2) Load
Load increases by increasing number of nodes. The coordinator in case 3, is responsible for eight nodes, which is higher as compared to scenario-4, where eight nodes are handled by one coordinator and eight others, by the second one.
The load on the coordinator increases by increases by increasing the number of nodes for which it s responsible. Hence, the load is more for scenario 3- four offices under one coordinator, while the load decreases in scenario-4- two offices under one coordinator and two under the other.[7]
Figure.21 Load (bits/sec)
0 0.001 0.002 0.003 0.004 0.005 0.006 0.007
0 500 1000 1500 2000 2500 3000 3500 4000
D
el
ay
Time(sec.)
Delay
zigbee_network_1-scenario3-DES-1: ZigBee 802_15_4 MAC.Delay (sec)
zigbee_network_1-scenario4-DES-1: ZigBee 802_15_4 MAC.Delay (sec)
0 5000 10000 15000 20000 25000
0 500 1000 1500 2000 2500 3000 3500 4000
Lo
ad
(b
it
s)
Time(sec.)
LOAD
zigbee_network_1-scenario3-DES-1: ZigBee 802_15_4 MAC.Load (bits/sec)
3) Throughput
Figure.22 Throughput (bits)
4) Data Dropped
Figure.23 Data Dropped (bits/sec.)
The Data Dropped is the data quality transmitted correctly starting from the source to destination within a specified time(seconds). Increasing the number of coordinators, decreases the data dropped and hence increases the efficiency. Higher layer traffic (in bits/seconds) dropped by the 802.15.4 MAC due to consistently failing retransmissions.
Data drop is zero => highly efficient network design, in the case of scenario-4.
0 5000 10000 15000 20000 25000
0 500 1000 1500 2000 2500 3000 3500 4000
Th
ro
u
gh
p
u
t(
b
it
s)
Time(sec.)
THROUGHPUT
zigbee_network_1-scenario3-DES-1: ZigBee 802_15_4 MAC.Throughput (bits/sec)
zigbee_network_1-scenario4-DES-1: ZigBee 802_15_4 MAC.Throughput (bits/sec)
0 5 10 15 20 25 30 35
0 500 1000 1500 2000 2500 3000 3500 4000
D
at
a
D
ro
p
p
ed
Time(sec.)
DATA DROPPED
zigbee_network_1-scenario3-DES-1: ZigBee 802_15_4 MAC.Data Dropped (Retry Threshold Exceeded) (bits/sec)
5) Data Traffic Sent And Data Traffic Received
Figure.24 Data traffic sent and data traffic received (bits/sec.)
Network traffic or data traffic is the amount of data moving across a network at a given point of time.
We observed that the data traffic, both sent and received, is lesser in scenario-4, i.e., with increasing number of nodes and coordinators as well, the data traffic sent or received is effectively reduced.
D. Comparison table of Scenario 3- Scenario 4
SCENARIO S
DELAY (sec.) LOAD (bits/sec.) THROUGHPU T (bits/sec.) DATA DROPPED (bits/sec.) DATA TRAFFIC SENT (bits/sec.) DATA TRAFFIC RECEIVED (bits/sec.) Max. Min. Max. Min. Max. Min. Max. Min. Max. Min. Max. Min.
Scenario -3 0.00650 92
0.0059 782
19448 8803. 5556
19448 8803.5 56
72 0 22032 10087. 111
352512 159180 .44 Scenario -4 0.00625
61
0.0049 633
5720 2702. 2222
5751. 7778
2670.4 444
0 0 6480 3175.1
111
104256 48012. 444
In this table, we observe that Scenario-4 is more efficient as compared to scenario-1. On increasing the number of nodes and employing separate coordinators for each group of four nodes, i.e., four coordinators for four offices, reduces the delay, load, throughput, data drop and the data traffic. Hence, the organization as per scenario-4 or in other words, the network design as per network-4 is more efficient from the two.[8]
0 50000 100000 150000 200000 250000 300000 350000 400000
0 500 1000 1500 2000 2500 3000 3500 4000
D at a tr af fi c se n t an d r e ce ive d (b it s) Time(sec.)
Data traffic sent and data traffic received
zigbee_network_1-scenario3-DES-1: ZigBee 802_15_4 MAC.Data Traffic Rcvd (bits/sec)
zigbee_network_1-scenario4-DES-1: ZigBee 802_15_4 MAC.Data Traffic Rcvd (bits/sec)
zigbee_network_1-scenario3-DES-1: ZigBee 802_15_4 MAC.Data Traffic Sent (bits/sec)
VII. CONCLUSION
Comaprison Table For Scenario1, Scenario 2, Scenario 3, Scenario 4- SCENARIO
S
DELAY (sec.) LOAD (bits/sec.) THROUGHPU T (bits/sec.) DATA DROPPED (bits/sec.) DATA TRAFFIC SENT (bits/sec.) DATA TRAFFIC RECEIVED (bits/sec.) Max. Min. Max. Min. Max. Min. Max. Min. Max. Min. Max. Min.
Scenario -1 0.006857 2
0.0062 2585
10296 4656 10296 45556 72 0 11664 5331.5 556
93312 42213 6 Scenario -2 0.014211
5
0.0124 164
21472 8705.7 778
59104 23105. 778 6447.55 56 2209.5 556 19093 .333 7703.7 778 103194 .67 42857. 778 Scenario-3 0.006509
2
0.0059 782
19448 8803.5 556
19448 8803.5 56
72 0 22032 10087.
111
352512 15918 0.44 Scenario-4 0.006256
1
0.0049 633
5720 2702.2 222
5751.7 778
2670.4 444
0 0 6480 3175.1
111
104256 48012. 444
Overall, from the comparison table for the four scenarios, we found that the scenario-4, four offices with four nodes each and employed separate coordinators (total= 4 in number) forms the most efficient network design in terms of delay, load, throughput, data drop (zero, highly efficient) and data traffic.
A general conclusion can also be drawn that increasing the number of nodes, make the system more efficient, both in terms of end nodes and master nodes.
REFERENCES
[1] Mihajlov, B., & Bogdanoski, M. (2011). Overview and analysis of the performances of Zigbee-based wireless sensor networks. International Journal of Computer Applications, 29(12), 28-35.
[2] Mahajan, R., Nair, S., & Bhopal, M. P. (2013). Performance Evaluation of Zigbee Protocol Using Opnet Modeler for Mine Safety 1.
[3] Hussain, N. A., & Yaseen, F. A. (2015). Performance Evaluation of Zigbee Routing Protocol under Various Conditions using OPNET Modeler. Performance Evaluation, 117(18).
[4] Nath, S. K., Aznabi, S., Islam, N. T., Faridi, A., & Qarony, W. (2017). Investigation and performance analysis of some implemented features of the ZigBee protocol and IEEE 802.15. 4 Mac specification. International Journal of Online Engineering (iJOE), 13(01), 14-32.
[5] Byun, J., Jeon, B., Noh, J., Kim, Y., & Park, S. (2012). An intelligent self-adjusting sensor for smart home services based on ZigBee communications. IEEE Transactions on Consumer Electronics, 58(3).
[6] Suryadevara, N. K., Mukhopadhyay, S. C., Kelly, S. D. T., & Gill, S. P. S. (2015). WSN-based smart sensors and actuator for power management in intelligent buildings. IEEE/ASME transactions on mechatronics, 20(2), 564-571.
[7] Hammoodi, I. S., Stewart, B. G., Kocian, A., & McMeekin, S. G. (2009, September). A comprehensive performance study of OPNET modeler for ZigBee wireless sensor networks. In 2009 Third International Conference on Next Generation Mobile Applications, Services and Technologies (pp. 357-362). IEEE.
[8] Yi, P., Iwayemi, A., & Zhou, C. (2011). Developing ZigBee deployment guideline under WiFi interference for smart grid applications. IEEE transactions on smart grid, 2(1), 110-120.
[9] Shuaib, K., Boulmalf, M., Sallabi, F., & Lakas, A. A. L. A. (2006, April). Co-existence of Zigbee and WLAN, a performance study. In Wireless Telecommunications Symposium, 2006. WTS'06 (pp. 1-6). IEEE.