Cooperating Agents for 3-D
Scientific Data Interpretation
Randall J. Gallimore, Nick R. Jennings,
Member, IEEE, Harmeet S. Lamba, Cindy L. Mason, and Bernard J. Orenstein
Abstract—Many organizations collect vast quantities of
three-dimensional (3-D) scientific data in volumetric form for a range of purposes, including resource exploration, market forecasting, and process modeling. Traditionally, these data have been interpreted by human experts with only minimal software assistance. How-ever, such manual interpretation is a painstakingly slow and te-dious process. Moreover, since interpretation involves subjective judgments and each interpreter has different scientific knowledge and experience, formulation of an effective interpretation often requires the cooperation of numerous such experts. Hence, there is a pressing need for a software system in which individual interpretations can be generated automatically and then refined through the use of cooperative reasoning and information shar-ing. To this end, a prototype system, SurfaceMapper, has been developed in which a community of cooperating software agents automatically locate and display interpretations in a volume of 3-D scientific data. The challenges and experiences in designing and building such a system are discussed. Particular emphasis is given to the agents’ interactions and an empirical evaluation of the effectiveness of different cooperation strategies is presented.
Index Terms—Cooperative problem solving, intelligent agents,
multiagent systems, scientific data interpretation.
I. INTRODUCTION
M
ANY ORGANIZATIONS collect massive volumes of scientific data in volumetric forms for a range of pur-poses, including exploration, market forecasting, and process modeling. These data sets are typically of the order of gi-gabytes, although in some cases they may be terabytes. The storage, processing, and interpretation of such large volumes of data is a major challenge. Indeed, it is not uncommon for large historical data sets to lie unexamined simply because there are insufficient resources available to process them. However, since the data sets may contain valuable information that could lead to major opportunities, many organizations are investi-gating the use of advanced information processing techniques for this domain. Here, we report on our experiences with the application of one such technique—cooperating agents—to a real-world problem faced by The Broken Hill ProprietaryManuscript received October 29, 1997; revised March 3, 1998. This work was supported by the Advanced Computing Applications Project (ACAP) at BHP Research, Newcastle Laboratories, Australia.
R. J. Gallimore, H. S. Lamba, and B. J. Orenstein are with BHP Research, Newcastle Laboratories, NSW 2287 Wallsend, Australia (e-mail: [email protected]; [email protected]; [email protected]).
N. R. Jennings is with the Department of Electronic Engineering, Queen Mary and Westfield College, University of London, E1 4NS London, U.K. (e-mail: [email protected]).
C. L. Mason is with the Department of Electrical Engineering and Computer Science, University of California, Berkeley, CA 94720 USA (e-mail: [email protected]).
Publisher Item Identifier S 1094-6977(99)00093-0.
Company (BHP) [1] in the area of interpreting large volumes of three-dimensional (3-D) scientific data.
In our application, interpretation of 3-D scientific data requires the identification of the number, size, location, and orientation of 3-D surface features in a data volume. The inter-pretation process is a complex information processing activity that has a significant subjective component. Each expert has an area of specialization and many years of experience that are brought to bear in forming an interpretation. Nevertheless, different experts often arrive at different interpretations of the same data set (because they may have different levels of experience or skill bases). These differences in interpretation may dictate different follow-up actions that, in turn, could have widely varying financial implications. For this reason, domain experts often collaborate with one another to compare their interpretation hypotheses. This collaboration involves each expert forming their preliminary 3-D surface interpretation hypotheses in isolation and then discussing them with their peers. Through this sharing of initial hypotheses, the experts refine their interpretations: they create and delete surfaces; modify the size, shape, location, and orientation of surfaces; and then amend their interpretation confidence ratings. In some cases, this sharing of results brings the experts closer to a consensus; whereas in other cases, the experts continue to hold significantly different opinions.
The sheer size of the data sets and the amount of inter-action required between domain experts means that manual interpretation is a painstakingly slow, tedious, and expensive process. Typical times to interpret a number of surfaces within a gigabyte of data are of the order of a week. Owing to the complexity of the interpretation task, there is also no guarantee of the completeness or accuracy of the manual interpretations. Therefore, support for automated interpretation is clearly desirable. At the time of writing, there are only a few commercial software tools that can assist domain experts in the formation of interpretations (e.g., AVS [2], Iris Explorer [3], and Khoros [4]). However, these tools have limited flexibility, require significant input and direction from the user, and do not support collaboration between the experts. Several research prototypes exist, however, none of them tackle the particular domain in which we are interested.
Given the limitations of the currently available software tools, it was decided to develop an automated interpretation system (named SurfaceMapper) to act as a decision support tool to the domain experts. Practical experience from the domain indicated that the system should not take the form of a single software methodology or technique. Many organizations
have tried solutions founded on single techniques—including statistical methods (e.g., histogram measures, principle com-ponents analysis, clustering), image analysis (e.g., Hough transform, texture analysis), pattern recognition (e.g., Kalman filter, F-K filter), expert systems (e.g., applying high-level knowledge on low-level features extracted from the data set), neural networks (e.g., recognizing and classifying patterns in a data set), and fuzzy logic (e.g., recognizing patterns in noisy data using imprecise and uncertain knowledge)—and have come to the conclusion that there is no broadly applicable best method or technique. Each one has its relative strengths and weaknesses. Some can only produce an approximate solution, but do so comparatively quickly; others are more accurate, but relatively slow. Furthermore, a given technique’s performance is often dependent on the nature of the data set (some work well with noisy data, others do not; some work well with data that has a high signal strength, others work comparatively better with a low signal strength). To complicate matters still further, it is often impossible to determine a priori which technique is the most appropriate for a given volume or a given portion of a volume. Hence, the system needs to be responsive to its problem solving context. Having identified the most promising areas of the data, it must dynamically select the technique that is best suited to the characteristics of that data (i.e., the data analysis system as a whole needs to be context sensitive or situation-based).
To overcome the problems associated with selecting a single technique, some organizations have constructed tools that al-low multiple methods to coexist. However, such tools typically place a significant burden on the user. For each technique, the user is expected to know its (aforementioned) problem solving characteristics, be able to judge when, where, and how to apply it, and to determine how best to integrate and fuse the results it produces. To circumvent these problems, our approach is to provide a wide range of uncoupled base techniques and to allow the software system to determine at run-time which of them are appropriate in which circumstances. Moreover, the interchange and cross checking that goes on between the techniques (currently, through the domain experts) should be directly supported at the software level since it is such an integral part of the interpretation process in this domain.
When taken together, the requirements for multiple inter-pretation techniques to cooperatively interwork and situation-based selection and execution of the different interpretation techniques mean that a multiagent approach is the most natural means of modeling and implementing the system. For our purposes, a multiagent system is one in which the key abstraction used is that of cooperating agents. By an agent, we mean an encapsulated software entity that exhibits the following characteristics [5].
• Autonomy: Operates without the direct intervention of humans or other agents and has control over its actions and internal state.
• Responsiveness: Perceives its environment (which may be the physical world, a user, a collection of agents, etc.) and responds in a timely fashion to changes that occur in it. • Proactiveness: Does not simply act in response to its
environment, but exhibits opportunistic, goal-directed
be-havior and takes the initiative where appropriate. • Social ability: Interacts, when it deems appropriate, with
other agents to complete its own problem solving and to help others with their activities.
Given this perspective, each interpretation technique can be seen to be an autonomous software agent that cooperates and coordinates, as necessary, with other interpretation technique agents to try and converge to a community-wide solution. However, in many cases, the agents are simply unable to achieve consensus because the interpretations of the individual agents vary significantly. This is especially true when the data set is noisy. Thus, cooperation can be viewed as providing the opportunity for the agents to converge. However failure to converge does not mean that SurfaceMapper’s output is useless—in fact, it mirrors the situation of the disagreeing human interpreters. In this latter case, multiple opinions enable the human expert to experiment with a number of what-if follow-up scenarios (calculating costs and likely revenue generation) based on a range of plausible interpretations.
The cooperating agents approach offers a number of ad-vantages over the single solution technique and the multiple coexisting techniques approaches described earlier. First, in-terpretations can be made more reliable through the automatic cross checking of results. Second, early solutions can be presented to the domain expert (through selection of quick approximate techniques), and these can then be incrementally refined for as long as is deemed necessary (as the more accurate but time-consuming techniques produce their results). This means the overall system has an anytime capability [6]. Finally, cooperation provides the opportunity to achieve a genuine improvement in the quality of the interpretations. Presently, there are a number of interpretation algorithms that give good results but which cannot be used because they examine the data in minute detail (and hence are simply too computationally expensive for large data volumes). However, if these techniques are seeded with results provided by compu-tationally cheaper techniques, the reduced search space means that they become applicable and can be used in promising, but narrow, regions of the data volume.
This paper makes contributions in two distinct areas. First, it describes a novel approach to designing and building 3-D scientific data interpretation systems. We are aware of no other system that performs automated surface interpretations from 3-D scientific data. Thus, the insights and experiences gained in this work may enable other researchers faced with similar problems to assess whether an automated approach is appro-priate for them and, if so, whether cooperating agents represent a good solution technology. Second, this paper advances the state-of-the-art in multiagent systems: it provides an indication of the types of cooperation that occur in an important class of real-world applications, it offers an empirical quantification of the benefits of cooperative problem solving, and it indicates how agent systems can be designed to cope with vast quantities of data.
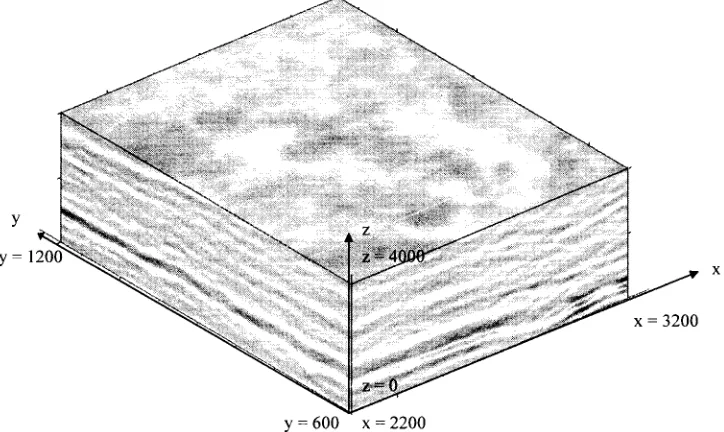
Fig. 1. Three-dimensional scientific data volume.
Section IV explains the architecture of the individual agents. Section V details the various cooperative scenarios present in SurfaceMapper. Section VI offers a quantitative assessment of the benefits of cooperative problem solving. Section VII discusses related work to place this research in context. Finally, Section VIII presents our conclusions and highlights areas of further investigation.
II. DOMAINTERMS AND CONCEPTS
This section provides an introduction to the terms and concepts of 3-D scientific data interpretation. Our 3-D sci-entific data set may be pictured as a volume consisting of 1000 600 4000 3-D voxels (Fig. 1). This data set is typical of volumetric data sets that are obtained by remote-sensing techniques. With such techniques, sensors are located outside of the control volume and information relevant to the inside of the volume is inferred from the sensed signals. Often, these data sets do not have perceived characteristics or boundary conditions and so the ensuing interpretation may not be definitive.
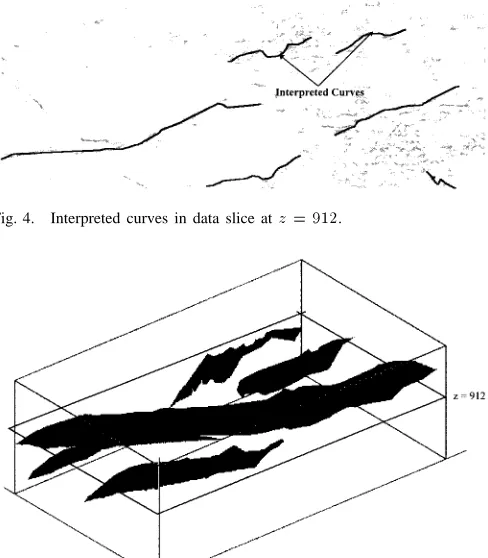
A two-dimensional (2-D) cross section through this volume (Fig. 2) is called a slice. An interpretation may be made for a specific slice of the data or for the entire volume. On a particular 2-D slice, the features of interest are piecewise linear segments (henceforth called segments) and connected curves (henceforth called curves). Segments represent edges or lines of varying clarity identified by individual or multiple analytical techniques within a single slice. In the 3-D volume, the features of interest are the interpreted surfaces (henceforth called surfaces).
[image:3.612.311.554.324.477.2]The objective of SurfaceMapper is to identify as accurately as it can the relevant surfaces in the data volume. A relevant surface is one that satisfies certain typical domain character-istics, such as minimum size, expected orientation, expected shape, etc. To achieve this objective in an automated system,
Fig. 2. Specific data slice through the 3-D volume atz = 912.
Fig. 3. Interpreted segments in data slice atz = 912.
[image:3.612.312.555.509.662.2]Fig. 4. Interpreted curves in data slice atz = 912.
Fig. 5. Interpreted surfaces in the 3-D volume.
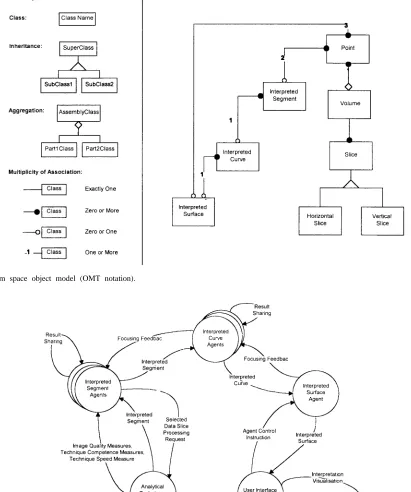
To capture these domain concepts more formally, an object modeling technique (OMT) [7] problem space object model was constructed. As shown in Fig. 6, a surface is an association of one or more curves and a curve is an association of one or more segments. Each segment is a piecewise linear approximation formed through the association of two or more points. A volume is an aggregation of many points. Many slices are associated with a volume, and a slice may be horizontal (parallel to the plane in Fig. 1) or vertical (perpendicular to the plane in Fig. 1).
III. SYSTEM ARCHITECTURE
Good software engineering principles recommend a modular design [8]. A system should be decomposed into highly cohesive subsystems (ones that fit together well) with low coupling (few interconnections and dependencies) between them. This design philosophy reduces system complexity, facilitates modification and maintenance, and encourages par-allel development of the individual subsystems. Following these basic principles, SurfaceMapper was divided into four subsystems: the scientific data subsystem (Section III-A), the analytical techniques subsystem (Section III-B), the agents subsystem (Section III-C), and the user interface subsystem (Section III-D).
SurfaceMapper’s design achieves high cohesion and low coupling through a partitioning into logical subsystems with
simple interfaces between them (Fig. 7). The scientific data subsystem abstracts all data-specific details (e.g., data formats, dynamic range details, and floating point to integer conver-sions) and provides access to any specified slice of data. The analytical techniques subsystem provides access to segments extracted from a specified data slice, while abstracting the algorithmic details. The agents subsystem uses cooperative reasoning to associate segments into curves and curves into surfaces. It also passes these interpretations to the user in-terface subsystem. All end-user interaction and visualization responsibilities are handled by the user interface subsystem. This subsystem displays the final interpretations to the user, presents a view of the system’s ongoing operation, and allows testing and debugging operations to be performed.
This system design is typical of the class of distributed prob-lem solving (DPS) applications—multiple agents cooperate by dividing and sharing knowledge about a common problem and about its solution [9]. DPS systems are generally recognized as having three phases, as follows:
1) task decomposition and assignment; 2) solution of the individual subtasks; 3) synthesis of results.
However, the relative importance of each phase varies among applications. In SurfaceMapper’s case, decomposition and assignment are carried out at design time (as indicated by Fig. 7) and the solution and synthesis phases predominate at run-time. In order to solve their individual subproblems and synthesize their results, SurfaceMapper’s agents exchange what they consider to be useful and relevant information with one another. That is, they exhibit a result sharing form of cooperation [10]. This shared information is used by the recipient to alter its confidences in its interpretation hypotheses or to focus its problem solving in promising regions of the search space.
A. Scientific Data Subsystem
The scientific data subsystem provides access to all data slices in the volume. For our purposes, these slices repre-sent the raw data from which the interpretations are made. The slices vary in two aspects. First, they can be horizon-tal, vertical, or oblique slices through the volume. Second, they can be gathered using a number of different techniques (e.g., acoustic, electromagnetic, gravitational). These different types of data provide complementary representations of the same 3-D volume.
Specialized algorithms are required to process the different data types and to make interpretations of slices in varying orientations. In the current version of SurfaceMapper, only algorithms for processing horizontal slices have currently been implemented and only one data type (acoustic) is currently supported. However, further algorithms that operate on vertical slices and/or on multiple data types can be added without changing the basic system architecture.
B. Analytical Techniques Subsystem
[image:4.612.47.291.113.392.2]Fig. 6. Problem space object model (OMT notation).
Fig. 7. SurfaceMapper system architecture.
from the data slices available in the scientific data subsystem. These algorithms are proprietary developments that are loosely based on line detection algorithms with derivative edge masks [11], [12]. The algorithms vary in the time taken to produce a solution and the quality of the solution produced. Some algorithms give quick approximate solutions, while others give more accurate solutions but require significantly longer computation time.
(i.e., those that have a high ratio for the shortest distance between their end points and their actual curvilinear length) from a low noise1 data section (mutatis mutandis for low
quality).
C. Agents Subsystem
Like many data interpretation processes [13], the task of interpreting 3-D scientific data can be described in terms of a signal to symbol transformation, in which raw data are transformed into a high-level concept by following a natural data abstraction hierarchy. As described in Section II, in this application, surface interpretations are produced from curve interpretations that, in turn, are produced from segment interpretations that are seeded by basic segments (and their initial ratings) formed in the analytical techniques subsystem. Given this nomenclature, it was decided that the most natural means of partitioning SurfaceMapper’s agent subsystem is according to these three levels of data abstraction: surfaces, curves, and segments. Each partition, or agency, is composed of a number of concurrently operating agents, each possessing complimentary expertise or perspectives. The control structure within an agency is that of a committee of peers with no central authority. Communication of interpretations occurs both within an agency (Section C1) and between agencies (Section III-C2), and although individual agents strive for agreement, it is by no means a solution requirement (see Section I).
In general, SurfaceMapper agents strive to provide inde-pendently derived interpretations. However, where it enhances their problem solving performance—either by increasing their confidence in their interpretation or by directing their search to promising regions of the data volume—they exploit hypothe-ses generated by other agents. This structure and mode of operation offers three main advantages in this domain. First, it provides composability—the ability to plug-in or remove various interpretation techniques (formulated as agents) as new algorithms are developed. Second, it provides algorithm opportunism—the ability to dynamically select interpretations from the agents whose approach yields the best solution. Recall that this is important since it is impossible to deter-mine at design time which of the techniques (agents) in an agency can provide the best (most reasonable) interpretation for any particular data instance. Finally, it allows solution multiplicity—the ability to present the domain expert with a number of reasonable interpretations. The presence of multiple interpretations is in itself an important message to the user, and it allows a number of follow up scenarios to be investigated. We refer to SurfaceMapper’s intra-agency distributed prob-lem solving paradigm as functionally independent/cooperative (FI/C) after Lesser’s functionally accurate/cooperative (FA/C) [9] paradigm (refer to Section VII for a more detailed dis-cussion and comparison of the two approaches). Functionally independent describes the situation in which agents build independent, nonconvergent solutions though the exchange of partial solutions that may be inaccurate or inconsistent, and cooperative describes an iterative exchange of heuristics that can guide an agent’s independent search for a solution. The
1An entropy measure is used to estimate a data slice’s noise content.
overall effect of SurfaceMapper’s FI/C approach is that an agency as a whole can dynamically exploit the most suitable techniques for a particular data instance—reflecting the fact that no single technique is superior to all others in all cases.
In the remainder of this section, we describe each of the three agencies in terms of their roles in the system and how they are realized, and their interagency and intra-agency interactions.
The interpreted segment agency is responsible for exploiting the services of the analytical techniques subsystem to produce interpreted segments for any desired slice. The most promising segments are then provided to the curve agency in a proactive or reactive manner. Essentially, the segment agents are intelli-gent wrappers [14], [15] around the analytical data processing techniques (each technique being associated with precisely one agent). What the agents add to the processing undertaken by the analytical techniques is the ability to filter and rank promising segments generated by the analytical techniques subsystem. They do this by exploiting a set of simple domain-dependent heuristics. For example, an agent will have high confidence in both low curvature segments that come from a low noise area and medium-length segments. Very short segments are typical of small isolated noise patches (see the top right-hand corner of Fig. 2 and the corresponding short segments in Fig. 3). Very long segments are typical of a dense collection of noise patches (see the lower right-hand corner of Fig. 2 and the segments extracted from that area in Fig. 3).
To develop preliminary hypotheses about the most promi-nent segments in the volume, a segment agent identifies those slices that have low noise content. This is done by computing the entropy of each slice and selecting those slices that have the lowest value. The segment agent then asks its associated analytical technique to process these slices. This provides a se-ries of slice interpretations containing the identified segments along with an indication of their perceived quality. Depending on the quality and quantity of segments received, the segment agent may chose to modify the operating parameters of the analytical algorithm to make it generate segments that are of more appropriate length, of higher confidence, or of greater linearity. To increase its confidence in an interpretation of a particular slice, a segment agent may examine the neighboring data slices (above and below). This is because surfaces in this domain have a predominantly vertical orientation, which means that similar segments are likely to occur on successive horizontal slices. If a match is found between segments on neighboring data slices, the agent increases its confidence in its interpretation of that slice. The intra-agency interactions center on requests/exchanges of segment interpretation hypotheses to improve the quality of the solutions produced by the individual agents. Agents increase the confidence of those interpretation hypotheses that agree with hypotheses sent by their peers.
The interpreted curve agency is responsible for constructing curves by associating related segments within slices.2The most promising curves are then provided to the surface agency in
2The cross section of a surface on a data slice appears as a series of
a reactive and/or proactive manner. A curve agent typically receives a large number of disconnected segments for a number of different data slices from one or more segment agents. Some of these segments will be part of a surface, while others will be artifacts caused by noise. To reject and remove the noise artifacts, the curve agents employ a number of domain specific heuristics. For example, a segment is considered more likely to be spurious if the following occurs:
1) it has been given a relatively low confidence by the interpreted segment agency;
2) it is a short segment that has no collinear relationship with any other segment;
3) there are no similar segments identified in the neighbor-ing data slices.
Having filtered spurious segments, a curve agent forms curves from segments that have similar orientation angles (say within 10 of each other) and have endpoints that are close to each other (say within ten pixels of each other). The confidence of this curve hypothesis is determined from the average confidence of the constituent segments and on the number of matching curves (i.e., curves with similar length, location, and orientation) generated by relevant hint resources. For a curve agent processing a data slice , a hint resource may be any one of the following:
1) neighboring data slice above or below , processed by the same curve agent ;
2) same data slice processed by a peer agent; 3) neighboring data slice processed by a peer agent. The operational semantics of this broad pattern of behavior vary between curve agents that, allied with the fact that they are working with different segment interpretations, means the curve interpretations can vary significantly. For this reason, curve agents share curve interpretation hypotheses (as dis-cussed above for segment agents) to try and reach a consensus. As before, failure to converge on this level simply means that there is more than one plausible interpretation of the data volume.
The interpreted surface agency is responsible for construct-ing 3-D surfaces by associatconstruct-ing related curves across multiple slices. The agent forms a surface where it finds a series of similar curves in successive data slices. Hence, curves that come from neighboring data slices (say, within five slices of each other) and that have similar location and orientation are associated together to form a surface. The confidence of this surface hypothesis is computed by averaging the confidence of each curve in the surface. In the current version of SurfaceMapper, there is a single surface agent. This agent computes surfaces in one of two ways: 1) based on a single curve agent’s output or 2) by fusing together the curves produced by multiple curve agents. The decision regarding which approach to use is determined either by the surface agent itself or by the domain expert. In the former case, the decision is based on the surface agent’s model of the curve agents. If all curve agents are considered equally competent for the data set being processed then option 2) is exercised, else option 1) is exercised and the agent chooses what it considers to be the most competent agent. Interpreter direction occurs
when the domain expert wishes to experiment with numerous what-if surface interpretation scenarios. This is akin to asking multiple human interpreters and receiving different opinions. The presence of a single surface agent simplifies the interface between the agent subsystem and the user interface subsystem (i.e., it has low coupling) because it channels all interactions between them through a single point of contact.
1) Intra-Agency Interactions: Agents in all of the agen-cies conform to the same basic model of problem solving behavior. Each agent uses its unique problem solving exper-tise (e.g., about producing segments, curves, or surfaces) to produce an independent opinion or theory about the solution to the interpretation task at hand. In so doing, the agent may exploit information it has generated about interpretations from neighboring data slices (as explained above). The agent’s theory consists of a ranked list of hypotheses about the likely interpretation of the data being processed. This ranking process is different for each agency and is described above.
It is up to the agent consuming an agency’s results to choose whether and how best to combine the differing opinions. In the case of SurfaceMapper, this fusion takes place both within the curve and the surface agencies. When a curve agent receives segments from more than one segment agent, it computes its own confidence value for each segment. This value is based on the curve agent’s assessment of the competence of the agent that provided the segment (stored in the curve agent’s acquaintance model) as well as the segment agent’s own confidence in its interpretation. At this point, the curve agent has a collection of segments, together with its rating of their confidence levels, from multiple segment agents. For segments that are similar (i.e., endpoints within ten pixels and angles within 10 of each other) the interpretations are merged and the confidence rating of the segment is raised accordingly (since it has been identified by more than one agent). For segments that are identified by only one agent, the confidence value is left unchanged. Having merged all similar segments, the curve agent now has a collection of segments, all of which are dissimilar. These unique segments are, where appropriate, associated into curves. Similarly, when a surface agent receives curves from more than one curve agent, it modifies the confidence of the curve interpretation based on its perception of the competence of the curve agent that supplied it, merges the similar curves, and then forms surfaces from these curves.
2) Interagency Interactions: As the agencies are arranged in an interpretation abstraction hierarchy, interagency inter-action is an inevitability. This structure was chosen because there are numerous ways in which the data at one level can be used at the neighboring levels. To exploit this fact, SurfaceMapper’s structure provides each higher level agent with a choice of results from a pool of resources each with different characteristics and properties. However, if the system is to operate effectively, these interactions need to be coordinated to ensure there is an appropriate flow of information and that this flow occurs in a timely and ordered fashion.
In this context, there are two primary forms of result sharing: 1) result feedforward in which information flows from the lower to the higher level agencies and 2) focusing feedback in which information flows from the higher to the lower levels. An example of the former is where a segment agent passes valid high-quality segments to a curve agent. An example of the latter is where a curve agent, having formulated some preliminary hypotheses, requests more (possibly lower quality) segments from the segment agent. The objective of such a request may be to try and extend an existing curve so this curve is provided to constrain the area in which the segment agent’s search should take place. More details of both types of interaction are given in Section V.
D. User Interface Subsystem
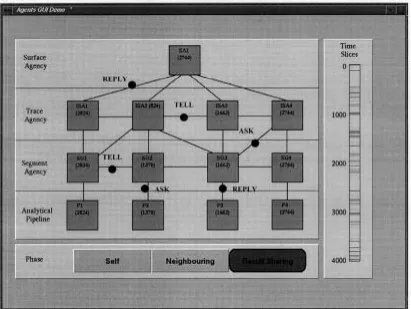
The user interface subsystem has two distinct roles: vi-sualization and end user (domain expert) interaction. The visualization component shows the operation of the system. It can be used for development and debugging purposes, as
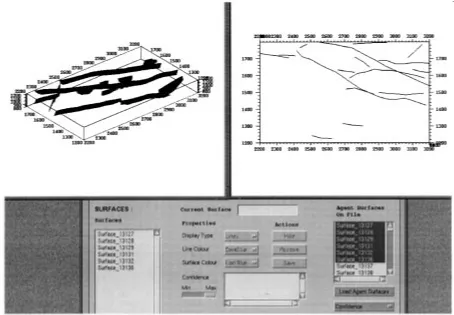
well as for indicating the way SurfaceMapper is working to the domain expert when the system is in operation (Fig. 8). It displays the state of individual agents (bottom bar), the messaging between them (on the links between the agents), and the parts of the data volume currently being processed (bar on right-hand side). The precise level of visualization can be set according to the particular context (e.g., the display of au-tomatic interpretations and intermediate results can be toggled on and off depending on the amount of detail required). The user interaction component displays the system’s interpretation of the data set to the domain expert (Fig. 9). The user can turn individual interpretations on or off (bottom window), view the interpretations in 2-D (right-hand window) or in 3-D (left-hand window), zoom in or out as desired, and rotate the volume to obtain the best view.
IV. AGENT ARCHITECTURE
All SurfaceMapper agents have the same architecture. This architecture is a belief-desire-intention (BDI) architecture [18], [19] and is characterized by having the mentalistic notions of beliefs (what the agent knows about its environment), desires (states the agent wishes to achieve), and intentions (selected courses of action) at its core. Such an architecture was chosen because it has a proven track record of working effectively in a range of complex applications—including air traffic control [20], process control [21], simulation [22], fault diagnosis [23], and transportation [24]. The specific BDI implementation used in this work is dMARS [25] (Fig. 10).
Each dMARS agent has a set of desires, goals, beliefs, plans, and intentions. It receives percepts from its operating environment and performs actions to affect its environment. Agents use messages to communicate and share results with one another. SurfaceMapper uses the following speech-act-based [26], [27] primitives for intra-agency- and interagency-based interactions: ASK(to request information from another agent—used for initiating demand-driven result sharing and focusing feedback), REPLY(to respond to anASKmessage), andTELL(to volunteer information to another agent—used for initiating data-driven result sharing and result feedforward).
Fig. 8. System architecture visualization view.
the agent can satisfy, it has an associated set of plans (stored in a plan library) that, when invoked, may achieve the desired objective. For instance, one plan may allow the agent to form curves from segments collected from an interpreted segment agent, another plan may allow the agent to form curves with the aid of hints collected from one of its peers, while yet another may allow the agent to form curves with the aid of hints collected from neighboring data slices. Once an agent decides to run a plan to try to satisfy a goal, a corresponding intention is created. This intention persists until the agent believes the intention cannot succeed, until it is no longer deemed appropriate (for whatever reason), or until it is satisfied [28]. When an intention finishes (either by succeeding or by failing), the agent’s goals and beliefs are updated.
An agent responds to events, which may either be messages received from other agents or goals established from within its own plans. The occurrence of an event results in the invocation of one or more plans to deal with it. Which plans get invoked is determined by the agent’s interpreter and is based on the type of events that the plan responds to and the beliefs that the agent must have for the plan to be applicable under the present circumstances.
V. COOPERATION SCENARIOS
SurfaceMapper uses three types of result sharing coop-eration: result feedforward, intra-agency result sharing, and result feedback (Section III-C). In feedforward mode, an agent
passes its results to an agent in the next higher agency. For example, a segment agent may pass the validated segments from a particular data slice to a curve agent. With intra-agency result sharing, an agent passes its results to a peer. For example, a curve agent may pass its curve hypotheses to a peer agent to assist the peer in refining its hypotheses. In feedback mode, an agent passes its results to an agent in the next lower agency. For example, a curve agent may pass its curve results to a segment agent to help the segment agent focus its validation criteria in the region close to indicated curve results.
In all cases, cooperation may be initiated by an agent volunteering information it believes to be relevant to its acquaintances or by an agent making an explicit request for the information it needs. When an agent has high confidence hypotheses, it may voluntarily choose to forward these results to other agents. Hence, a curve agent that has just found a curve with very high confidence would send this curve to its peers to assist them in their search for curves (intra-agency result sharing), to a segment agent to allow it to find valid segments in the neighborhood of the identified curve (result feedback), and to the surface agent to allow it to form surfaces from high confidence curves (result feedforward). In other cases, an agent may request hypotheses about a specific level of interpretation from another agent to gather input to enable it to start processing or to refine its current hypotheses.
Fig. 9. Two-dimensional and 3-D views of the surface interpretations.
Fig. 10. dMARS agent architecture.
1) Cooperation Between Segment Agents: Two segment agents may apply different validation criteria on seg-ments extracted by two different analytical algorithms from the same data slice. Having applied their individual criteria, each agent has its own hypotheses on the likely segments in the data slice. These agents may then exchange their hypotheses (voluntarily for high confidence hypotheses, and on-demand otherwise), to help each individual refine their hypotheses based on
the observations of their peers. For instance, if segment agent A volunteers information about a high confidence segment (SA) in a location close to segment (SB) found by segment agent B, then B will increase its confidence in SB by an amount proportional to A’s confidence in SA.
2) Cooperation Between the Segment Agents and the Curve Agents: A curve agent may ask a segment agent to produce and send it segments from a particular data slice. The curve agent then associates those segments that are related into curves. Also, if a curve agent forms some high confidence hypotheses about curves in a particular data slice, it may provide them to a segment agent as focusing feedback. The segment agent could use the hypotheses it receives as an indication of regions of the data where it is likely to find segments. Given this focus, the segment agent can perform a more detailed analysis of the identified area than would ordinarily be possible because of the search’s limited scope and high likelihood of success.
[image:10.612.46.293.409.606.2]typically loosen its algorithmic parameters (e.g., use lower confidence segments that are further apart) to try and construct a curve in the identified region. If B is able to achieve this, SurfaceMapper’s overall confidence in the interpretation in this region is increased.
4) Cooperation Between the Curve Agents and the Surface Agent: The surface agent may ask a curve agent to provide curves from a particular set of data slices or, alternatively, a curve agent may voluntarily send high confidence hypotheses to the surface agent. In either case, the surface agent associates approximately collinear curves into a surface. The surface agent may also reject those curves that have little association with other curves and suppress those surfaces that have very few curves (because in this domain, a surface extends through many data slices and should hence contain many curves).
VI. EVALUATION
Having described SurfaceMapper’s design rationale and im-plementation, the next step is to evaluate its operational effec-tiveness. This evaluation consists of two principal components. First, a measure of the system’s proficiency at the domain interpretation task. Second, a measure of the effectiveness of the cooperating agents metaphor as the basis for constructing useful interpretation systems. The former indicates whether automated interpretation of large volumes of 3-D scientific data is both feasible and useful. The latter indicates whether a cross-correlating, pluralistic approach yields better results than any of the constituent components working in isolation (i.e., “the whole is greater than the sum of its parts”) or whether the complementary approaches reduce system performance to the lowest common denominator (i.e., “too many cooks spoil the broth”).
To assess the quality of SurfaceMapper’s interpretations, its outputs can be compared against manual interpretations pro-duced by a domain expert. However, owing to the complexity of the interpretation task, it should be noted that there is no guarantee of the completeness or accuracy of the manual in-terpretations. Thus, significant surfaces may have been missed and some of the identified surfaces may be inaccurate. This means that agreement of automatic and manual interpretations can only be used as an approximate check of SurfaceMapper’s performance, rather than an absolute measure.
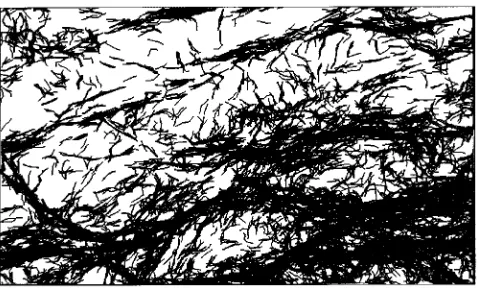
[image:11.612.314.553.61.202.2]We begin our evaluation by presenting a qualitative (visual) comparison of manual interpretations produced by domain experts with the automatic interpretations generated by Sur-faceMapper. To this end, Fig. 11 shows the plan view of all manual interpretations in a representative data volume. The interpreted surfaces have a predominantly vertical orientation and hence look like thick lines in plan view. SurfaceMapper’s output for the same volume is shown in Fig. 12. As can be seen, there is a strong level of agreement between the two interpretations—most of the major surfaces have been identified by SurfaceMapper. By way of contrast, Fig. 13 illustrates the best interpretation of the same volume produced by any analytical technique working in isolation. Careful
[image:11.612.307.555.244.393.2]Fig. 11. Manual interpretation in plan view.
Fig. 12. SurfaceMapper’s interpretation in plan view.
Fig. 13. Analytical technique’s interpretation in plan view.
examination of this output reveals that many of the manually identified surfaces are indeed present. However, the signal to noise ratio is considerably worse.
[image:11.612.313.552.435.579.2]Fig. 14. Effect on precision of adding domain knowledge, exploitation of neighboring data slices, and intra-agency result sharing.
if corresponding pixels are sufficiently close to one another (within ten pixels) and have a similar orientation (within 10 ). The slice is composed of 600 000 (600 1000) pixels. In this example, the manual interpretations occupy 1200 pixels while SurfaceMapper’s interpretations occupy 1000 pixels. Of Sur-faceMapper’s 1000 points, 800 agree (as it is defined above) with the manual interpretation meaning that the precision is 80%. SurfaceMapper’s remaining 200 have no analog in the manual interpretation. SurfaceMapper’s coverage in this case is 67%—it identifies 800 of the 1200 manual pixels. The analytical technique, on the other hand, achieves a coverage of 75% (which is greater than SurfaceMapper because false positives are not penalized) and a precision of 56%—its results occupy 1600 pixels, of which 900 agree with the manual interpretations and 700 do not. Feedback received from a number of domain experts indicates that this level of performance makes SurfaceMapper a worthwhile and usable decision support tool for interpretation tasks in this domain.
To assess the usefulness of the cooperating agents metaphor, a series of experiments were undertaken to determine whether SurfaceMapper’s foundational hypotheses are valid in this domain:
Hypothesis 1: Result sharing between peer agents leads to higher quality solutions.
Hypothesis 2: Result sharing needs to be carefully managed so that agents are not needlessly distracted by the receipt of irrelevant hypotheses.
Hypothesis 3: Cross-checking hypotheses from multiple perspectives improves the result up to a point, but correlating too many opinions may give decreasing marginal returns and may, in some cases, even be detrimental.
In assessing the merits of cooperation, we concentrate on the change in precision brought about by intra-agency result sharing. The reason for this is that the degree of coverage is very much determined by the quality of the analytical
techniques (which do not cooperate with one another). Thus, although result sharing may lead to greater coverage in some situations, it is mainly the precision of the results that are affected (compare Figs. 12 and 13 for an illustration of this point). The intra-agency case is used (as opposed to result feedforward or feedback) since improvements solely due to cooperation can be clearly quantified.
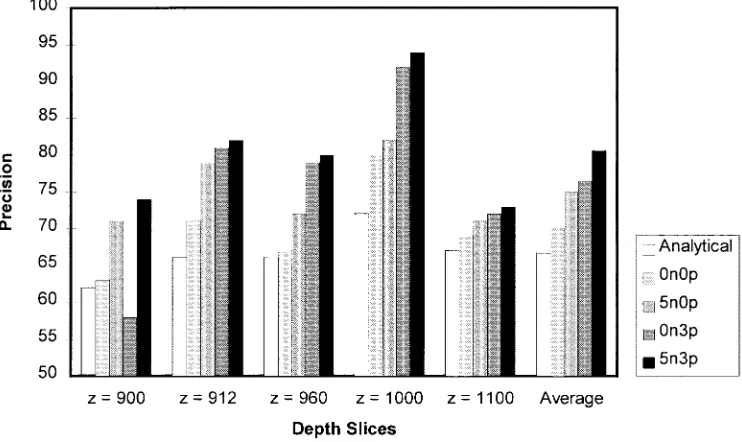
The first set of experiments seek to show that intra-agency result sharing is beneficial for the overall precision of the system (Hypothesis 1). To this end, five representative data slices were processed by a number of different configurations of SurfaceMapper (Fig. 14). The first column (analytical) in each data set shows the precision of the best analytical technique. The second column (0n0p) shows the precision when the curve agent uses its domain heuristics to moderate the results obtained from the segment agents. The third column (5n0p) corresponds to the precision when the agent uses hints from five neighboring data slices (above and below) in making its interpretation. This is a form of cross checking in that the agent uses the hypotheses of one data slice in interpreting another. However this correlation is asocial since it does not involve interagent interactions (only interaction within a curve agent). The fourth column (0n3p) shows the precision when an agent uses no hints from neighboring data slices, but it does obtain hints from three peer agents. Finally, the fifth column (5n3p) corresponds to the situation in which five neighboring data slices and three peer agents are used as hint resources.
Fig. 15. Effect on precision of cross correlating results for neighboring data slices and peer agents.
demonstrates the usefulness of result sharing in this domain and leads us to conclude that Hypothesis 1 holds. The best im-provement achieved by result sharing is for the time slice. In this case, result sharing provided the agent with peer hints that had very similar location and orientation to some of its own hypotheses. These reinforced hypotheses were found to be in strong agreement with manual interpretations, thus resulting in significant precision improvements. An exception to this general trend occurred for the data slice which performed significantly worse by sharing results with its peers. The reason for this deterioration is the confusion caused by the hints sent by the peer agents. The hints received from peers had little in common with each other and did not agree with the agent’s individual hypotheses. As a result, few hypotheses received a confidence boost, and those that did turned out to have little agreement with the manual interpretations. Together these factors caused the agent’s precision to decrease. In other words, the hints resulted in the agent downgrading the confidence of the hypotheses it produced when working in isolation. After the fact analysis, in fact, showed that these original hypotheses had a higher precision than the final ones. This observation highlights the need to carefully manage result sharing (Hypothesis 2). Indeed to stop this occurring, future versions of SurfaceMapper will allow the agents to update their acquaintance models so that they stop soliciting hints (and start ignoring unsolicited hints) from those peers that consistently confuse them either by providing little reinforcement for any of their existing hypotheses or by reinforcing their low confidence hypotheses. The highest precision is attained when the agents cross correlate both asocially (with neighboring data slices) and socially (with their peers). This takes the average precision up from 70%, when no cross correlation occurs, to 81%.
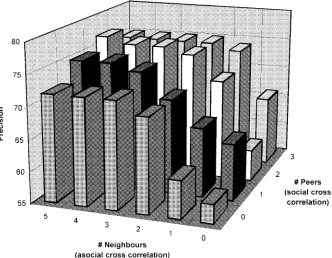
To investigate the effect of cross checking (both socially and asocially) in a more systematic manner, Fig. 15 shows the effect on precision of varying the number of peers with which result sharing takes place and the number of neighboring data slices that are considered when making an interpretation. The results show that, in general, significant improvements in precision are attained by fairly minimal forms of cross correlation (sharing with one or two peers or with one or two neighboring slices).3However, once an agent has performed a
reasonable amount of cross correlation (say, three neighboring slices or two/three peers) further cross checking produces little additional precision improvement. In fact, too much cross checking can cause distraction and confusion (Hypothesis 3). This can be observed by the fact that sharing results with three peers gives lower precision than sharing with two peers when the number of neighboring data slices taken into consideration is three or more.
Having ascertained that, in general, result sharing and cross correlation improve precision, the next step is to show that this improvement can be achieved at an acceptable cost. This is important in practical applications since such activities are not free—they consume communication bandwidth (as hypotheses are transferred) and processing time (since the agents have to work with considerably more data). To be effective, the agents have to be aware of the tradeoff between the precision of their results and the costs in terms of increased resource utilization. To study this phenomenon, we devised a
cost-3An exception to this is for the two peers, no neighbors case. Here sharing
Fig. 16. Cost benefit curve for cross correlating results.
adjusted precision metric that subtracts the cost4of producing the result from the precision obtained by that amount of processing. As expected, Fig. 16 shows that the value of cross correlation (both social and asocial) decreases as the number of hint resources become large (Hypothesis 3). The figure shows that there is no predefined number of hint resources that can be considered optimal. Agents 1 and 2 achieve their highest cost-adjusted precision when they use only four hint resources, while agents 2 and 3 achieve their highest performance when they use 12 hint resources. Ideally, an agent should stop cross checking when the relative improvements in precision become small. However, since an agent has no absolute measure of the precision of its results, it cannot determine whether the precision is increasing or decreasing. Hence, SurfaceMapper agents stop asking for hints when cross correlation ceases to produce significant changes in their hypotheses. As Fig. 16 also shows, the cost adjusted precision of all the agents starts degrading by the time they use 16 hint resources. Hence, this number is used as an absolute upper bound for terminating the cross-correlation process.
VII. RELATED WORK
There are a number of interpretation systems (for domains other than 3-D scientific data) based on the concept of co-operating agents, and these are compared and contrasted with SurfaceMapper in this section. The broad issues on which such systems can be compared include the way in which they per-form their problem decomposition, their subproblem solution, and their solution synthesis, as well as in how they apply their domain knowledge. Differences on each of these dimensions are intimately tied to the design chosen for intra-agency, interagency, and internal agent problem solving behavior.
Pioneering work in distributed interpretation system design was performed by Lesser and Erman for the task of speech understanding, HEARSAY-II [29], and by Lesser and Corkill
4Cost, in this context, is the processing time taken to produce the result and
is measured in seconds. Time was chosen because it dominates communication overheads as the main resource consumed in this domain.
for the task of vehicle monitoring, DMVT [9], [30]. In both of these applications, the presence of overlapping, redundant sensing data forced a decomposition in which the subproblem solution phase and the synthesis phase required consistency. When coupled with the fact that the knowledge for interpreting the sensed data in each agent was identical, it can be seen that redundant solutions were of no particular value and were, therefore, viewed as wasted computation. Also, only singular solutions were required in both applications—multiple competing solutions had to be avoided and suppressed since they were not useful to the end user. For these reasons, both HEARSAY-II and DVMT paid considerable attention to the problem of avoiding redundancy since sharing redundant subproblem solutions could increase the amount of search needed to reach a conclusion without adding any value. That is, it was considered globally incoherent system behavior. Given this view, both systems explored numerous problem decompositions and worked to limit needless search by using various methods for focus-of-control for limiting the amount of interagent communication. Such techniques included organiza-tional structuring (providing a high-level specification of how the multiagent system solves its problems and an indication of the role of each individual agent within this structure) and the exchange of metaplans (control level information about an agent’s current priorities and activities).
In general terms, the basic structure and operation of HEARSAY-II and DVMT can be described as functionally accurate, cooperative (FA/C) [9]. Functionally accurate refers to the notion that the agents converge on acceptable and accurate solutions although they may share inconsistent or inaccurate partial solutions. Cooperative describes an iterative coroutine interaction among agents in deriving solutions. The success of HEARSAY-II and DVMT demonstrates that the FA/C structure is a powerful paradigm for applications in which the following occurs:
2) multiplicity of subproblem solutions is viewed as re-dundant;
3) end users require presentation of a single solution. Subsequent work on distributed interpretation by Mason [31], in developing NETSEA (network seismic event ana-lyzer) for the domain of verifying nuclear testban treaties, defined an alternative, but related, system design paradigm. Unlike the speech understanding or the vehicle monitoring domains, in monitoring for treaty violations, there are multiple, nonoverlapping data streams. Moreover, each such stream requires distinct interpretation knowledge. As a result, the problem decomposition resulted in an agent that fully in-terpreted each data stream. Agents relied on communicated results as heuristics, and focus-of-control was accomplished using introspection since the human experts in the domain relied on qualitative data analysis methods. Instead of requiring convergence, an important feature of the system solution was to preserve differences of opinion among the agents since conflicts among monitoring reports were considered to be of great interest by the user. These requirements were clearly contrary to those assumed by the FA/C approach and so led to the identification of the FI/C problem solving structure (see Section III-C) in which the differences among the subproblem solutions (agents) are preserved and where there is no longer a demand to produce a singular consistent output from the solution synthesis phase.
The designs of SurfaceMapper and NETSEA differ from the FA/C solutions in that the structure of the domain in-volved subproblems that exhibited interdependency, rather than dependency. SurfaceMapper, HEARSAY-II, and DVMT all exhibit decompositions involving an overlap of sensed data—in SurfaceMapper, more than one agent in an agency may explore the same data slices. However, as with NETSEA, SurfaceMapper’s problem domain involves teamwork between data analysts possessing distinguishable knowledge and ex-pertise, and a solution in which the presence of disagreement provides valuable additional information for users who view the system as one of many tools in their much larger work process environment. Interestingly, both NETSEA and Sur-faceMapper were user-centered designs, inspired by naturally distributed problem solving systems. As such, their structure (FI/C) gives rise to the phenomena that by introducing more agents with different kinds of expertise, we increase the likelihood of finding “correct” or “more complete” solutions. This feature in some sense allows us to finesse the usual scaling and composability problems present in many man-made, complex distributed applications.
VIII. CONCLUSIONS AND FUTUREWORK
This paper has described the rationale, design, and imple-mentation of a multiagent system for interpreting 3-D scientific data in a real-world domain. To the best of our knowledge, SurfaceMapper represents the first system capable of perform-ing automated surface interpretation from 3-D scientific data. Feedback obtained from interpretation experts indicates that the level of performance attained by SurfaceMapper (both in terms of coverage and precision) is such that it is a valuable and usable decision support tool for this domain. Indeed, the
next phase of the project is targeted at putting SurfaceMapper into routine operational use within BHP.5
SurfaceMapper achieves its performance and flexibility by fully exploiting the cooperating agents metaphor and by using the FI/C mode of system operation. Cooperating agents pro-vide a very natural means of automating current best practice in manual interpretation and, as the empirical evaluation demonstrates, they offer very real benefits in terms of the quality of solutions that are produced. SurfaceMapper’s use of the FI/C paradigm is also natural given the subjective and uncertain nature of the interpretation task in this domain. Given its grounding in a real-world context, this work provides important practical insights into, and guidance for, theoretical research into both cooperative problem solving and FI/C sys-tems. Study of SurfaceMapper’s operation, supported by the empirical evaluation, highlights the fact that agents operating in such a manner need to carefully manage their interactions and their local reasoning so that they do not needlessly distract one another by sending irrelevant suggestions. Moreover, the empirical evaluation shows that agents need a means of tracking the benefits accrued from social interaction so that the resources they consume in this endeavor are commensurate with the improvement in performance that is achieved.
Careful examination of the requirements and behavior of SurfaceMapper’s problem solving components offers a strong justification for the choice of agents as the foundational system development paradigm. The components are autonomous in that they automatically filter data archives and report useful information without user intervention or guidance. They are responsive in that the selection and weighting of the different analytical approaches depends on the nature of the portion of the data volume being processed. They are proactive in that they spontaneously volunteer unsolicited advice to agents that they believe will benefit from receiving it. They are social in that they cooperate with one another to cross check their results and to indicate promising regions of the data that may be worth investigating in detail. In short, the components exhibit all of the characteristics of agenthood as it was defined in Section I. There are a number of issues that require further investiga-tion in the next phase of the project. First, a more compre-hensive suite of analytical techniques is required. Techniques that deal with vertical data slices and with data gathered using nonacoustic means are needed to cope with the range of data sets that can be encountered in this domain. Second, the agents should be able to adapt and learn from the social interactions they experience. Agents should be capable of learning which acquaintances give reliable results in which circumstances and then they should be able to adapt their selection and fusion techniques appropriately. Presently, this information is hardwired into the acquaintance models and into the agent’s problem solving plans. Finally, the agents would benefit from a more elaborate means of tracking the information they vol-unteer and receive during result sharing. Presently, an agent’s record of information shared is insufficient for it to be able to indicate to its acquaintances that it has significantly revised a hypothesis and that they should, therefore, roll-back any
lations they have performed based upon its preliminary result. Our present thoughts on this matter are that such interdepen-dencies may best be handled by incorporating a distributed truth maintenance system [32] into the agent architecture.
ACKNOWLEDGMENT
The authors wish to acknowledge the invaluable efforts of our team members: A. Ugray, T. Murnain, H. Lie, P. Gordon, P. Wall, K. Nesbitt, and L. Leung. They also wish to thank the Australian Artificial Intelligence Institute for providing excellent support for dMARS. Most importantly, thanks to P. Littlejohn (Corporate General Manager, Corporate Information Systems, BHP) and G. Ferguson (Chief Technologist, Corpo-rate Information Systems, BHP) for their support as program and project champions, respectively.
REFERENCES
[1] The Broken Hill Proprietary Company (BHP), http://www.bhp.com.au/. [2] Advanced Visual Systems, http://www.avs.com/.
[3] Iris Explorer, http://www.nag.co.uk/visual/ie/welcome.html. [4] Khoral Research, Inc., http://www.khoral.com.
[5] M. J. Wooldridge and N. R. Jennings, “Intelligent agents: Theory and practice,” Knowl. Eng. Rev., vol. 10, no. 2, pp. 115–152, 1995. [6] T. L. Dean and M. Boddy, “An analysis of time dependent planning,”
in Proc. AAAI, St. Paul, MN, 1988, pp. 49–54.
[7] J. Rumbaugh, M. Blaha, W. Premerlani, F. Eddy, and W. Lorensen, Object-Oriented Modeling and Design. Englewood Cliffs, NJ: Prentice-Hall, 1991.
[8] R. S. Pressman, Software Engineering—A Practitioner’s Approach. New York: McGraw-Hill, 1992.
[9] V. R. Lesser and D. D. Corkill, “Functionally accurate, cooperative distributed systems,” IEEE Trans. Syst., Man, Cybern., vol. SMC-11, pp. 81–96, Jan. 1981.
[10] R. G. Smith and R. Davis, “Frameworks for cooperation in distributed problem solving,” IEEE Trans. Syst., Man, Cybern., vol. SMC-11, pp. 61–70, Jan. 1981.
[11] R. C. Gonzalez and P. Wintz, Digital Image Processing. Reading, MA: Addison-Wesley, 1987.
[12] J. Russ, Computer Assisted Microscopy—The Measurement and Analysis of Images. New York: Plenum, 1992.
[13] J. Jagannathan, R. Dodhiawala, and S. Baum, Eds., Blackboard Archi-tectures and Applications. New York: Academic, 1989.
[14] M. R. Genesereth and S. P. Ketchpel, “Software agents,” Commun. ACM, vol. 37, no. 7, pp. 48–53, 1994.
[15] N. R. Jennings, L. Z. Varga, R. P. Aarnts, J. Fuchs, and P. Skarek, “Transforming standalone expert systems into a community of coop-erating agents,” Int. J. Eng. Applicat. AI, vol. 6, no. 4, pp. 317–331, 1993.
[16] G. Agha, ACTORS: A Model of Concurrent Computation in Distributed Systems. Cambridge, MA: MIT Press, 1986.
[17] N. R. Jennings, E. H. Mamdani, I. Laresgoiti, J. Perez, and J. Corera, “GRATE: A general framework for cooperative problem solving,” IEE-BCS J. Intell. Syst. Eng., vol. 1, no. 2, pp. 102–114, 1992.
[18] M. E. Bratman, D. J. Israel, and M. E. Pollack, “Plans and resource bounded practical reasoning,” Computat. Intell., vol. 4, pp. 349–355, 1988.
[19] M. P. Georgeff and A. L. Lansky, “Procedural knowledge,” Proc. IEEE Special Issue Knowl. Representation, vol. 74, pp. 1383–1398 Dec. 1986. [20] M. Ljunngberg and A. Lucas, “The OASIS air traffic management
system,” in Proc. 2nd Pacific Rim Conf. AI, Seoul, Korea, 1992. [21] N. R. Jennings, “Controlling cooperative problem solving in industrial
multi-agent systems,” Artif. Intell., vol. 75, no. 2, pp. 195–240, 1995. [22] A. S. Rao, D. Morley, M. Sekvestrel, and G. Murray, “Representation,
selection, and execution of team tactics in air combat modeling,” in Proc. 5th Australian Joint Conf. AI, 1992, pp. 185–190.
[23] F. F. Ingrand, M. P. Georgeff, and A. S. Rao, “An architecture for real time reasoning and system control,” IEEE Expert Mag., vol. 7, no. 6, 1992.
[24] B. Burmeister, A. Haddadi, and G. Matylis, “Application of multi-agent systems in traffic and transportation,” Proc. Inst. Elect. Eng., vol. 144, no. 1, pp. 51–60, 1997.
[25] M. P. Georgeff, Ed., “Distributed multi-agent reasoning systems (dMARS),” Australian Artif. Intell. Inst., Melbourne, Australia, Tech. Rep., 1994.
[26] J. L. Austin, How to do Things with Words. Oxford, U.K.: Oxford Univ. Press, 1962.
[27] J. R. Searle, Speech Acts: An Essay in the Philosophy of Language. Cambridge, U.K.: Cambridge Univ. Press, 1969.
[28] P. R. Cohen and H. J. Levesque, “Intention is choice with commitment,” Artif. Intell., vol. 42, pp. 213–261, 1990.
[29] V. R. Lesser and L. Erman, “Distributed interpretation: A model and experiment,” IEEE Trans. Comput., vol. C-29, pp. 1144–1163, Dec. 1980.
[30] V. R. Lesser and D. D. Corkill, “The distributed vehicle monitoring testbed: A tool for integrating distributed problem solving networks,” AI Mag., pp. 15–33, Fall 1983.
[31] C. L. Mason, “Cooperative seismic data interpretation for nuclear test ban treaty verification,” Int. J. Appl. AI, vol. 9, no. 4, pp. 371–400, 1995. [32] C. Mason and R. Johnson, “DATMS: A framework for distributed assumption based reasoning,” in Distributed Artificial Intelligence, vol. II, L. Gasser and M. Huhns, Eds. New York: Pitman, 1989, pp. 293–318.
Randall J. Gallimore received the B.S. degree
in computer science from Newcastle University, Australia, and metallurgy certificate from Newcastle Technical College, Australia.
He is Project Leader of the Advanced Computing Applications Project at BHP Research-Newcastle Laboratories, Wallsend, Australia. His career spans such diverse domains as pyrometallurgy, hydromet-allury, chemistry, electronics, and computing. The past decade has been focused on the development of advanced software systems in support of BHP operating divisions. His current research interests include scientific data visualization, knowledge-based systems, and real-time process control.
Mr. Gallimore is a member of the Australian Computer Society.
Nick R. Jennings (M’92) received the B.Sc. degree
in computer science from Exeter University and the Ph.D. degree from the University of London, London, U.K.
He is currently a Professor in the Department of Electronic Engineering, Queen Mary and Westfield (QMW) College, University of London, where he heads the Distributed AI Unit. He has a wide range of interests in both the theory and practice of multiagent systems. He has published more than 90 articles on various facets of agent-based computing, written one monograph, and coedited four books.
Prof. Jennings has been an invited Lecturer at numerous national and international conferences related to agent systems, has initiated and cochaired two major international conferences, the Practical Application of Agents and Multi-Agent Systems, (PAAM’96) and Autonomous Agents, (AA’97), and has initiated and cochaired the Agent Theories, Architectures, and Languages Workshop series. He is the Editor-in-Chief of the International Journal of Autonomous Agents and Multi-Agent Systems.
Harmeet S. Lamba received the B.S. degree in
computer science and the B.E. degree in computer engineering, both from Newcastle University, Aus-tralia.
He is a member of the Advanced Computing Ap-plications Project at BHP Research, Newcastle Lab-oratories, Wallsend, Australia. His research interests include intelligent software agents and knowledge-based systems.
Cindy L. Mason received the B.Sc. degree from
Purdue University, West Lafayette, IN, and the Ph.D. degree from University of California at Davis. She is an Assistant Research Engineer in the Electrical Engineering and Computer Science De-partment, University of California at Berkeley. Her interests in agents are primarily in the engineering and design of multiagent systems and voice-directed agents. She coordinates and teaches courses on agent-based computing to industry and has pub-lished numerous papers on agent-based computing. She has been a Research Fellow at Stanford University and NASA Ames Research Center.
Bernard J. Orenstein received a B.App.Sci. (Hons.
1) degree in computer science from the University of Technology, Sydney, Australia, in 1988 and a diploma of technical analysis in 1997.
He is a Contractor to the Advanced Computing Applications Project at BHP Research, Wallsend, Australia, where he was previously employed as a Research Scientist for nine years. His expertise lies in the field of object-oriented software engineering applied to complex engineering and business prob-lems. Through his Sydney-based company, Agents Pty. Limited, he currently specializes in the design and implementation of fully automated trading systems for the financial markets.