A study of the microstructural and mechanical properties
of novel spring steels.
HARRIS-POINTER, Cheryl Faye.
Available from Sheffield Hallam University Research Archive (SHURA) at: http://shura.shu.ac.uk/19763/
This document is the author deposited version. You are advised to consult the publisher's version if you wish to cite from it.
Published version
HARRIS-POINTER, Cheryl Faye. (1998). A study of the microstructural and
mechanical properties of novel spring steels. Doctoral, Sheffield Hallam University (United Kingdom)..
Copyright and re-use policy
See http://shura.shu.ac.uk/information.html
ProQuest Number: 10697065
All rights reserved
INFORMATION TO ALL USERS
The qua lity of this reproduction is d e p e n d e n t upon the qua lity of the copy subm itted.
In the unlikely e v e n t that the author did not send a c o m p le te m anuscript and there are missing pages, these will be noted. Also, if m aterial had to be rem oved,
a n o te will in d ica te the deletion.
uest
ProQuest 10697065
Published by ProQuest LLC(2017). C o pyright of the Dissertation is held by the Author.
All rights reserved.
This work is protected against unauthorized copying under Title 17, United States C o d e M icroform Edition © ProQuest LLC.
ProQuest LLC.
789 East Eisenhower Parkway P.O. Box 1346
A study of the microstructural and
mechanical properties of novel
spring steels
Cheryl Faye Harris-Pointer
A Thesis submitted in partial fulfilment of the requirements of
Sheffield Hallam University
for the degree of Doctor of Philosophy
April 1998
Acknowledgements
The author would like to sincerely thank the following people and collaborating establishments for their helpful discussions and advice during the period of
study:-• Dr J Cawley, and Prof. B Pickering, Materials Research Institute, Sheffield Hallam University.
• The Sponsor Company:- Pandrol International Ltd for funding this project.
• The staff at Pandrol International Ltd for their help and guidance, in particular Mr B Marshall, Mr R Larke, Mr P Hewlett, Mr I Presley and Mr A Williams.
• The staff of the materials research institute, in particular, Mr P. Slingsby, Mr T. Hudson. Ms C. Shaw, Dr I. Wadsworth, Dr B. Lewis and Mr S. Creasey.
• The staff of the School of Engineering at Sheffield Hallam University for their help in the preparation of test pieces.
• Mr S. Ryalls at Swindon Laboratories, Rotherham, for his help on cold rolling and plastic deformation of test pieces.
• Mr B Encliffe and Mr D Tame at Sheffield Testing Laboratories, Nursery St. Sheffield.
Abstract
This work is concerned with track spring components manufactured by Pandrol from a SiMn alloy in the quenched and tempered condition. For many years low to medium carbon based spring steel has been manufactured via an oil quench temper route producing components with suitable mechanical and microstructural properties. The current problem facing the spring manufacturer with the traditional heat treatment route involve a number of technical issues including a sensitivity to temper embrittlement and susceptibility to stress corrosion cracking. In addition, economic factors and component handling problems led Pandrol to seek solutions via the manufacturing process and materials selection.
A programme of research was therefore proposed to identify a possible replacement alloy system and production route which could exclude the costly tempering operation and instil a degree of production control.
The initial program of work involved the examination of several alloy systems based loosely around three separate microstructures, i.e. a fully pearlitic, bainitic and martensitic microstructure. In turn, each alloy was examined and assessed with respect to their suitability for the industrial application given their mechanical properties.
From the initial research, a selected number of promising alloy systems were examined further, namely a chromium molybdenum alloy, salt bath quenched to produce a bainitic microstructure, a water quenched low carbon chromium and low carbon boron martensitic type alloy. The low carbon boron alloy was considered the most promising, with similar mechanical properties in both the plain bar and clip form compared to the existing Pandrol alloy. However, concern was raised over the amount of plastic deformation (permanent set) suffered by a clip component whilst in service. In response to this, the use of cold work was examined to further strengthen the microstructure with notable success.
On identifying several possible alternative alloy systems to replace the existing oil quenched and tempered variant, the second stage of this research work concentrated on understanding the degree and type of microstructural strengthening involved on each particular alloy system. The effect of plastic deformation in each alloy type was also thoroughly investigated via transmission electron microscopy / true stress strain analysis and an attempt was made to relate microstructural changes to obtained mechanical properties. In addition the work hardening characteristics of the tempered microstructure were investigated, and compared to the straight through hardened variants.
Qualitative Transmission Electron Microscopy studies confirmed that dislocation density I mobility played a crucial role in determining the work hardening rate.
Further Studies
As part of the course of study, I attended the following conferences and workshops combined with a number of informal research seminars presented at Sheffield Hallam University by academic staff from the Materials Research Institute and the School of Engineering.
• Bainite and Accicular Ferrite. Conference held at Institute of Materials, Carton House Terrace, London, 14 December 1993.
• New Aspects of microstructures in modern low carbon high strength steels. Conference held at Tokyo University, Japan, (Japanese iron and Steel Institute) 29 Nov. to 1 December 1993.
• Quality steel - Advances in process technologies to meet customer requirements, SMEA conference, Sheffield University, 3-4 April 1995
• Post graduate course:- “Crystallography”, presented by Dr. J. Cawley, Materials Research Institute, (eight week course)
• Post graduate course:- “High strength steels”, presented by Dr. A Smith, School of Engineering, Sheffield Hallam University, (eight week course)
• Post graduate research course:- “Materials under load”, presented by Dr. A Fletcher, School of Engineering, Sheffield Hallam University, (eight week course).
• Post graduate research course:- “ Electron microscopy and diffraction techniques”, presented by Prof. J. Tichmarsh, Materials Research Institute, Sheffield Hallam University.
• Post graduate research meeting:- Fatigue failure investigations, presented by Prof. J. Atkinson.
• Excel, Microsoft word course, Sheffield Hallam University.
• Training:- Philips XL40 Scanning Electron Microscope, Materials Research Institute, Sheffield Hallam University, (P. Slingsby)
Contents
Preface. i
Acknowledgements. ii
Abstract. iii
Additional Studies. iv
Contents. v
Chapter 1 Introduction to spring steel, research aims and objectives. 1
1.1 Spring steel definitions and general property requirements. 1
1.2 Specific spring manufacturing : The Pandrol clip. 2
1.3 Spring steel manufacturing problems. 6
1.4 Research aims and Objectives. 6
1.5 Program of work. 7
1.5.1 Eutectoid microstructure. 8
1.5.2 Bainitic microstructure. 8
1.5.3 Martensitic microstructure. 9
1.5.4 Mixed martensite-bainite microstructure. 9
Chapter 2:-Eutectoid literature review. 11
2.1 Eutectoid microstructure. 11
2.1.1 Eutectoid transformation. 11
2.1.2 The effect of alloying additions on eutectoid transformation. 13 2.1.3 The effect of alloying elements on eutectoid transformation rate. 14 2.1.4 Effect of prior austenite grain size on eutectoid microstructure. 16
2.1.5 Strengthening mechanisms for eutectoid steels. 17
2.1.5.1 Grain size / pearlite colony size and morphology. 17
2.1.5.2 Microalloy additions. 18
2.1.6 Determination of optimum transformation temperature. 19
2.1.6.1 Determination of interlamellae spacing and distribution. 20
Chapter 3:-Bainite microstructure literature review. 23
3.1 The bainite transformation. 23
3.1.1 Bainite start temperature. 24
3.2 Bainite structure characterisation. 25
3.2.1 Upper bainite. 26
3.2.2.2 Precipitation between lower bainite ferrite platelets. 31
3.3 Transition temperature between upper and lower bainite. 31
3.4 Crystallography of bainite. 33
3.4.1 Bain region definition. 34
3.5 Crystallography of carbide precipitation in bainite. 35
3.5.1 Orientation relationship of cementite. 37
3.5.2 Orientation relationship of epsilon carbide. 38
3.5.3 Orientation relationship of eta carbide. 38
3.5.4 Orientation relationship of chi carbide. 39
3.6 Structure property relationships in the bainitic microstructure. 39
3.6.1 Hardness. 40
3.6.2 Proof strength. 40
3.6.3 Proof strength / ultimate tensile strength ratio. 43
3.6.4 Ductility. 43
3.6.5 Toughness. 45
3.7 Ideal chemistry and cooling procedure for bainite. 47
Chapter 4:-Martensitic microstructure literature review. 50
4.1 The martensitic transformation. 50
4.1.1 Lattice deformation or “Bain” strain. 51
4.1.2 Lattice invariant deformation. 52
4.1.3 Martensite start / finish temperature determination. 53
4.1.4 Auto tempered martensite formation. 56
4.1.5 Retained austenite formation. 56
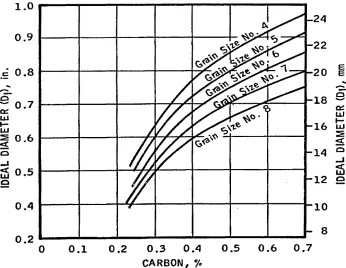
4.2 Hardenability assessment. 58
4.2.1 Definition and test methods. 58
4.2.2 The ideal critical / critical diameter. 58
4.2.3 Assessment of ideal critical diameter. 59
4.2.4 Boron and hardenability. 62
4.3 Crystallography of martensite. 64
4.4 Crystallography of carbides in martensite. 64
4.5 Strengthening of martensite. 65
4.6 Optimising mechanical properties. 66
4.6.1 Strength and stress corrosion cracking. 66
4.6.2 Quench cracking. 67
4.7 Temperng of martensite. 68
4.7.1 Stages of tempering. 69
Chapter 5:-Dislocation theory, strengthening mechanisms and stress strain modelling. 72
5.1 Introduction: dislocations and strength. 72
5.1.1 The dislocation. 72
5.1.2 Burgers vector and burgers circuit. 73
5.2 Movement of dislocations via slip. 75
5.2.1 Slip planes and directions in a bcc and fee lattice. 77
5.2.2 Perfect dislocation in the fee lattice. 80
5.2.3 Shockley partial dislocation in the fee lattice. 80
5.2.4 Dislocations in bcc lattice. 82
5.3 Movement of dislocations via twinning. 83
5.4 Nucleation of twins during deformation. 84
5.5 Strain (work) hardening. 85
5.5.1 Interstitial / substitution atom - dislocation interaction. 86
5.5.2 Precipitate - dislocation interactions. 88
5.5.3 Grain boundary - dislocation interactions. 91
5.5.4 Dislocation intersections and forests. 92
5.5.5 Dislocation reaction to form sessiles - bcc structures. 93
5.5.6 Dislocation multiplication. 94
5.5.6.1 Frank-Reed source. 94
5.5.6.2 Multiplication by multiple cross glide. 96
5.5.6.3 Grain boundary sources. 97
5.6 Strain hardening rate and exponent. 98
5.6.1 Determination of strain hardening rate from hardness. 100
5.7 The deformed microstructure. 101
5.7.1 Stored Energy in the deformed microstructure. 103
Chapter 6:-Experimental procedure. 104
6.1 Alloy selection procedure. 104
6.1.1 Precipitation strengthened eutectoid pearlite. 104
6.1.2 Air cooled bainitic microstructure. 105
6.1.3 Martensitic and martensite-bainite microstructure. 106
6.2 Thermal treatment. 106
6.2.1 Clip thermal treatment. 107
6.3 Mechanical treatments. 109
6.3.1 Strain hardening under the tensile test. 109
6.3.2 Strain hardening of the Pandrol clip. 110
6.3.2.1 Load deflection of the Pandrol clip. 110
6.3.3.1 Determination of minimum reduction per pass. 112
6.4 Hardness measurements. 113
6.5 Tensile testing. 114
6.5.1 Tensile testing of formed clip. 114
6.5.2 Tensile testing of bar and strip material. 115
6.6 Toe load testing of formed clip. 116
6.7 Fatigue testing of formed clip. 117
6.8 Charpy “V” notch impact testing. 118
6.9 Optical microscopy. 118
6.10 Scanning electron microscopy. 118
6.10.1 EDS digital line scanning. 119
6.11 Transmission electron microscopy. 120
6.11.1 Sample preparation. 120
6.11.2 Calculation of correct magnification and TEM camera constant. 121
6.11.3 Determination of image / diffraction pattern rotation. 124
6.11.4 Determination of orientation relationship. 125
6.12 X-ray diffraction technique for the assessment of retained austenite. 126
6.12.1 Sample preparation. 126
6.12.2 XRD- calculation of retained austenite. 127
Chapter 7:- Optimisation of alloy system. 129
7.1 Introduction. 129
7.2 Eutectoid alloy system results. 129
7.2.1 Normalised (continuously air cooled) pearlite results. 129
7.2.2 Isothermally treated pearlite results. 131
7.3 Bainitic alloy system results. 133
7.3.1 0.4% carbon bainite results. 133
7.3.2 0.48% carbon, 1% Cr Mo bainite alloy results. 136
7.4 Martensitic alloy system results. 139
7.4.1 Chromium/nickel alloy system results. 139
7.4.2 Boron martensite alloy system results. 142
7.5 Preliminary discussion:- Which alloy? 144
7.5.1 Unsuitable alloy systems. 144
7.5.2 Promising alloy systems. 145
7.5.2.1 1.25% Cr Mo bainitic alloy system. 145
7.5.2.2 Cr Ni martensite alloy system. 147
Chapter 8:-Clip results and additional mechanical results of boron alloy. 149
8.1 Tensile results of plain bar. 149
8.2 Tensile and impact properties of specimens from formed clip. 152
8.3 Toe load results from “virgin” clips. 154
8.3.1 Toe load results of work hardened clip. 155
8.4 Load deflection results of “virgin” clips. 156
8.4.1 Load deflection results of work hardened clips. 158
8.5 Microstructural results. 160
8.6 Fatigue results. 162
Chapter 9:-Microstructural evaluation of optimum alloy systems 164
9.1 Morphological studies of 1.25 Cr Mo alloy system. 164
9.1.1 Optical microscopy. 164
9.1.2 Segregation analysis results using scanning electron microscopy. 167
9.1.3 Transmission electron microscopy. 170
9.2 Morphological studies of 0.25% carbon 10.5% chromium alloy system. 178
9.2.1 Optical microscopy. 178
9.2.2 Transmission electron microscopy. 180
9.3 Morphological studies of 0.3% carbon boron alloy system. 189
9.3.1 Optical microscopy. 189
9.3.2 Transmission electron microscopy. 191
9.4 Morphological studies of 0.3% carbon boron alloy system tempered at 250°C. 197
9.4.1 Optical microscopy. 197
9.4.2 Transmission electron microscopy. 200
9.5 Morphological studies of 0.3% carbon boron alloy system tempered at 400°C. 207
9.5.1 Optical microscopy. 207
9.5.2 Transmission electron microscopy. 209
9.6 Precipitate size distribution and identification, 216
9.6.1 Precipitate size distribution. 216
Chapter 10:-Mechanical evaluation of optimum alloy systems. 219
10.1 Mechanical evaluation of 1.25 mass% Chromium molybdenum alloy system. 219
10.1.1 Tensile and hardness test results.. 219
10.1.2 Determination of work hardening during the tensile test.. 222 10.1.2.1 Work hardening rate from the gradient of the flow curve. 222
10.1.2.2 Work hardening rate from power law relationships. 223
10.1.3 Determination of strengthening from cold rolling procedure. 226 10.2 Mechanical evaluation of 0.5 mass% Chromium 0.25 mass% carbon alloy system. 229
10.2.1 Tensile and hardness test results. 229
10.2.1.1 Comparison of 0.2% proof strength and shape of flow curves. 231
10.2.2 Determination of work hardening during the tensile test. 232
10.2.3 Determination of strengthening from cold rolling procedure. 233 10.3 Mechanical evaluation of 0.3 mass% carbon, boron alloy system. 236
10.3.1 Tensile and hardness test results. 236
10.3.1.1 Comparison of 0.2% proof strength and shape of flow curves. 238
10.3.2 Determination of work hardening during the tensile test. 239
10.3.3 Determination of strengthening from cold rolling procedure. 241 10.4 Mechanical evaluation of 0.3 mass% carbon, boron alloy tempered at 250°C. 243
10.4.1 Tensile and hardness test results. 243
10.4.1.1 Comparison of 0.2% proof strength and shape of flow curves. 243
10.4.2 Determination of work hardening during the tensile test. 245
10.4.3 Determination of strengthening from cold rolling procedure. 247 10.5 Mechanical evaluation of 0.3 mass% carbon, boron alloy tempered at 400°C. 249
10.5.1 Tensile and hardness test results. 249
10.5.1.1 Comparison of 0.2% proof strength and shape of flow curves. 251
10.5.2 Determination of work hardening during the tensile test. 251
10.5.3 Determination of strengthening from cold rolling procedure. 253
10.6 Summary of mechanical results from optimum alloy systems. 255
10.6.1 True stress strain results (proof and ultimate tensile strength). 255
10.6.2 Hardness results summary and comparison. 261
10.6.3 Deformation strengthening from the cold rolling procedure. 263
Chapter 11:- Discussion.
11.1 Basic microstructural strengtheners in optimum alloy system. 269 11.2 Microstructural observations, mechanical property relationships. 281
11.2.1 The 1.25 mass% chromium molybdenum alloy. 281
11.2.2 The 0.5 mass% chromium 0.25 mass% carbon alloy. 293
11.2.3 The 0.3 mass% carbon boron alloy system. 301
11.2.4 The 0.3 mass% carbon boron alloy (tempered at 250°C) system. 309 11.2.5 The 0.3 mass% carbon boron alloy (tempered at 400°C) system. 316
11.3 Discussion Summary 323
Chapter 12:-Conclusions. 324
Appendix. 326
Chapter 1
Introduction to spring steel, research aims and objectives.
1.1 Spring steel definition and general property requirements
The ability of a material to absorb energy when deformed elastically and to return it when unloaded is called resilience (Dieter1). Certain types of steel that perform such a task are commonly referred to as spring steel, to which this research work is based upon.
The basic mechanical properties required for spring steel include a high tensile strength, coupled with a high proof to ultimate tensile strength ratio to facilitate a high modulus of resilience (Dieter1). A good fatigue strength is also essential, hence a certain amount of material toughness is also required. Additionally if the component is to be placed in an aggressive atmosphere, resistance to stress corrosion cracking is important. To meet this criteria, careful control of alloy chemistry and heat treatment regime is essential.
Traditionally medium carbon, silicon / manganese steels and more recently chromium containing steels have been employed to manufacture a wide range of springs from automotive leaf and coils to the railway track retaining clips which are pertinent to this work. These materials are used in the oil quenched and tempered condition ensuring adequate tensile, hardness and fatigue properties.
The strengthening by precipitation of alloy carbides of chromium, molybdenum, vanadium etc. often referred to as secondary hardening is also well known (Kuo4, Honeycombe and Seal5, Pickering6).
In order to reduce production costs, today’s spring manufacturer seeks to obtain the most competitively priced steel bar available. Often some of the steel stock will have been produced via the electric arc method where the charge consists of scrap metal. The Achilles heal in the use of a cheaper alloy source is from the continual rise in residuals (namely Cu, Sn Sb), thereby exasperating the temper embrittlement problem (Ritchie7, Low et. al.8).
One additional industrial practice used to impart some degree of strength into the spring was a process known as Scragging. This entailed incorporating a small amount of plastic deformation into the spring to raise the yield strength and proof to ultimate tensile strength ratio. Such a practice was believed to have been carried out at many spring manufacturers, although was not required at Pandrol, since the proof strength obtained was quite sufficient.
1.2 Specific spring manufacturing:- The Pandrol Clip.
A medium carbon, silicon manganese grade is currently used in the manufacture of the Pandrol spring clip, specified to a 251A58 grade (see table 1).
Table 1 Alloy chemistry used at Pandrol in the manufacture of railtrack clips
c Si Mn P/S Cr Mo Ni/Cu Sn
0.52-0.57 1.7-2.1 0.8-1.0 0.035 max 0.2-0.3 0.02-0.06 0.3 max 0.035 max
Figure 2:- The most recently developed fast clip
To produce a component with ideal mechanical properties utilising one of the given alloy systems, careful production control is essential. Figure 4 shows a typical production cycle for the Pandrol “e” type clip. The clip is austenitised to a critical temperature range where grain growth / hot working resistance is optimised. After an oil quench and temper treatment the microstructure consists of tempered martensite with ideal mechanical properties as noted in table 2.
Table 2: Summary of current material properties used at Pandrol
0.2% Proof
strength (MPa) Ultimate tensile strength (MPa) Elongation % Reduction in area % Charpy Impact(J)
[image:21.615.69.527.376.719.2]1250 1500 10-15 30-40 10-12
Figure 4:- The production route for Pandrol ‘e’ clip
Clip is air cooled and manually separated Clip is then tempered at
450- 460°C for 40 minutes
Bar austenitised at 1000°C in gas fired or induction furnace
Bar supplied ranging from 22 -12.5 mm form is checked in terms of
chemistry, roundness etc. then cropped to required length
Bar formed into “e” clip configuration and quenched into oil bath (maximum
1.3 Spring steel manufacture problems
During the past few years there has been a significant rise in clip manufacture from chromium containing steel. A major problem arises from the fact that such steels can contain large amounts of deleterious elements i.e. Sb, P, As, Sn from excessive recycling. This inexorable rise in residual alloy content draws the alloy system into the temper embrittlement regime. Additionally the silicon manganese grades are difficult to manufacture with respect to cleanness with the inevitable loss of toughness and fatigue life.
One further consideration is that the actual heat treatment procedure to produce the spring clip is expensive and not particularly environmentally friendly with the necessity for an oil quench. It has also become apparent that the temper operation means "loss of control" of the clip which has made the possibility of robotics control unrealisable. Alternatively a simple water quench or air cool route has the possibility of allowing full robotics control and hence a significant step forward in manufacturing production methods.
1.4 Research aims and objectives
The aims and objectives of the research work can be summarised as follows
• To develop microstructures which are resistant to temper embrittlement. • To establish novel cooling techniques to avoid the necessity for tempering. • To develop processes which can be implemented as industrial practice. • To avoid the environmental consequences of oil quenching.
• To reduce overall processing costs and use of energy.
The alloy systems investigated were based on a quenched lower carbon martensitic microstructure, a medium carbon chromium molybdenum bainitic microstructure, and a precipitation strengthened eutectoid pearlitic microstructure. Additionally the role of work hardening was considered as a means of increasing the overall strength of the material. This process has been used in the spring industry for some time (scragging) even though it is generally accepted that body centred cubic metals do not appreciably work harden.
In order to fully utilise the application of cold work to increase alloy strength, first it was necessary to gain an understanding of the microstructural changes that took place during cold work as well as the influence of additional strengthening mechanisms such as precipitates and grain boundaries. Changes in microstructure can then be related to deformation amounts, chemistry and thermal treatments, which in turn are intimately related to mechanical properties. Fundamental alloy aims and objectives are summarised as follows.
• To assess the influence of cold work on a range of microstructures. • To assess the influence of additional strengthening mechanisms. • To identify and relate microstructure to mechanical properties.
• Describe the stress strain behaviour in terms of documented models.
• Understand the correlation between industrial requirements and laboratory results.
1.5 Program of work
Mechanical property evaluation included hardness and stress strain measurement, with comparisons of the plastic stress strain behaviour between tested alloy systems and existing models detailed in the literature. Microstructure was identified utilising optical and electron microscopy.
A summary of the program of work is given in figure 5. A detailed program of research on each microstructure is given in the following sub-sections.
1.5.1 Eutectoid microstructure
The eutectoid alloy system chemistry was carefully controlled to generate strengthening from fine grain size and precipitates. The cooling regime was also controlled to facilitate the formation of fine pearlite lamella structure. The microstructure together with mechanical properties were examined to assess their suitability for the industrial application.
1.5.2 Bainitic microstructure
From an extensive literature review of continuous cooling transformation diagrams it was possible to determine the chemistry required to produce a bainitic microstructure over a relatively wide range of air cooling regimes. Upper, lower or a mixed bainitic microstructure was formed depending on the cooling rates employed, with microstructure identified by optical and electron microscopy. The mechanical strength of the lower bainite structure was found to come close to industrial requirements, with additional strengthening observed after cold work. Hence a detailed investigation was carried out to assess the effect of cold work on a lower bainite microstructure and to relate this to obtained mechanical properties.
1.5.3 Martensitic microstructure
After a simple water quench from austenitisation at 950°C, and small amounts of cold work the boron alloy systems possess a martensitic microstructure with mechanical properties superior to the oil quenched and tempered microstructure. The program of work therefore included the assessment of work hardening as a means of further strengthening the martensite structure, especially since there appears to be little reference to this in the literature for b.c.c structures. Since the carbon content of this alloy system was quite low hence martensite start temperature (Ms) quite high, it was expected that auto tempered carbides would form. The effect of carbides on the overall strength and work hardening characteristics was then investigated further by creating a series of tempered alloy systems. The mechanical properties and microstructure of auto tempered, and “manually” tempered alloys in the work hardened and unworked condition were assessed. Additionally, because the water quenched boron martensite alloy properties were comparable to industrial requirements, a series of Pandrol “e” clips were made using the production route of straight water quench. The cold work (scragging) operation was also included as a means of increasing the strength of the product further, the amount of work required was determined from a series of clip tensile results.
1.5.4 Mixed martensite - bainite microstructure
Figure 5:- Program of research
Alloy matrix determined
Boron alloys with 0.2 and 0.3% carbon developed
Eutectoid alloy chemistry based on strengthening
mechanisms
Chromium and nickel alloys with
0.2 and 0.25% carbon developed
Austenitised at 950°C furnace cooled to 550, 600
and 650°C Bainite alloy chemistry based
on CCT diagrams
Austenitised at 950°C continuously air cooled in a controlled air tunnel
High carbon bainite alloy cold deformed
in the salt bath quenched condition
1 % Cr Mo developed with 0.35 and 0.45 %
carbon added
Clips manufactured at
Pandrol using water quenched
boron alloy
Property evaluation found
material unsuitable for Clip
application Austenitised at 950°C quenched
into water at 15 - 20°C
Alloys retreated by quenching into salt at 550, 600 and 650°C to control cooling rate
0.75, 0.8 and 0.85% carbon alloys developed with
strengthening additives
0.3% carbon boron alloy cold deformed in the
tempered condition (250 and
400°C)
0.25% C, 0.5% Cr alloy cold deformed to improve mechanical strength 0.3% carbon
boron alloy cold deformed in the untempered condition Clip evaluation included charpy impact, tensile strength hardness, toe load
and fatigue
Martensite al oy optimise chemistry based on
hardenability
High carboifvariant salt bath quenched to control cooling rate and
maintain bainite start temperature
Preliminary evaluation include microstructure, hardness, charpy impact and tensile strength
Chapter 2
Eutectoid microstructure: Literature Review
2.1 Eutectoid Microstructure
2.1.1 Eutectoid transformation
Figure 6 shows the iron carbon equilibrium diagram, at high temperatures, for example 900°C and at low carbon concentrations, the microstructure consists of a single phase, known as austenite (y). This phase is a solid solution of
carbon in a face centred cubic iron lattice, and on moderate cooling the austenite decomposes into ferrite and cementite phases, ferrite being the body centred cubic allotropic form of iron which has very restricted solubility for carbon. The resultant ambient temperature microstructure is dependant on the carbon content of the steel and quench rate (Honeycombe9).
Figure 6:- The iron carbon equilibrium diagram
1700 1600 1534 1500 1400 1390 1300 cz <D
j5 1200<5
<u o_
£ 1100
4.25/ 2.03
1147°C
/ / 2.06 4.30
1000 910 °C 900 0.69 / 800 738 °C 0.80
700 - 0.02 723 “C
600 500
2.1.2 The effect of alloying additions on eutectoid transformation
Additions of alloying elements influence both the eutectoid reaction temperature and the eutectoid composition with respect to carbon (Rayson12). Elements such as manganese and nickel lower the eutectoid temperature and also decrease the carbon content of the eutectoid composition. In contrast, a molybdenum content greater than 4 wt.% increases the eutectoid temperature and the carbon content of the eutectoid composition (Bain and Paxton13), In slowly cooled hypoeutectoid steels the proportions of ferrite and pearlite will therefore be changed by the presence of alloying elements such as manganese or chromium, both which would increase the proportion of pearlite(Gladman11).
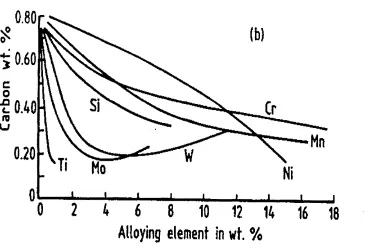
The effects of alloys on these changes have been summarised by Bain and Paxton13 and are illustrated in figures 7a and 7b.
Figure 7a:- The effect of alloying elements on the eutectoid temperature (Bain and Paxton131961)
1300
Titanium
Molybdenium
1200
C 1100
Tungsten
Chromium
Ts 1000
I 900 Silicon
-o 800
at
700
Manganese
600 Nickel
Figure 7b:- The effect of alloying elements on the eutectoid composition (Bain and Paxton131961)
0.80
0N
i
0.60 c 1 0.40rau
Alloying element in wt. %
2.1.3 Effect of alloying elements on eutectoid transformation rate
Figure 8:- Isothermal transformation diagram for a eutectoid steel (after Gladman11).
800 723 °C / stabte
Pearlite 600
/ ♦ Pearlite
End of transformation ^ -•C lB a in ite
OJ
|5 400
nj
c_
OJ
o_
Bainite
y
unstableStart of transformation
0
--200 1.0 100 1000
Time in s (tog scale)
When optimum alloy concentrations are achieved the transformation will be sufficiently suppressed hence continuous cooling transformation will begin with high nucleation rate but low growth rate. The end result is a eutectoid microstructure with fine pearlite grains (colonies). The pearlite lamellae themselves will be also reduced in thickness as a result of the lower transformation temperature (Garbarz14 , Marder and Bramfitt15).
Mehl16 proposed the following type of relationship between the interlamellae spacing (s) and the transformation
temperature:-s = K exp Q (2.1)
a R T
Alloy additions however, must be kept to an optimum level since increasing the alloy content beyond this may cause the formation of alloy carbides, for example Cr7C3 or Cr23C6 for high chromium additions. Also high alloy additions may retard the austenite transformation to an extent where bainite or martensite forms. For example the effect of excess manganese additions was studied by Samuel and Hussein17 who reported that a 12% Mn addition to a steel with 0.8% carbon transformed at 350°C, with a bainitic microstructure.
Hence, the effects on the eutectoid microstructure of relatively small additions of manganese, nickel or chromium would be to reduce the pearlite colony size and interlamellae spacing of the pearlite. However such changes would only be observed under conditions of continuous cooling. Under isothermal transformation conditions, the use of alloy additions may in fact cause coarser interlamellae spacing to be formed at given transformation temperature (Pelissier et al.,18 Mclvor19).
2.1.4 Effect of prior austenite grain size on eutectoid microstructure
At even faster cooling rates, near to the critical cooling rate at which martensite can form as opposed to pearlite, coarse grained austenite will encourage the formation of low temperature transformation product, i.e. bainite and martensite (Krauss10).Grain refining additives such as aluminium, titanium and vanadium which form nitrides and inhibit grain growth, produce opposite effects because of the grain refinement which they introduce, hence it is expected that from this fine austenitic grain size fine pearlite colony size are obtained (DeMeo and Subramanian22, Garbarz14). However, it is important to carefully control the amount of grain refinement additive, since excess of that needed for refinement precipitation will incur hardenability problems (Gladman11).
2.1.5 Strengthening mechanisms for eutectoid steels
To strengthen the eutectoid microstructure essentially means to provide obstacles to the movement of dislocations. Examples of strengthening mechanisms pertinent to the pearlitic microstructure may include grain / pearlite colony boundaries, interlamellae spacing and precipitates (Pickering23).
2.1.5.1 Grain size
I
pearlite colony size and morphologyHowever as the carbon content was increased up to the eutectoid composition the strength of the alloy becomes markedly dependant on the pearlite content and its morphological characteristics.
25
Early work on the effects of interlamellae spacing (Gensamer et al. ), on the yield strength of pearlite showed a negative linear relationship between strength and the logarithm of the interlamellae spacing, but other workers have since suggested an inverse relationship between strength and the interlamellae spacing or the square root of that spacing (Pickering23). There is no evidence that the pearlite colony size influences the strength of pearlite directly (Gladman11) , however there is literature to suggest that the pearlite colony size effects toughness (Krauss26, Hyak and Bernstein27). It was found that the pearlite colony size in eutectoid steels has a very similar effect on the impact transition temperature to that of the ferrite grain size in low carbon steels (Gladman11, Pickering23). This is as expected since a growing crack is probably deflected / impeded by a pearlite colony or ferrite grain boundary in exactly the same manner.
To date it appears that the general view is that the strength of steel consisting of a near or fully pearlitic microstructure is dominated by the interlamellae spacing, whereby maximum strength is obtained with fine interlamellae spacing (Gladman11, Pickering23).
In contrast, the strength of a hypo-eutectoid steel would depend upon a wider range of parameters such as the ferrite grain size and amount of solid solution strengthening (Pickering23, Honeycombe5, Pickering and Gladman28). The amount and morphology of the pearlite component would also require consideration especially in steels approaching the eutectoid composition (Pickering23).
2.1.5.2 Microalloy additions
This technique is commonly known as micro alloying, and can improve the strength of the alloy quiet dramatically (Garbarz14).
Nitride forming elements such as aluminium, vanadium and titanium can be used in medium to high carbon steels (Gladman11). Carbide forming micro alloying elements such as niobium and vanadium are also used, however niobium is restricted to low carbon steels because of its limited solubility in austenite (Gladman11, Pickering23). The micro alloying additions have other functions in these steels, for example grain size control using titanium produces very fine titanium nitride particles which are capable of inhibiting austenite grain growth at temperatures up to about 1300°C (George and
30 3 -1
Irani, Pickering ). Grain growth is important in that it effects not only the ferrite grain size but also the pearlite colony size and hence the toughness of the alloy (Gladman11).
2.1.6 Determination of optimum transformation temperature
To obtain optimum mechanical properties from a precipitation strengthened eutectoid steel, (for example a vanadium bearing eutectoid) it is important that the transformation from austenite to pearlite is carried out at a temperature which facilitates fine interlamellae spacing together with a dispersion of fine precipitates to pin dislocations (DeMeo and Subramanian22). If the austenite pearlite reaction was allowed to take place at high temperatures where nucleation is limited but growth is rapid, then the resultant microstructure would consist of coarse vanadium carbides / inter-lamellae spacing.
It can be concluded that to obtain optimum mechanical properties from a precipitation strengthened pearlitic steel, it is necessary to apply a cooling rate which allows transformation to take place at the optimum temperature. The resultant microstructure would consist of a large dispersion of fine vanadium carbides together with a pearlitic matrix whose inter-lamellae spacing would be relatively fine.
2.1.6.1 Determination of interlamellae spacing and distributions
The determination of interlamellae spacing is important in evaluating metallurgical changes, controlling overall product quality, and for prediction of product properties (Brogran and Mclvor32, Marder and Bramfitt15, Kavishe and Baker33).
The most versatile and most widely used technique is probably that involving the examination of shadowed carbon replicas taken from fully or partially transformed specimens, in which measurements are made on electron micrographs or on the fluorescent screen of the microscope (Ridley et al.34) The distance measured is usually of the average minimum observed spacing
Methods available for determining the minimum, true random and apparent spacing are reviewed by Reti et.al35, who suggests that the best method for determining the mean true spacing is to first calculate the mean random spacing.
This is because on calculating true interlamellae spacing value, variations in the spacing within the pearlite colony and the sectioning plane effect must be accounted for. Fowler36 has reviewed Reti / Vander Voorts technique and found that problems encountered when determining the random spacing i.e. difficulty in determining fine lamellae and tedious lamellae counting are elevated with automatic image analysis. This technique involves examining metallographic specimens using a scanning electron microscope and photomicrographs are made of pearlite colonies at a magnification of 10,000X. which are then scanned into the digital memory of an integrated image analysis system.
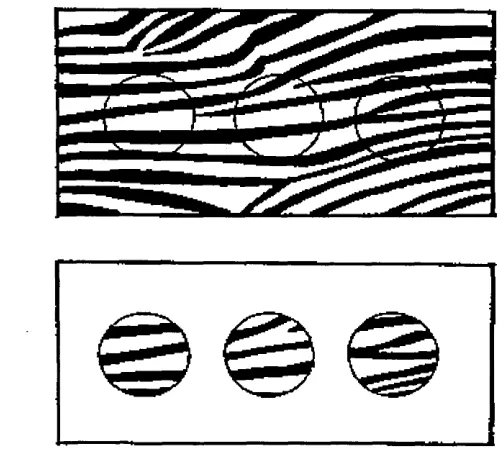
To separate the lamellae into discrete countable fields, a mask image is electronically superimposed over the image of the photomicrograph. This mask is composed of a circular test pattern of fifteen windows through which several random orientations of the lamellae are observable for counting. The diameter of the circular window multiplied by the number of windows is the total true line test length. Standard image analysis functions automatically count the numbers of lamellae appearing in the windows. The count data is used to calculate the mean random spacing and from this the mean true interlamellae spacing is derived (illustrated in figure 9).
Figure 9:- System for calculating the lamellae thickness / spacing (Fowler36)
Chapter 3
Bainitic Microstructure literature review
3.1 The bainite transformation
The bainite microstructure is formed on cooling from austenite between the temperature ranges at which pearlite and martensite form. Bainite consists of B.C.C laths and cementite, however the transformation mechanism produces a microstructure significantly different with respect to pearlite. (Krauss10)
Pearlite formation is controlled by diffusion mechanisms, where carbon diffusion and transfer of iron atoms across the austenite-pearlite interface define the colony of pearlite. Bainite however forms at lower temperatures, where even short range iron atom transfer is suppressed. As a result bainitic ferrite is nucleated by a co-operative iron atom shear mechanism (Christian
41
and Edmonds ), with the resultant microstructure consisting of lath or plate like ferrite as opposed to the lamellar morphology of pearlite and pro-eutectoid ferrite. The smaller carbon atom however is still able to diffuse somewhat, therefore various temperature dependent cementite particles are formed alongside the bainitic lath. In contrast to pearlite, the cementite particles are not continuous, leading to a metallographic definition of bainite as a structure
42
3.1.1 Bainite start temperature
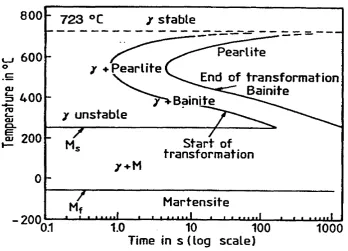
[image:40.633.72.440.332.677.2]Figure 10 shows a TTT diagram for a steel with 0.79 mass% carbon and 0.76 mass% manganese content (Krauss10) . Curves for the beginning and end of the bainite (and pearlite) transformation are shown with the horizontal broken line marking the transition between pearlite and bainite formation. There is a temperature above which bainite does not form, called the Bs (bainite start) temperature, which has been demonstrated using hot stage light microscopy (Bhadashia44).
Figure 10: TTT diagram for a 0.79 mass.% C, 0.76 mass.% Mn steel (Krauss10, “American Society for metals 1985)
•C
000
700
600
wSOO
C
300
200
100
1400
1200
1000
m
^ „ BHinniAB « WMwnBltny_
End of
TXT. DIAGRAM
O i ) 2 5 10 10* 10s 104
Empirical equations have been developed to express the bainite start temperature as a function of the steel chemistry, the most widely used is due to Steven and Haynes45 who determined the Bs temperature for a range of steels covering the composition
ranges:-Carbon 0.1-0.55
Silicon 0.1-0.35 Manganese 0.2-1.7
Nickel Chromium Molybdenum
0.0-5.0 0.0-3.5 0.0-1.0
and found
that:-Bs (°C) = 830 - 270wc - 90wMn - 37wNi - 70wCr - 83wMo (3.1)
where Wi= weight % of element / which is in solid solution in austenite
3.2 Bainite structure characterisation
Two morphologies of non lamellar ferrite cementite aggregate form in medium
45 46
carbon steels ( Mehl ; Hehemann ).
a) Upper bainite forms in the temperature range below that in which pearlite forms. Like pearlite fine aggregates of ferrite and carbide are developed, however “feathery” aggregates of laths or needle like ferrite particles with cementite precipitated in the inter-lath regions parallel to the long axis are developed (Christian and Edmonds41).
Some authors also characterise the difference between upper and lower bainite based on whether the transformation is above or below approximately 350°C (Matas and Hehemann48), although Pickering49 has shown that this distinction is not universally applicable (see figure 10). Additionally, attempts have been made to model the transition from upper to lower bainite based on the hypothesis that bainitic ferrite grows with the supersaturation of carbon in solid solution. The theory involves the comparison between the time required to reject the excess carbon into the residual austenite versus the time required to obtain a detectable degree of cementite precipitation in the bainitic ferrite. (Takahashi and Bhadeshia50).
An important characteristic of bainitic microstructures, especially relevant to their mechanical properties, is the nature and extent of carbide precipitation. In the following two subsections, the carbide precipitation reaction is discussed in relation to the transformation mechanism of bainite.
3.2.1 Upper bainite
As a consequence of the transformation to bainite, austenite enveloped between platelets of upper bainite becomes enriched in rejected carbon. The carbide phase associated with upper bainite precipitates from carbon enriched residual austenite and is nearly always cementite (Wever and Mathieu51, Lyman and Troiano52, Hultgren53, Austen and Schwartz54)
Hence the overall sequence is growth of bainitic ferrite, rejection of carbon to form cementite, back to growth of bainitic ferrite. When the temperature is below Tc however, subject to kinetics, carbide precipitation and growth of upper bainite is expected simultaneously.
The sequence of reactions are summarised as follows, a refers to the secondary ferrite which forms as the carbide precipitates from residual austenite
(Bhadeshia44):-Y Y + 0Cb supersaturated
CX'b unsaturated + Y enriched
unsaturated + OC + 0
T’0 = Temperature at which y and a of the same composition have the same free energy also accounting for the stored energy of ferrite.
Tc = Temperature below which cementite can in principle precipitate in association with upper bainitic ferrite.
Figure 11:- Schematic illustration of the thermodynamic condition which has to be satisfied before cementite may precipitate from the austenite (Bhadashia44)
iiiiiiii
. \ X \ \ \ \ \ \ N N N N % N ^ S N V N \ V
As noted previously the formation of cementite or other carbides leads to a reduction of the carbon concentration in the residual austenite, thereby permitting the growth of a further amount of ferrite (denoted a). The mechanism of this secondary ferrite reaction is not well understood.
Sandvik56 has proposed that the decomposition of the residual austenite involves the displacive formation of a triclinic carbide, and the subsequent formation of a small amount of bainitic ferrite. Whilst Nakamura and Nagakura57 have suggested that cementite nucleates directly on the ferrite / austenite grain boundary. They also proposed that the secondary ferrite, which they denote as bainite, grows martensitically from the carbide depleted austenite.
In planar sections, the cementite particles in upper bainite appear parallel to the traces of habit planes of the bainitic ferrite platelets. Fisher58 described these particles as irregular ribbons in three dimensions particularly in bainite formed at elevated temperatures. Additionally the precipitation of cementite from supersaturated austenite is probably initiated at austenite grain boundaries, hence these carbides will be relatively coarse and detrimental to the mechanical properties, especially toughness in high strength steels (Pickering23).
3.2.2 Lower bainite
Lower bainite consists of a non lamellar aggregate of ferrite and two kinds of carbides. (Bhadashia44). As with upper bainite there is some precipitation of carbide from the enriched austenite between the bainite plates. However there is also a fine dispersion of carbides (s- carbide or cementite) within the ferritic plates (discussed in section 3.2.2.1).
stages:-1) Precipitation of a nearly “carbide free ferrite spine”.
2) Sympathetic nucleation of “secondary ferrite” plates usually only one side and at an angle of approximately 55 to 60° to the initiating spine.
3) Precipitation of carbides in the austenite at the a/y boundary forming gaps between adjacent “secondary ferrite plates”
4) Annealing then fills gaps with further growth of ferrite and additional carbide precipitation causing the sheaf to lose its original serrated appearance not far behind its leading edges.
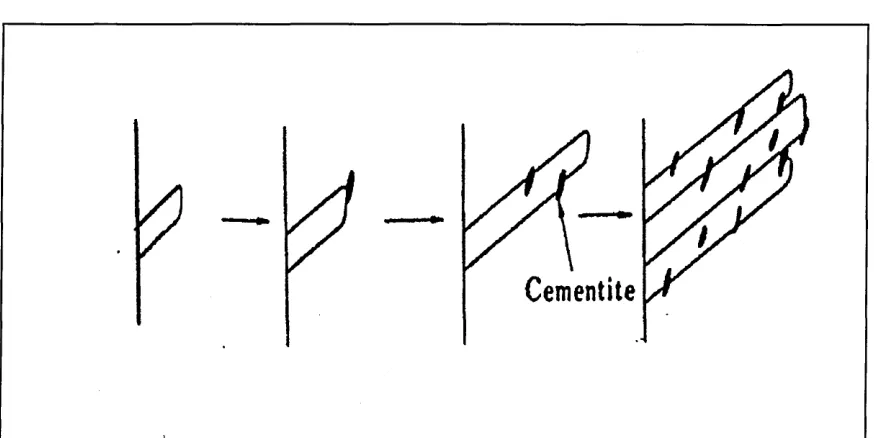
[image:45.615.40.477.410.629.2]Annealing out ferrite : ferrite boundaries formed by lateral impingement of adjacent “secondary plates” further contributes to the appearance of lower bainite sheaves as monolithic ferrite plates containing embedded carbides. The ferrite spine corresponds to the smooth side of lower bainite plates first observed by Oblak and Hehemann60 and subsequently reported by other authors (Yada and Ooka61).
Figure 12:- Schematic representation of the mechanism of carbide precipitation suggested by Ohmori et. al62
The alternative theory summarised by Christian and Edmonds41 suggests that lower bainite forms first as supersaturated ferrite, and that precipitation within this ferrite is then a subsequent stage of the reaction. The precipitation within the ferrite laths is then a result of relief precipitation (Ko and Cottrell63) or in-situ precipitation once a sub unit of bainite has ceased to grow, where because of increased driving force and low mobility of the carbon atom, diffusion to austenite it limited.
3.2.2.1 Precipitation within the lower bainite ferrite plate
Carbides found within any given bainitic ferrite plate usually occur in a single crystallographic orientation. Cementite carbides have the longest axes inclined at 60° to the “growth direction” of the ferrite platelets (ASTM, Irvine and Pickering64, Speich65, Shimizu and Nishyama66, Shimizu et al.67,). This angle quoted however varies as a function of the plane section, it has been shown that for lower bainite ferrite the cementite precipitates on the (112)a so that the true angle between the a and the cementite habit plane normal is approximately 57°(Bhadashia44).
Early experimental work using Curie point measurements and dilatometry gave indirect indications that s-carbide as well as cementite was associated with lower bainite, (Wever and Lange68, Allen et. al69. Antia et al70.). Austin and Swartz71 first identified the presence of s-carbide (Fe2.4C) in lower bainite and since then similar results have been reported by several investigators. (Matas and Hehemann48, Deliry72, Pomey73, Oblak and Hehemann60).
Additionally rj-carbide (Fe2C) has also been observed in lower bainitic ferrite obtained by transforming the austenitic matrix of a high silicon cast iron (Franetovic et al.75).
3.2.2.2 Precipitation between lower bainite ferrite platelets
The precipitation of carbides within the bainitic ferrite plate by the decomposition of the carbon into a mixture of cementite and ferrite is identical to the precipitation of carbides in the upper bainite microstructure. However, because some of the carbon is already tied up in the form of carbides within the ferrite lath, a reduced amount of interplate cementite is observed (Hehemann47). An important consequence of this is that lower bainite often has a higher toughness than upper bainite even though it is usually the stronger of the two.
3.3 Transition temperature between upper and lower bainite
The division in the bainitic range into upper and lower bainite was first suggested by Mehl46 based on microstructural differences, implying that in most steels there should be a fairly sharp change in morphology. The transition is usually found to occur at approximately 350°C and not to be very dependant on composition (Christian and Edmonds41), but Pickering49 found appreciably higher transition temperatures in lower carbon steels (containing 0.5% molybdenum) rising to a maximum of ~550°C at ~0.5 wt.% carbon and then decreasing again as illustrated in figure 13.
As an example, consider a steel with carbon content of 0.8 mass%, if isothermally transformed at 400°C the resultant microstructure would consist of upper bainite, whereas a 0.4 mass % carbon steel transformed at the same temperature would possess a lower bainite microstructure.
Figure 13: The temperature of the transition between upper and lower bainite versus carbon content. (Pickering23,49).
700-
600-EXTRAPOLATED Acm
/
UPPER BAINITE
4>
^ 500
• PRESENT RESULTS
• PUBLISHED RESULTS
LOWER BAINITE
200
0 0.2 0.4 0.6 08 LO
12
Carbon Content, wt.
%
3.4 Crystallography of bainite
It is thought that the properties of the bainitic microstructure depend upon the crystallographic texture that develops as a consequence of the transformation from austenite (Bhadeshia44). Bainite growth is in the form of clusters of platelets called sheaves, with minimum misorientation between the platelets within any given sheaf. Where they impinge, adjacent platelets are separated by low misorientation grain boundaries. Relative orientations of the bainitic ferrite and its parent austenite are close to the classic Kurdjumov-Sachs76 and Nishiyama-Wasserman77 relationships as shown in figure 14. It can be seen that these two relationships differ only by a relative rotation of 5.25° about the normal to the parallel close packed planes of the two structures. Accuracy is of paramount importance, since the orientation relationship does not account for all input parameters, for example the lattice invariant deformation. In the case of bainite, (also of lath martensite) such predictions are also difficult to achieve because of the experimental difficulties in retaining austenite. In spite of these problems, experimental data always lie well within the “bain region” which
encompasses the Kurdjumov-Sachs76 and Nishiyama-Wasserman77
[image:49.612.63.460.494.712.2]relationships.
Figure 14:- Stereographic representation of the Kurdjumov-Sachs76 and Nishiyama-Wasserman77 relationships.
QQIo _ ■010
110100
3.4.1 Bain region definition
The Bain strain is the pure part of the lattice deformation which for displacive transformations in steels converts austenite into ferrite or martensite (Bain78), see chapter 4 section 4.1.
During the Bain strain, no plane or direction is rotated by more than 11° so that any pair of corresponding planes or directions may be made parallel by utilising the lattice deformation with a rotation of no more than 11° (Crosky et al.79). This then defines the Bain region, where it is expected that the experimentally observed orientation relation will lie within this region, close to the Kurdjimov- Sachs / Nishiyama-Wasserman relationship.
Bhadeshia and Edmonds80 along with many other investigators found that all the platelets / laths within a sheaf or packet have a common orientation. However Sarikaya et al.81 has claimed that although some groups of adjacent laths have a common orientation, others have different variants of the orientation relationship, or in lower bainite are twin related. One suggested reason for single orientation relationship is that the individual laths of a sheaf or packet are not separate crystals but continuously connected proportions of the growth front from one original nucleus. At relatively high temperatures during bainite formation, dislocation generation from plastic deformation brought about by the shape change prevents the forward growth of a lath after it has attained a certain size. Initiation and growth of a new platelet or lath only resumes by the breakaway of a part of the original interface in close proximity to the tip (Bhadeshia44).
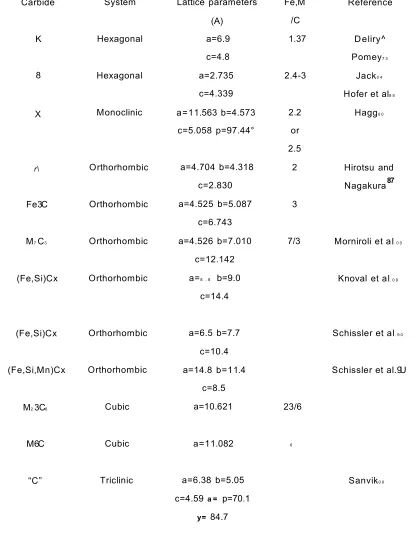
3.5 Crystallography of carbide precipitation in bainite
Table 3:- Crystal structures of carbides. (Bhadeshia44).
Carbide System Lattice parameters
(A)
Fe,M /C
Reference
K Hexagonal a=6.9
c=4.8
1.37 Deliry^
Pomey7 3
8 Hexagonal a=2.735
c=4.339
2.4-3 Jack0 4
Hofer et al8 5
X Monoclinic a=11.563 b=4.573
c=5.058 p=97.44°
2.2 or 2.5
Hagg0 0
I r\ Orthorhombic a=4.704 b=4.318
c=2.830
2 Hirotsu and
87
Nagakura
Fe3C Orthorhombic a=4.525 b=5.087
c=6.743
3
M7C3 Orthorhombic a=4.526 b=7.010
c=12.142
7/3 Morniroli et al. 0 0
(Fe,Si)Cx Orthorhombic a=8 . 8 b=9.0
c=14.4
Knoval et al. 0 9
(Fe,Si)Cx Orthorhombic a=6.5 b=7.7
c=10.4
Schissler et al. 9 0
(Fe,Si,Mn)Cx Orthorhombic a=14.8 b=11.4
c=8.5
Schissler et al.9U
M23C6 Cubic a=10.621 23/6
M6C Cubic a=11.082 6
“C” Triclinic a=6.38 b=5.05
c=4.59 a = p=70.1
y= 84.7
3.5.1 The orientation relationship of Cementite
As in the case of martensite, the most frequently observed orientation relationship, called the tempering or Bagaryatski91 relationship is found to
be:-{001}e II {211}a
<1OO>0 II <011>a
The second most frequent observed a/0 orientation relationship which is also consistent with the tempering of martensite
is:-{001 }e II {215}a
<1OO>0 within 2.6° of <311 >a <O1O>0 within 2.6° of <131>a
For cementite that precipitates during the formation of upper bainite Shackleton and Kelly92 have showed that a large number of observed orientation relationships are all rationalised if it is assumed that the cementite precipitates from austenite with the Pitsch216 y/0
relationship:-{001 }0 II {225}y
<100>e within 2.6° of <554>y <010>e within 2.6° of <110>y
The 0/a orientation relationship found by Isaichev93 has also been reported for the cementite within lower bainitic ferrite (Ohmori94, Huang and Thomas95, which is quite close to the Bagaryatski
relationship:-{103}e II {101 }a <O1O>0 II <111>a
3.5.2 The orientation relationship between epsilon (s) carbide
Epsilon carbide is found to occur in the form of plates which are approximately 6-20 nm thick and 70-400 nm long (Huang and Thomas95). The carbide ferrite interface tends to be ragged and forms the orientation
relationship:-(101 )a II relationship:-(1011), (211)a II (1010), (011 )a II (0001). (1T1 )a II (1211),
This relationship was first deduced by Jack84 in tempered martensite structures, Huang and Thomas95 have since confirmed that the s-carbide found in lower bainite obeys the same orientation relationship with bainitic ferrite as found during the tempering of martensite.
3.5.3 Orientation relationship of eta (r|) carbide
This transition carbide, is usually associated with the tempering of martensite, (Hirotsu and Nagakura87) where the martensite / carbide orientation relationship was found to
be:-(110)nll {010}a
Eta carbide has been recently found in a high silicon lower bainitic ferrite alloy (Franetovic et al.75), where electron diffraction confirms
that:-[O11]0 II <100>a II <011 >y
3.5.4 Orientation relationship of chi (%) carbide
Chi carbide is a transition carbide which is metastable with respect to cementite. It was first found in the tempered martensite structure, where the use of high magnification electron microscopy revealed interpenetrating layers of cementite and % carbide. It was initially thought that this structure simply consisted of faulted cementite, further investigations however, revealed that these “faults” corresponded to regions of % carbide, each only a few interplaner spacings thick, where the {200}x planes are found to be parallel to the {001 }e planes of slightly different spacings (Bhadeshia44).
3.6 Structure property relationships in the bainitic microstructure
The quantification of the mechanical properties of an upper or lower bainitic microstructure is by no means straightforward due to its complex nature comprising of many possible structures and strengthening mechanisms (Pickering23) , for example
i) Packets of lath like ferrite grains of low misorientation between grains.
49 96
(Pickering , Honeycombe and Pickering ).
ii) Variable dislocation density and dislocation arrays between ferrite laths.
iii) large carbides at ferrite lath, prior austenite boundaries, and carbides within the ferrite laths in lower bainite.
iv) Alloy enriched ferrite islands or high carbon bainite, martensite or even retained austenite between ferrite laths, i.e. the martensite-austenite (MA) constituent.
It can be concluded that some difficulties will arise in attempting to describe the individual effects of all these features quantitatively on the mechanical properties.
3.6.1 Hardness
For fully bainitic microstructures, the hardness is approximately linearly related to the carbon concentration, by 190 Hv per wt% ( Irvine and Pickering97). This contrasts with a change of about 950 Hv per wt.% of carbon for untempered martensite, where most of the carbon is in solid solution. The austenitising temperature does not influence the hardness unless it is not high enough to dissolve all the carbides (Irvine and Pickering97). Also the hardness of bainite was found to be independent of the prior austenite grain size, even though this in turn influences the bainite sheaf thickness (Kamada et al.98). This is not unexpected given that the bainite sub-unit (packet size) is hardly influenced by the prior austenite grain size and since the sub-units are much smaller they exert an overriding influence on strength (Bhadeshia44).
NB:- In most cases microstructures obtained are often mixed, in which case the hardness will depend on the transformation temperature and composition.
3.6.2 Proof strength
Bainite steels do not possess a definite yield point, instead continuous yielding is observed hence the yield strength usually refers to the 0.2% proof strength. The major strengthening mechanisms are due to bainitic ferritic “grain size” (packets) , dislocations, carbide dispersion and solid solution strengthening. It
97 49
One additional point to note however is that the transformation temperature is related to the steel composition ( Steven and Haynes45), hence equation 1 can be used to determine the approximates 0.2% proof strength value:
0.2% PS = 170 + 1300 (wt.% C) + 160 (wt.% Mn) + 160 (wt.% Cr)+ 130(wt.%Mo) +8 8(wt.%Ni)
+ 63 (wt.% W ) + 45 ( wt.% Cu ) + 270 ( wt.% V). (3.2)
47
Pickering showed that the proof strength increased linearly with the reciprocal of the square root of the mean linear intercept of the “bainitic ferrite” grain size and also increased with the increasing density of carbide particles.
The contribution of “bainitic ferrite grain size” to proof strength was investigated
99 100 49
by several workers, (Bush and Kelly , Gladman et al , Pickering ). Conclusions drawn suggested that the bainitic ferrite grain size contributed less than 50% of the proof strength.
Equation 3.3 was developed (Pickering23) to relate the proof strength to the individual effects of the bainite ferrite grain size, d, and the number of carbide particles per unit planer section of the structure, n.
Proof strength (8y ) = -191 + 17.2 d -V* + 14.9 n V* (3-3)
Figure 15:- Contributions of the bainitic ferrite grain size and carbide dispersion strengthening to the 0.2% proof stress of low carbon bainitic microstructures contain 0.05 - 0.15 wt. % carbon
(Pickering23).
lO O O r
o
o_
tn
<n a> To 'oo
800
600
400
-0 200
-N° of carbides per mm2 n ^ ,J* in mm
O 10 20 30 40
Dispersion
Grain size
Matrix strength
5 10 15 20 25 30
Bainitic ferrite grain size in
99
It has also been suggested ( Bush and Kelly ), that strengthening from dislocations, which can be quite substantial due to the shear component of the bainite transformation, should be taken into consideration.
8d = 1.2x10⁻³ (cp)1/a (3.4)
Where cp is the dislocation density in lines cm "2
An assessment has also been made on the effect of the MA (martensite- austenite) constituent which is usually found in bainite formed during continuous cooling. The contribution to the proof strength from the MA phase has been reported to
be:-5MA=360 + 900(fMA) (3.5)